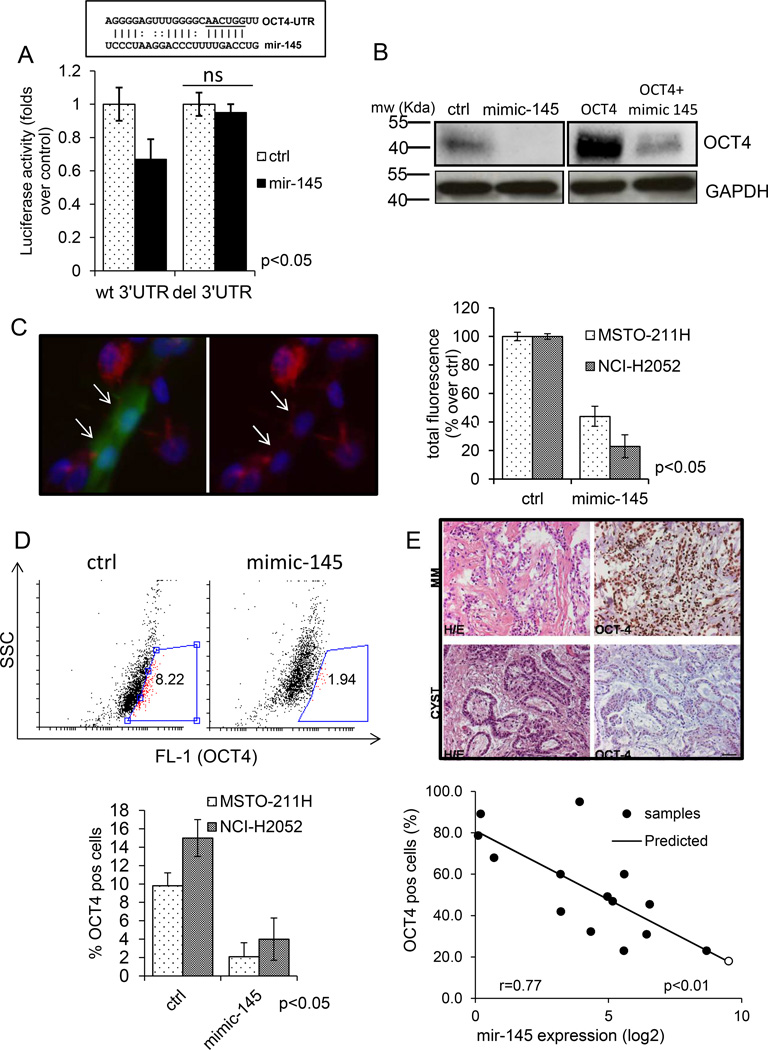
Figure 4. Mir-145 targets OCT4 in MPM cell lines A. Upper panel.
Schematic representation of the mir-145 target sequence within the OCT4 3’UTR (+138 to +157bp). Lower panel. Transfection of HEK293 cells with mimic-145 inhibited the translation of a luciferase-expressing plasmid containing a wt-3’UTR from OCT4 and not that of a its 3’UTR deleted counterpart. Histogram bars represent mean ± standard deviation of at least two independent replicates Statistics: NS, not significant. B. Representative western blotting analysis of whole cell lysates from control and mimic-145 transfected cells, either mock-transfected (left panels) or transfected with an OCT4 expression vector (retaining the wt 3’UTR region of the gene) (right panels) and stained with anti-OCT-4 antibodies or anti-GAPDH as a loading control. C Left panel: indirect immunofluorescence staining of MSTO-211H cells transfected with GFP (green, arrows) and cotransfected with either control or mimic-145, fixed and stained with OCT4 antibody (red). Nuclei were revealed by DAPI staining (blue). Scale bar: 10µm. Right panel: Semi-quantitative evaluation of the results from MSTO-211H and NCI-H2052 cells transfected as in left panel. Histogram bars represent mean ± standard deviation of at least two independent replicates. The p-value refers to matched control vs mimic-145 transfected samples. D. Upper panel. FACS plot. MSTO-211H cells transfected with control (left) or mimic-145 (right) stained with OCT4 antibodies. Percentage of OCT4 positive cells (gate:red) was calculated after subtracting the background (cells stained with isotype matched antibody). Lower panel. Histogram bars represent mean ± standard deviation of at least two independent replicates of MSTO-211H and NCI-H2052 cells treated as from upper panel. The p-value refers to matched control vs mimic-145 transfected samples. E. The levels of mir-145 and OCT4 inversely correlate in vivo. Upper panel. Representative images of paraffin-embedded sections of mesothelioma (”MM”) or benign mesothelial tissue (“cyst”) stained with Haematoxylin-Eosin (left) or with OCT4 antibody (right). Scale bar, 100µm. Quantitative evaluation of mir-145 levels (x-axis: Log2 expression intensity) and number of OCT4 positive cells (y-axis: percentage) in mesothelioma (black circles) vs benign mesothelial tissues (white circles). Straight line: predicted values. r value from a linear regression model is reported in the text.

