

Summary
Unconjugated monoclonal antibodies (mAbs) are an important component of effective combination therapies for chronic lymphocytic leukaemia (CLL). Antibody‐dependent phagocytosis (ADP) is a major mediator of mAb cytotoxicity, but there is limited knowledge of the determinants of ADP efficacy. We used macrophages derived in vitro from autologous circulating monocytes to test the effects of mAb structure and concentration, target : effector cell ratio, duration of co‐incubation and CLL cell CD20 expression on ADP. Next‐generation anti‐CD20 mAbs (ofatumumab, ublituximab, obinutuzumab, ocaratuzumab) were significantly more effective at inducing ADP compared to rituximab, but none were as effective as the anti‐CD52 mAb alemtuzumab. Ofatumumab (10 μg/ml) used as a representative next‐generation anti‐CD20 mAb achieved an ADP plateau at 3 h co‐incubation with a target : effector ratio of 10 : 1 (mean = 2·1 CLL cells/macrophage, range = 1·5–3·5). At 0·156 μg/ml (the lowest concentration tested) ofatumumab ADP was significantly higher than alemtuzumab. However, ofatumumab‐induced ADP did not increase significantly at higher mAb concentrations. We show that anti‐CD20 mAb ADP efficacy is determined by the mAb characteristics, target : effector ratio and incubation time. We suggest that preclinical evaluation of anti‐CD20 mAbs to understand the determinants of ADP could be useful in designing future combination therapies for CLL.
Keywords: alemtuzumab, antibody‐dependent phagocytosis, anti‐CD20 monoclonal antibodies, chronic lymphocytic leukaemia, CLL, macrophage, obinotuzumab, ocaratuzumab, ofatumumab, rituximab, ublituximab
Introduction
Unconjugated monoclonal antibodies (mAbs) are an important component in the treatment of chronic lymphocytic leukaemia (CLL), and their use in combination therapy has improved treatment responses and increased the overall survival of patients 1. Despite the proven efficacy of this class of drugs, the mechanisms of action of mAbs are not understood fully 2. An improved knowledge of how mAbs kill CLL cells in vivo is required to overcome resistance to these drugs and optimize treatment efficacy.
Our current understanding of the mechanisms of action of mAbs in the treatment of CLL is that they utilize primarily the cytotoxic effector functions of the innate immune system 2, 3, 4, 5, 6, 7, 8. In CLL the anti‐CD20 mAbs and the anti‐CD52 mAb alemtuzumab mediate their therapeutic effects by complement‐dependent cytotoxicity (CDC), natural killer (NK) cell and granulocyte antibody‐dependent cellular cytotoxicity (ADCC) and antibody‐dependent phagocytosis (ADP). Recent evidence indicates that macrophage‐mediated ADP plays a particularly important role in this process in patients with CLL 4, 5, 6, 9. However, there is still limited knowledge of the cytotoxic capacity of ADP for malignant B cells and the determinants of the efficacy of ADP.
We hypothesized that macrophages have a finite capacity for ingesting and killing anti‐CD20 mAb opsonized CLL cells. Optimization of anti‐CD20 mAb treatment regimens will thus require a detailed understanding of the determinants of ADP. In this study we used macrophages derived in vitro from autologous circulating monocytes to test the effect of mAb structure and concentration, target : effector cell ratio, duration of incubation and CLL cell antigen expression on ADP. All the tested anti‐CD20 mAbs and alemtuzumab promote ADP. The next‐generation anti‐CD20 mAbs tested induced significantly higher ADP compared to rituximab, but none were as effective as alemtuzumab. Ofatumumab induced ADP reached a plateau at a CLL cell : macrophage ratio of 10 : 1 for 3 h, strongly suggesting saturation of the process. These findings provide a basis set of preclinical data that can be used to design clinical trials aimed at optimizing therapy of CLL with regimens containing anti‐CD20 mAbs.
Materials and methods
Specimens
This study was performed at the University of Rochester NY and Mayo Clinic Rochester MN with approval from both Institutional Review Boards using 74 blood specimens obtained from 67 previously untreated consenting patients with CLL diagnosed by standard criteria 10. Peripheral blood mononuclear cells (PBMC) were isolated from 20–30 ml of fresh ethylenediamine tetraacetic acid (EDTA) anti‐coagulated whole blood by density gradient centrifugation (Ficoll‐Paque PLUS; GE Healthcare, Maple Grove, MN, USA). Monocytes were then selected using a CD14‐positive selection kit (Stemcell Tech, Vancouver, BC, Canada) and cultures initiated within 4 h of specimen collection. The CD14‐negative PBMC fraction underwent negative selection to a CLL cell purity of ≥ 80% (human B cell enrichment kit without CD43 depletion; Stemcell Tech) and was stored in liquid nitrogen, as described previously 11.
Reagents
Rituximab (Genentech, South San Francisco, CA, USA), ofatumumab (GlaxoSmithKline, Brentford, UK), obinutuzumab (Genentech) and alemtuzumab (Genzyme‐Sanofi, Cambridge, MA, USA) were obtained from the institutional pharmacies. Ublituximab was a generous gift from TG Therapeutics (New York, NY, USA) and ocaratuzumab was a generous gift from Mentrik Bioteck (Dallas, TX, USA). All mAbs were used at a concentration of 10 μg/ml unless specified otherwise. This concentration of rituximab, ofatumumab and alemtuzumab has been shown previously to be saturating for CLL cells 11, 12.
Phagocytosis assays
Macrophages were differentiated from peripheral blood monocytes using a method adapted from that of Leidi et al. 13. Cells derived from the monocyte purification step were resuspended at a concentration of 1.0 × 10⁶ cells/ml in RPMI‐1640 medium (Life Technologies, Carlsbad, CA, USA) supplemented with 10% heat‐inactivated fetal bovine serum (HI‐FBS) (Sigma‐Aldrich, St Louis, MO, USA) and penicillin/streptomycin/glutamine (Life Technologies) to make complete medium. To initiate macrophage differentiation, the complete medium was supplemented with 10 ng/ml of macrophage colony‐stimulating factor (M‐CSF) (R&D Systems, Minneapolis, MN, USA). Of this suspension, 300 µl (3·0 × 105 cells) was plated in each well of a 96‐well flat‐bottomed plate under sterile conditions and incubated for 5 days at 37°C with 95% humidity and 5% CO2. On day 5, 150 μl of medium was removed carefully without disrupting the adherent macrophages and replaced with fresh media containing a final concentration of 10 ng/ml M‐CSF and 20 ng/ml of interleukin (IL)‐10 (R&D Systems) and the cultures incubated for an additional 2 days. Target CLL cells for the co‐culture experiments were thawed as described previously 11, labelled with the membrane dye PKH26 using a Red Fluorescent Cell Linker Kit (Sigma‐Aldrich) and incubated for 1 h in AIM‐V media (Life Technologies). One macrophage well was then harvested by vigorous agitation in residual culture medium using a 200 μl pipette and then washing twice with 200 μl cold phosphate‐buffered saline (PBS) containing 2 mg/ml mouse immunoglobulin (Ig)G (Lampire Biological Laboratories, Pipersville, PA, USA) added to reduce cell clumping. Complete collection of the adherent macrophages was confirmed by microscopic examination of the harvested well. Prior to setting up the co‐culture experiments, the effector cells (harvested macrophages) and target cells (PKH26‐labelled CLL cells) were analysed by flow cytometry. Cells were labelled with anti‐CD11b fluorescein isothiocyanate (FITC) (eBioscience, San Diego, CA, USA) and anti‐CD19 peridinin chlorophyll (PerCP) (BD Biosciences, Franklin Lakes, NJ, USA) antibodies and TO‐PRO‐3 (Life Technologies) was added to identify dead cells 14. Flow cytometry was then used to determine the percentage of viable (TO‐PRO‐3‐negative) macrophages (CD11b‐positive, CD19‐negative) and CLL (PKH26‐positive, CD19‐positive) cells. These data were used to calculate the number of target cells that needed to be added to each well to obtain the required target : effector ratio for each experiment. Experiments were started by removing 150 μl medium from each well without disrupting the macrophage cell layer, and replacing this with an equal volume of AIM‐V medium containing the calculated number of PKH26‐labelled CLL cells, with the test mAb and human C5‐deficient serum (Sigma‐Aldrich) to achieve the required final concentrations. The human C5‐deficient serum (final concentration 10%) provided both a consistent amount of serum Ig to decrease non‐specific macrophage phagocytosis and allowed for mAb‐mediated non‐lytic opsonization by early complement components. The well without therapeutic mAb served as a control for baseline macrophage phagocytosis of the labelled CLL cells. Unless noted otherwise, in our standard conditions to measure ADP, CLL cells and macrophages at a ratio of 5 : 1 were co‐incubated for 3 h at 37°C with 95% humidity and 5% CO2 and then quenched with 2 mg/ml of mouse IgG on ice.
Phagocytosis was measured by a quantitative flow cytometric method using Count Bright Absolute Counting Beads (Life Technologies). The CLL cells (lymphocyte gate) and macrophages were gated by forward‐ and side‐scatter using standard flow cytometric methods. The absolute number of non‐phagocytized non‐macrophage adherent target B cells (B cell count) was determined from the CD11b‐negative PKH26‐positive cells in the CLL gate of the scatterplot (Fig. 1a). The increase in the mean number of CLL cells phagocytized by each macrophage due to ADP was determined by subtracting the baseline value achieved for no‐mAb controls for each mAb experiment. For comparison of mAb efficacy the %ADP for each experiment was calculated as ×100 (1–experimental B cell count with mAb/control B cell count without mAb).
Figure 1.
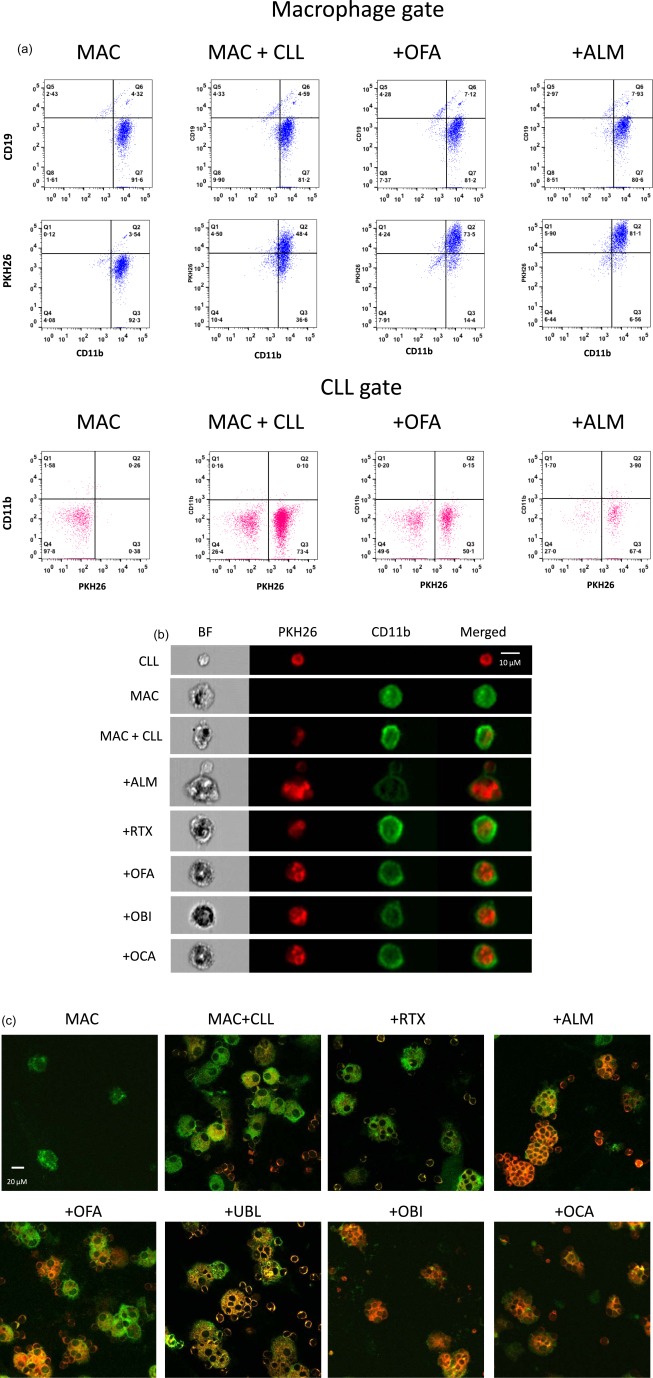
Measurement of macrophage phagocytosis. (a) Flow cytometric analysis. Cells harvested from macrophage–chronic lymphocytic leukaemia (CLL) cell co‐cultures were analysed by flow cytometry. Cells in the macrophage gate on the forward‐/side‐scatter plot are coloured blue and cells in the lymphocyte (CLL) gate are coloured red. The macrophage‐only culture (MAC) was comprised primarily of macrophages (CD11b+ CD19−) but also contains a smaller population of ‘passenger’ lymphocytes (CD11b– cells seen in the CLL gate) derived from cells that contaminated the starting monocyte population. After co‐culture of macrophages with PKH26‐labelled CLL cells (MAC + CLL), the macrophages showed increased staining with PKH26 but remained negative for expression of CD19, indicating phagocytosis rather than adherence of PKH26‐labelled CLL cells to macrophages. Addition of ofatumumab (+OFA) to the macrophage–CLL cell co‐cultures increased macrophage staining by PKH26 but not CD19, and resulted in a marked decrease in the number of CD11b negative PKH26+ CLL cells. These changes are indicative of antibody‐dependent phagocytosis (ADP). Alemtuzumab (+ALM) induced more ADP than OFA. (b) Imaging flow cytometry. Representative cells harvested from the macrophage–CLL cell cultures were examined by high‐resolution imaging flow cytometry. CLL cell membranes were stained with PKH26 (red) prior to co‐incubation and macrophages (MAC) were stained with anti‐CD11b antibodies (green) after harvesting the cells. (c) Confocal microscopy. Cells harvested from co‐cultures were cytospun onto glass slides for imaging. Photomicrographs of CLL cells (PKH26+, red) and macrophages (CD11b+, green) demonstrate increased phagocytosis in cultures containing therapeutic monoclonal antibodies (mAb), with many macrophages containing multiple phagocytized CLL cells. BF = bright field; OBI = obinutuzumab; OCA = ocaratuzumab; RTX = rituximab; UBL = ublituximab.
Baseline parameters for experiments were established by testing a range of numbers of monocytes for culture initiation, duration of co‐incubation and target : effector ratios. Because of the need to establish cultures as soon as possible, analysis of the effectiveness of the monocyte enrichment step was performed only after starting the monocyte cultures. The 300 000 mononuclear cells/well used to initiate macrophage cultures contained a mean of 148 000 monocytes/well (range = 67 000–297 000) yielding a mean of 70 000 macrophages/well (range = 20 000–156 000) at 7 days. Macrophages phagocytic activity was confirmed by testing with 10 μm diameter coumarin‐dyed Fluoresbrite polystyrene beads (Polysciences, Inc., Warrington, PA, USA), which was inhibited by 1 μM cytochalasin D (Sigma‐Aldrich) 15, 16.
We used two visual methods to confirm macrophage phagocytosis of CLL cells. For Imagestream imaging flow cytometer analysis using ideas software (Amnis, Seattle, WA, USA), cells were washed with ice‐cold PBS and then concentrated to a final volume of 70 μl in PBS‐IgG and analysed immediately using an AlexaFluor 700‐labelled anti‐CD11b antibody (BD Biosciences) (Fig. 1b). For confocal microscopy, 1 × 10⁵ harvested cells in a Shandon EZ Cytofunnel (ThermoFisher Scientific, Waltham, MA, USA) were centrifuged for 5 min at 113 g (1000 rpm) in a Shandon Cytospin 4 (ThermoFisher Scientific). Slides were air‐dried, fixed with 3·7% paraformaldehyde in PBS for 5 min and rinsed with water. A drop of Vectashield (Vector Laboratories, Inc., Burlingame, CA, USA) was added to each slide, which was then sealed with a coverslip and nail polish (Electron Microscopy Sciences, Hatfield, PA, USA), stored at 4°C and visualized using a Laser Scanning Confocal Microscope I (FV1000 Olympus, Center Valley, PA, USA) with images prepared using FluoView software (Fig. 1c). To confirm further that our results represent phagocytosis of CLL cells by macrophages accurately, we measured the percentage of cells in the macrophage gate that were positive for expression of CD19 and CD11b (macrophages with adherent CLL cells that had not undergone phagocytosis). As shown in Fig. 1a, this represented a small percentage of cells in the macrophage gate (<10%). Because CLL adherence to macrophages is an essential first step in phagocytosis, we expected a small percentage of CLL cells to be adherent to macrophages. Our subsequent time‐elapsed video studies of ADP using anti‐CD20 mAb have shown short periods of adherence of PKH26‐labelled target CLL cells to macrophages followed by either phagocytosis or disassociation. No stable rosette formation of CLL cells around macrophages was detected (data not shown). In addition, ADP was inhibited by 1 μM cytochalasin D (data not shown).
Quantification of CLL CD20 and CD52 expression levels
CD20 and CD52 expression were quantified with a Quantum MESF FITC kit (Bangs Laboratories, Fishers, IN, USA), according to the manufacturer's instructions, using either a FITC‐labelled antibody to CD20 (BD Biosciences) or CD52 (Abcam, Cambridge, MA, USA), as described previously 11.
Statistical analysis
Phagocytosis of CLL cells was modelled using mixed analysis of variance (anova) models that accounted for correlations between data coming from the same subject with a subject‐specific random intercept term. The various conditions of interest, including drug concentration, duration of incubation, target : effector ratio and mAb, were treated as categorical fixed effects. The non‐parametric Wilcoxon signed‐rank test was used for a paired analysis that compared %ADP by rituximab to each other antibody. We also compared results obtained at the two different centres based on a two‐level categorical fixed effect variable (University of Rochester, Mayo Clinic) where appropriate, and this was found to be non‐significant (P > 0·27). Hypothesis tests were conducted at the 0·05 level of significance, and multiple comparisons were controlled for using Bonferroni corrections when necessary. The Pearson product–moment correlation was used to calculate the correlations between CD20 or CD52 expression and %ADP. Intraclass correlation coefficients (ICCs) 17, which measure the proportion of the total variation that is due to between‐subject variation, were used to assess consistency in phagocytosis between assay replicates for the various mAbs in the subset of subjects with replicate assays performed. The assay is considered more reliable as the ICC approaches unity, with an ICC of 0·75 generally indicating good reliability 17. All mAbs studied had ICC > 0·82 indicating good interassay reliability, except rituximab, which had ICC = 0·52. SAS version 9.4 (SAS Institute, Inc., Armonk, NY, USA) and Matlab R2014a (The MathWorks, Inc., Natick, MA, USA) were used for all analyses.
Results
Baseline macrophage phagocytosis of CLL cells
The CLL cell phagocytic capacity of autologous monocyte‐derived macrophages was first determined in the absence of mAb. As shown in Fig. 2a, baseline CLL cell phagocytosis was increased by the availability of more target CLL cells (starting target : effector ratio of 1·25 : 1 with sequential doubling to 20 : 1, incubation time 3 h). At a target : effector ratio of 5 : 1, most baseline phagocytosis of CLL cells occurred within 4 h of initiation of co‐incubation (Fig. 2b).
Figure 2.
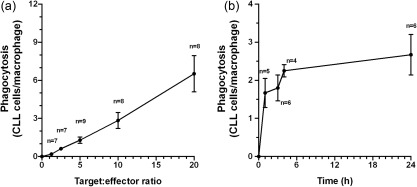
Baseline macrophage phagocytosis of chronic lymphocytic leukaemia (CLL) cells. CLL cell phagocytic capacity of autologous monocyte‐derived macrophages was measured in the absence of monoclonal antibodies. (a) Phagocytosis of CLL cells by macrophages (CLL cells/macrophage) increases in proportion to the target : effector ratio (3 h culture, data obtained from nine CLL patient specimens with no replicate assays). (b) Phagocytosis of CLL cells occurs rapidly over the first 4 h with less additional phagocytosis over the subsequent 20 h (target : effector ratio 5 : 1, data obtained from six CLL patient specimens with no replicate assays).
Determinants of ADP
ADP was first evaluated for ofatumumab and alemtuzumab over a range of target : effector ratios, durations of co‐culture and monoclonal antibody concentrations.
Target : effector ratios were compared from 1·25 : 1 with sequential doubling to 20 : 1 using 10 μg/ml of mAb and an incubation time of 3 h. The increase in the mean number of CLL cells phagocytized by each macrophage compared to the no‐mAb controls for each patient (ADP) (Fig. 3a) shows that ofatumumab was considerably less effective than alemtuzumab under these conditions (P < 0·0001). Ofatumumab‐induced ADP achieved a maximum mean phagocytosis of an additional 2·1 CLL cells/macrophage (range = 1·5–3·5) at a target : effector ratio of 10 : 1, with no additional increase at a target : effector ratio of 20 : 1 (P = 0·36). In contrast, alemtuzumab induced significantly more ADP as the target : effector ratio increased from 5 : 1 to 10 : 1 (P = 0·04) and 10 : 1 to 20 : 1 (P = 0·01). The mean alemtuzumab ADP at a target : effector ratio of 20 : 1 was an additional 8·5 CLL cells/macrophage (range = 3·6–14·8). The %ADP peaked at a target : effector ratio of 2·5 : 1 for ofatumumab (mean = 48%, range = 36‐61) and 5 : 1 for alemtuzumab (mean = 85%, range = 72–96) and then decreased progressively as the number of CLL cells available for phagocytosis increased (Fig. 3b).
Figure 3.
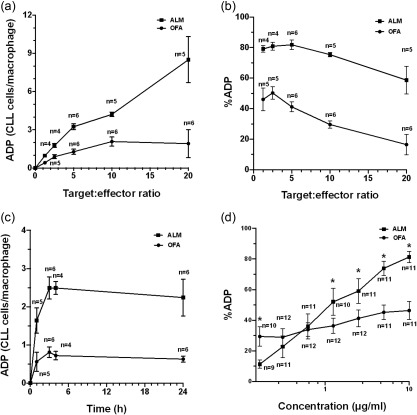
Antibody‐dependent phagocytosis (ADP). We tested the effects of variation of the target : effector ratio, duration of co‐culture and monoclonal antibody (mAb) concentration on ADP of chronic lymphocytic leukaemia (CLL) cells treated with ofatumumab (OFA) or alemtuzumab (ALM). ADP was measured as either the mean increase in the number of CLL cells phagocytized by each macrophage compared to no‐mAb controls for each patient (CLL cells/macrophage) or as the percentage increase of phagocytosis for each measurement compared to the no‐mAb control (%ADP). (a) Phagocytosis was compared at target : effector ratios of 1·25 : 1, 2·5 : 1, 5 : 1, 10 : 1 and 20 : 1 with 10 μg/ml of mAb and a 3 h co‐incubation in samples from nine CLL patients (three comparisons were performed in paired samples; there were no replicate assays). The ADP measured as the mean number of CLL cells phagocytized per macrophage increased with higher target : effector ratios for CLL cells opsonized with ALM. In contrast, ADP of cells opsonized with OFA reached a maximum (mean = 2·1 additional cells/effector, range = 1·5–3·5) at a target : effector ratio of 10 : 1. (b) %ADP was higher at lower CLL target levels and decreased as more target cells were available for phagocytosis. (c) ADP kinetics was measured at 1, 3, 4 and 24 h in co‐cultures using 10 μg/ml of mAb and a target : effector ratio of 5 : 1 in samples from six CLL patients (all samples were paired with no replicate assays). The mean number of CLL cells phagocytized by each macrophage increased for 3 h and then reached a plateau for both OFA and ALM. The same number of paired specimens were analysed at each point for ALM and OFA ADP. (d) Dose–responses were measured for OFA and ALM (concentrations 0·156, 0·31, 0·625, 1·25, 2·5, 5 and 10 μg/ml) in co‐cultures with target : effector ratios of 5 : 1 incubated for 3 h in paired samples from 12 CLL patients with no replicate assays. %ADP increased progressively in cells treated with ALM from 0·156 to 5 μg/ml, with no further significant increase from 5 to 10 μg/ml. In contrast, OFA was significantly more effective at inducing ADP compared to ALM at the lowest concentration tested (0·156 μg/ml) (P = 0·022), but at a mAb concentration of 1·25 μg/ml %ADP was significantly lower for OFA compared to ALM (P = 0·004). *Significant differences. Means and standard errors are displayed.
Kinetics of ADP were determined by measuring phagocytosis at 1, 3, 4 and 24 h in co‐cultures using 10 μg/ml of mAb and a target : effector ratio of 5 : 1. ADP increased rapidly up to 3 h (Fig. 3c). Although alemtuzumab was considerably more effective than ofatumumab (P = 0·0004), ADP appears to be saturated at 3 h, with no significant change in ADP with continued exposure of CLL cells to phagocytes at 24 h (P = 0·0851) (Fig. 3c). Duration of exposure of CLL cells to phagocytes after 3 h of co‐incubation in this model was not a limiting factor for phagocytosis.
The effects of mAb concentration for ofatumumab and alemtuzumab ADP were measured at mAb levels of 0·156 μg/ml, with sequential doubling to 10 μg/ml in co‐cultures with target : effector ratios of 5 : 1 incubated for 3 h. Alemtuzumab %ADP increased with mAb concentrations from 0·156 to 5 μg/ml, with no significant further increase in %ADP from 5 to 10 μg/ml (P = 0·19) (Fig. 3d). For ofatumumab, the %ADP did not increase significantly at concentrations of 1·25 μg/ml (P = 0·08) or above. Ofatumumab was more effective than alemtuzumab at inducing ADP at the lowest mAb concentration tested (0·156 μg/ml) (P = 0·022), but less effective than alemtuzumab at concentrations of 1·25 μg/ml and above (P < 0·005). These data suggest a fundamental difference in certain aspects of ofatumumab versus alemtuzumab‐induced ADP.
ADP by anti‐CD20 mAb
Next‐generation anti‐CD20 mAbs have been selected and engineered for increased CD20 affinity and Fc activity compared to rituximab, as reviewed recently 18. We compared the %ADP of four next‐generation anti‐CD20 mAbs (ofatumumab, ublituximab, obinutuzumab and ocaratuzumab) to the first‐generation anti‐CD20 mAb rituximab and the anti‐CD52 mAb alemtuzumab in experiments using standard conditions (target : effector ratio of 5 : 1, 10 μg/ml of mAb and incubation time of 3 h). Comparisons of all the studies performed shows that rituximab induces significantly less ADP than all the next‐generation anti‐CD20 mAbs (P < 0·0001), and that none of the anti‐CD20 mAbs are as effective as alemtuzumab (P < 0·0001) (Fig. 4a). To compare more precisely the ADP induced by these antibodies, we analysed the subset of experiments performed on the same sample at the same time with two or more mAb to minimize interpatient and interexperimental variation (paired samples). Comparison of mean %ADP with rituximab showed significantly higher activity for ofatumumab (19·3 versus 35·5%, P < 0·0001, n = 38), ublituximab (20·8 versus 44·1%, P < 0·0001, n = 19), obinutuzumab (19·6 versus 48·8%, P < 0·0004, n = 19) and ocaratuzumab (19·6 versus 40·8%, P = 0·0001, n = 19). The ADP of the next‐generation anti‐CD20 mAbs was compared in two discrete sets of experiments using paired samples. The differences between ublituximab and ofatumumab induced ADP did not reach significance when compared in 17 patient samples (Fig. 4b). In a separate set of 16 patient samples, obinutuzumab was significantly more effective than either ocaratuzumab or ofatumumab. Ocaratuzumab and ofatumumab ADP were not significantly different (Fig. 4c).
Figure 4.
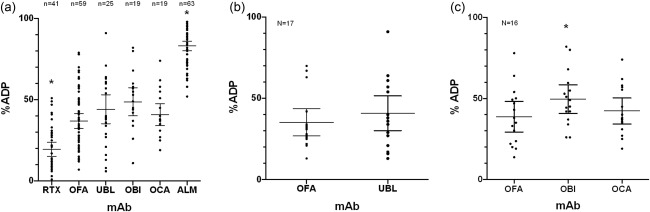
Antibody‐dependent phagocytosis (ADP) by therapeutic monoclonal antibodies. ADP was compared for five therapeutic anti‐CD20 monoclonal antibodies (mAbs) and the anti‐CD52 mAb alemtuzumab (ALM). All studies were performed with a target : effector ratio of 5 : 1, mAb concentration of 10 μg/ml and a co‐incubation time of 3 h. (a) Comparison of the %ADP in samples from 67 patients shows that rituximab (RTX) induces significantly less ADP than the next‐generation anti‐CD20 mAbs (OFA, UBL, OBI, OCA) (P < 0·0001) and that all the anti‐CD20 mAb induce significantly less ADP than ALM (P < 0·0001). Depending on the amount of sample available, two or three replicated experiments were performed on some patient samples and the mean of the results represented as a single point (RTX eight duplicate and six triplicate assays, OFA eight duplicate and six triplicate assays, UBL five duplicate and one triplicate assays, OBI four duplicate and six triplicate assays, OCA four duplicate and five triplicate assays). *Significant differences. To compare more effectively ADP induced by the next‐generation anti‐CD20 mAbs, we restricted analysis to the subset of assays shown in Fig. 4a performed using the same patient samples at the same time. (b) The comparison between ADP induced by OFA (mean = 35%) and UBL (mean = 42%) in 17 paired patient samples showed no significant difference (P = 0·55). (c) The comparison between ADP induced by OFA (mean = 37%), OBI (mean = 52%) and OCA (mean = 41%) in a separate set of 16 patient samples showed that OBI was significantly more effective than OCA (P = 0·038) or OFA (P = 0·002), but that there was no difference in activity between OCA and OFA (P = 0.87). Means and 95% confidence intervals of the mean are displayed. *Significant differences. OBI = obinutuzumab; OCA = ocaratuzumab; OFA = ofatumumab; UBL = ublituximab.
Antigen expression and ADP
The level of target CLL cell membrane antigen expression could be an important determinant of ADP. To evaluate this relationship we measured the expression of CD20 and CD52 and compared this to %ADP (target : effector ratio of 5 : 1, mAb concentrations 10 μg/ml, 3 h incubation). CD52 expression (mean = 76 370 molecules/cell, range = 16 789–147 002) was considerably higher than CD20 expression (mean = 9754 molecules/cell, range = 2068–24 450) (P < 0·0001). There was no significant correlation between the level of expression of CD52 and alemtuzumab %ADP (P = 0·76) (Fig. 5). Ublituximab showed a modest but significant correlation between CD20 levels and %ADP (Pearson's correlation r = 0.56, P = 0·02), but there were no significant correlations for rituximab, ofatumumab, obinutuzumab or ocaratuzumab.
Figure 5.
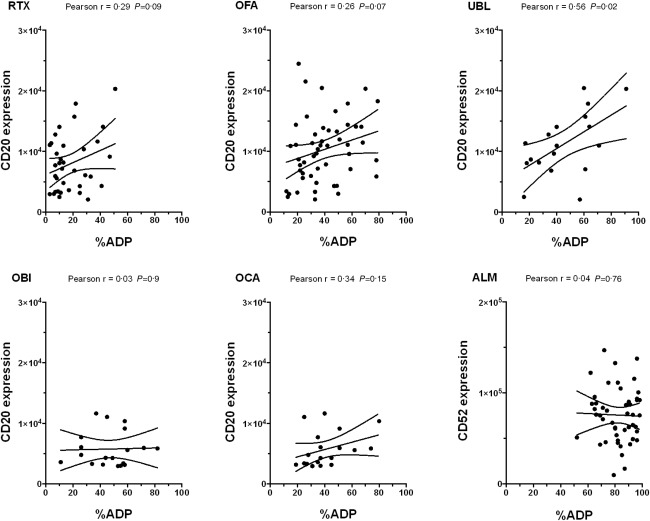
Monoclonal antibody (mAb) target levels and antibody‐dependent phagocytosis (ADP). %ADP was compared to expression of CD20 for RTX, OFA, UBL, OBI and OCA and to expression of CD52 for ALM. All assays were performed using a target : effector ratio of 5 : 1, a mAb concentration of 10 μg/ml and a 3‐h co‐incubation. There was a significant but modest correlation between CD20 levels and %ADP for ublituximab only. ALM = alemtuzumab; OBI = obinutuzumab; OCA = ocaratuzumab; OFA = ofatumumab; RTX = rituximab; UBL = ublituximab.
To examine for a relationship between antigen expression and %ADP at mAb concentrations less than 10 μg/ml, we analysed data from nine to 12 patient samples tested with alemtuzumab and ofatumumab at concentrations ranging from 0·156 to 10 μg/ml using a mixed model with %ADP as outcome (data not shown). CD20 expression was not associated significantly with %ADP (P = 0·58), but there was a significant difference in the interaction between CD52 expression and %ADP that varied according to alemtuzumab concentration (P = 0·013). These observations are based on a modest but non‐significant correlation between CD52 expression and %ADP at an alemtuzumab concentration of 0·156 μg/ml (r = 0·67, P = 0·07) that is lost at higher alemtuzumab concentrations.
Discussion
This study shows that autologous monocyte‐derived macrophages are capable of phagocytosis of CLL cells in vitro and that the rate and amount of phagocytosis is increased by mAbs targeting CD20 or CD52. The data provide support for our hypothesis that macrophages have a finite capacity for ingesting anti‐CD20 mAb opsonized CLL cells. The ADP induced by the next‐generation anti‐CD20 mAbs tested in this study are significantly better than rituximab even in patients with low levels of CD20 expression, supporting ongoing development of these drugs. However, all the anti‐CD20 mAbs tested were significantly less effective at inducing ADP than alemtuzumab, suggesting that a clearer understanding of alemtuzumab‐induced ADP could be helpful in developing methods to improve the efficacy of anti‐CD20 mAbs.
Elimination of all tumour cells capable of proliferation could be curative in patients with CLL and related indolent B cell lymphomas and will probably require multi‐drug therapeutic regimens, including anti‐CD20 mAbs. ADP, a principal mechanism of action of the anti‐CD20 mAbs 5, 6, 9, can kill a fraction of target CLL cells in vitro, but this mechanism has limited capacity and reaches saturation. Anti‐CD20 mAbs ADP capacity was not limited by mAb concentration, target CLL cell availability or duration of co‐incubation. Additional studies will thus be required to determine the factors limiting ADP 19, 20, 21.
Because anti‐CD20 mAbs target only B cells and have limited toxicity, there has been a sustained effort to improve their activity in CLL. In this study we show that rituximab has a low capacity to induce ADP in CLL cells and speculate that the low levels of CD20 expression in these cells, together with the lower duration of rituximab binding to CD20 22 at an epitope more remote from the cell membrane 23, make it more difficult for a macrophage to properly encircle and ingest a rituximab‐opsonized cell by the zipper mechanism of phagocytosis 24. Efforts to find more effective anti‐CD20 mAbs led to the development of ofatumumab, which achieves longer CD20 binding because of a lower off‐rate than rituximab 22. Molecular engineering to increase mAb affinity for antigen and for Fc receptors yielded several additional next‐generation anti‐CD20 mAbs. Ublituximab 25 and obinutuzumab 26 have defucosylated Fc carbohydrate moieties with improved FcR affinity and ocaratuzumab 27 has amino acid sequence changes that increase both CD20 and FcR binding affinity. In our model we showed that obinutuzumab was significantly more effective at inducing in‐vitro ADP compared to the other anti‐CD20 mAbs tested. However, obinutuzumab ADP induction was significantly inferior to the non‐engineered anti‐CD52 mAb alemtuzumab. This suggests that mAb engineering has not yet overcome the limitations of targeting the lower‐density antigen CD20 in CLL cells.
To understand more clearly the role of antigen expression in ADP, we compared CLL cell CD20 and CD52 expression with %ADP. Classic studies, first reported more than 40 years ago, showed that IgG opsonization of erythrocytes promoted in‐vitro phagocytosis and in‐vivo clearance of circulating erythrocytes in both animal models and in humans in proportion to the levels of antibody opsonization 28, 29, 30, 31. In the present study we demonstrate that, at saturating mAb concentrations, alemtuzumab binding to the approximately eightfold higher level of CD52 versus CD20 molecules available for binding by the anti‐CD20 mAbs results in considerably increased ADP. Conversely, under standard conditions, with the exception of ublituximab, there were no clear correlations between CD20 or CD52 expression and %ADP. This finding could be explained by multiple confounding factors, including differences between patients’ monocyte‐derived macrophages and CLL cells as well as insufficient differences in expression of CD20 or CD52 between patients’ cells.
There are limited data on the effect of mAb concentration on ADP. In this study we show that ofatumumab and alemtuzumab have distinct mAb concentration–response curves that could be informative with regard to their mechanisms of action. At the lowest mAb concentration tested ofatumumab induced significantly more ADP than alemtuzumab, but alemtuzumab induced significantly more ADP at mAb concentrations of 1·25 μg/ml and above (Fig. 3d). Both alemtuzumab and ofatumumab have non‐modified human IgG1 constant regions, suggesting that the Fc–FcR interactions are likely to be similar. Our findings probably reflect differences in mAb binding to antigen and antigen density. One testable hypothesis is that ofatumumab has higher antigen affinity than alemtuzumab, and thus induces higher ADP at lower mAb concentrations as suggested by previously published data 32. However, as the mAb concentration increases and more antigen is ligated, the effect of the considerably higher CD52 density compared to CD20 prevails and alemtuzumab becomes more effective than ofatumumab. A possible clinical implication of this finding is that near maximal levels of ofatumumab ADP could be achieved in patients treated with lower doses of this mAb.
The potential in‐vivo limitations of ADP in patients with CLL include the finite phagocytic capacity of fixed (tissue) macrophages, limited access of mAb‐ligated CLL cells to fixed macrophages, low mAb levels in lymphoid tissues, loss of mAb target antigen by trogocytosis 33 and intrinsic resistance of subpopulations of CLL cells to ADP. Optimizing ADP will require an improved mechanistic understanding and the development of safe and rational methods to optimize this innate immune cytotoxic mechanism. For example, patients could be treated with lower doses of mAbs that lead to effective but saturating levels of ADP, and dosing would be repeated only when the macrophages recover their phagocytic capacity 14, 34. Our data suggest that more frequent administration of lower doses of next‐generation anti‐CD20 mAbs could maintain ADP without causing exhaustion of the effector system. Macrophage capacity could also be increased by stimulation of innate immune function, including cytokines and Toll‐like receptor (TLR) agonists or inhibition of myeloid‐specific immune check‐points 8. In contrast, recently published data suggest that the Bruton's tyrosine kinase (BTK) inhibitor ibrutinib and the phosphoinositide 3‐kinase inhibitor (PI3K)δ inhibitor idelalisib could cause reversible inhibition of macrophage phagocytosis 35, 36, 37. Our model could thus be useful in preclinical testing of multi‐drug regimens including an anti‐CD20 mAb.
The novelty and strengths of this study include the use of autologous monocytes derived from fresh blood specimens provided by untreated patients with CLL to generate macrophages and the appreciable number of specimens studied. The utility of the assay developed is supported by the reproducibility of the results performed at two centres by two research teams. The limitations of our data are largely intrinsic to the multi‐centre conduct of the research and the limited number of monocytes that can be obtained from patients’ blood samples. Because of regulatory restrictions and the rapid pace of drug development we were not able to conduct direct comparisons of all the next‐generation anti‐CD20 mAbs. The mAb concentration, target : effector ratio and time–course studies were performed with ofatumumab, which was the only next‐generation anti‐CD20 available at study initiation. Due to the limited monocytes availability we were not able to perform all experiments in duplicate. However, high intraclass correlations in experiments performed in duplicate or triplicate validated the use of all our data. Purification of the low concentrations of monocytes from peripheral blood by positive selection is relatively inefficient, and the repeated purification steps required to achieve high levels of purity can decrease the monocyte yield markedly. We thus elected to use monocyte populations that were less purified to initiate our macrophage cultures. However, the measured level of contaminating ‘passenger’ lymphocytes was low and unlikely to have caused appreciable ADCC by NK cells or phagocytosis of non‐labelled contaminating CLL cells. The value of our data could be limited by differences between the in‐vitro‐derived macrophages and the in‐vivo fixed‐tissue macrophages. The origin, longevity and function of fixed tissue macrophages in humans and especially in patients with CLL are not known completely, and the similarity of these cells with our cytokine‐induced macrophages is even less well understood. In addition, the interaction between fixed tissue macrophages in the liver and spleen and circulating CLL cells is dynamic and transient compared to the static and longer duration in our culture system 38. However, our model could provide an improved simulation for preclinical investigation because of the use of autologous patient‐derived monocytes in a relatively short duration culture using a target : effector ratio that facilitates detection of changes in ADP compared to the rates of intrinsic baseline phagocytosis.
In conclusion, we have used a novel assay to show that the magnitude of ADP is determined by the number of available target cells, capacity of macrophages to phagocytize mAb ligated CLL cells, mAb properties and the duration of interaction between macrophages and CLL cells. This assay can now be used for preclinical testing of novel mAb to determine the factors that influence macrophage ADP capacity, and to understand the characteristics of CLL cells that influence their sensitivity to ADP. These data could be useful in achieving the goal of using mAb to achieve an ongoing phagocytosis of CLL cells that would optimize therapeutic outcome.
Disclosure
C. S. Z. has been principal investigator of studies at Mayo Clinic supported by Novartis, GlaxoSmithKline, Biothera and Genzyme‐Sanofi. T. E. W. is the principal investigator of studies at Mayo Clinic funded by Novartis. The other authors have no disclosures.
Author contributions
This study was designed and supervised by C. S. Z., G. S. N. and T. E. W. N. A. B. worked with C. S. Z. to develop and validate the ADP assay. A. K. C. performed the experiments at the Mayo Clinic and K. R. V. performed the experiments at the University of Rochester. Data were analysed by A. M. B. All authors participated in the reporting of this study results and were involved in writing the manuscript.
Acknowledgements
Funding was provided by a Wilmot Foundation Grant (C. S. Z.), the University of Iowa/Mayo Clinic Lymphoma SPORE (CA097274) (T. E. W., C. S. Z., G. S. N.) and the Predolin Foundation. The authors wish to acknowledge the considerable contributions of Dr Ronald P. Taylor who enthusiastically provided valuable ideas, insights and critiques. Drs Jonathan W. Friedberg and W. Richard Burack provided important critiques of the work. We thank Wojciech Wojciechowski, of the Flow Cytometry Shared Resource Laboratory, and Linda Callahan and Paivi Jordan of the Confocal and Conventional Microscopy SRL for technical support with ImageStream data acquisition and analysis and confocal imaging at the University of Rochester. This work was made possible by the generous donation of blood samples from consenting patients.
References
- 1. Hallek M, Fischer K, Fingerle‐Rowson G et al Addition of rituximab to fludarabine and cyclophosphamide in patients with chronic lymphocytic leukaemia: a randomised, open‐label, phase 3 trial. Lancet 2010; 376:1164–74. [DOI] [PubMed] [Google Scholar]
- 2. Taylor RP, Lindorfer MA. Analyses of CD20 monoclonal antibody‐mediated tumor cell killing mechanisms: rational design of dosing strategies. Mol Pharmacol 2014; 86:485–91. [DOI] [PMC free article] [PubMed] [Google Scholar]
- 3. Uchida J, Hamaguchi Y, Oliver JA et al The innate mononuclear phagocyte network depletes B lymphocytes through Fc receptor‐dependent mechanisms during anti‐CD20 antibody immunotherapy. J Exp Med 2004; 199:1659–69. [DOI] [PMC free article] [PubMed] [Google Scholar]
- 4. Lefebvre ML, Krause SW, Salcedo M, Nardin A. Ex vivo‐activated human macrophages kill chronic lymphocytic leukemia cells in the presence of rituximab: mechanism of antibody‐dependent cellular cytotoxicity and impact of human serum. J Immunother 2006; 29:388–97. [DOI] [PubMed] [Google Scholar]
- 5. Montalvao F, Garcia Z, Celli S et al The mechanism of anti‐CD20‐mediated B cell depletion revealed by intravital imaging. J Clin Invest 2013; 123:5098–103. [DOI] [PMC free article] [PubMed] [Google Scholar]
- 6. Gul N, Babes L, Siegmund K et al Macrophages eliminate circulating tumor cells after monoclonal antibody therapy. J Clin Invest 2014; 124:812–23. [DOI] [PMC free article] [PubMed] [Google Scholar]
- 7. Golay J, Introna M. Mechanism of action of therapeutic monoclonal antibodies: promises and pitfalls of in vitro and in vivo assays. Arch Biochem Biophys 2012; 526:146–53. [DOI] [PubMed] [Google Scholar]
- 8. Weiskopf K, Weissman IL. Macrophages are critical effectors of antibody therapies for cancer. MAbs 2015; 7:303–10. [DOI] [PMC free article] [PubMed] [Google Scholar]
- 9. Pallasch CP, Leskov I, Braun CJ et al Sensitizing protective tumor microenvironments to antibody‐mediated therapy. Cell 2014; 156:590–602. [DOI] [PMC free article] [PubMed] [Google Scholar]
- 10. Hallek M, Cheson BD, Catovsky D et al Guidelines for the diagnosis and treatment of chronic lymphocytic leukemia: a report from the International Workshop on Chronic Lymphocytic Leukemia (IWCLL) updating the National Cancer Institute‐Working Group (NCI‐WG) 1996 guidelines. Blood 2008; 111:5446–56. [DOI] [PMC free article] [PubMed] [Google Scholar]
- 11. Baig NA, Taylor RP, Lindorfer MA et al Induced resistance to ofatumumab‐mediated cell clearance mechanisms, including complement‐dependent cytotoxicity, in chronic lymphocytic leukemia. J Immunol 2014; 192:1620–9. [DOI] [PMC free article] [PubMed] [Google Scholar]
- 12. Baig NA, Taylor RP, Lindorfer MA et al Complement dependent cytotoxicity (CDC) in chronic lymphocytic leukemia (CLL): Ofatumumab enhances alemtuzumab CDC and reveals cells resistant to activated complement. Leuk Lymphoma 2012; 53(11):2218–2227. [DOI] [PMC free article] [PubMed] [Google Scholar]
- 13. Leidi M, Gotti E, Bologna L et al M2 macrophages phagocytose rituximab‐opsonized leukemic targets more efficiently than m1 cells in vitro . J Immunol 2009; 182:4415–22. [DOI] [PubMed] [Google Scholar]
- 14. Beurskens FJ, Lindorfer MA, Farooqui M et al Exhaustion of cytotoxic effector systems may limit monoclonal antibody‐based immunotherapy in cancer patients. J Immunol 2012; 188:3532–41. [DOI] [PMC free article] [PubMed] [Google Scholar]
- 15. Yeo JC, Wall AA, Stow JL, Hamilton NA. High‐throughput quantification of early stages of phagocytosis. BioTechniques 2013; 55:115–24. [DOI] [PubMed] [Google Scholar]
- 16. Flannagan RS, Jaumouille V, Grinstein S. The cell biology of phagocytosis. Annu Rev Pathol 2012; 7:61–98. [DOI] [PubMed] [Google Scholar]
- 17. Shrout PE, Fleiss JL. Intraclass correlations: uses in assessing rater reliability. Psychol Bull 1979; 86:420–8. [DOI] [PubMed] [Google Scholar]
- 18. Kellner C, Derer S, Valerius T, Peipp M. Boosting ADCC and CDC activity by Fc engineering and evaluation of antibody effector functions. Methods 2014; 65:105–13. [DOI] [PubMed] [Google Scholar]
- 19. Gustafson MP, Abraham RS, Lin Y et al Association of an increased frequency of CD14(+) HLA‐DR(lo/neg) monocytes with decreased time to progression in chronic lymphocytic leukaemia (CLL). Br J Haematol 2012; 156:674–6. [DOI] [PMC free article] [PubMed] [Google Scholar]
- 20. Maffei R, Bulgarelli J, Fiorcari S et al The monocytic population in chronic lymphocytic leukemia shows altered composition and deregulation of genes involved in phagocytosis and inflammation. Haematologica 2013; 98:1115–23. [DOI] [PMC free article] [PubMed] [Google Scholar]
- 21. Boissard F, Fournie JJ, Laurent C, Poupot M, Ysebaert L. Nurse like cells: chronic lymphocytic leukemia associated macrophages. Leuk Lymphoma 2015; 56 :1570–1572. [DOI] [PubMed] [Google Scholar]
- 22. Teeling JL, French RR, Cragg MS et al Characterization of new human CD20 monoclonal antibodies with potent cytolytic activity against non‐Hodgkin lymphomas. Blood 2004; 104:1793–800. [DOI] [PubMed] [Google Scholar]
- 23. Teeling JL, Mackus WJ, Wiegman LJ et al The biological activity of human CD20 monoclonal antibodies is linked to unique epitopes on CD20. J Immunol 2006; 177:362–71. [DOI] [PubMed] [Google Scholar]
- 24. Griffin FM Jr, Griffin JA, Leider JE, Silverstein SC. Studies on the mechanism of phagocytosis. I. Requirements for circumferential attachment of particle‐bound ligands to specific receptors on the macrophage plasma membrane. J Exp Med 1975; 142:1263–82. [DOI] [PMC free article] [PubMed] [Google Scholar]
- 25. de Romeuf C, Dutertre CA, Le Garff‐Tavernier M et al Chronic lymphocytic leukaemia cells are efficiently killed by an anti‐CD20 monoclonal antibody selected for improved engagement of FcgammaRIIIA/CD16. Br J Haematol 2008; 140:635–43. [DOI] [PubMed] [Google Scholar]
- 26. Mossner E, Brunker P, Moser S et al Increasing the efficacy of CD20 antibody therapy through the engineering of a new type II anti‐CD20 antibody with enhanced direct and immune effector cell‐mediated B‐cell cytotoxicity. Blood 2010; 115:4393–402. [DOI] [PMC free article] [PubMed] [Google Scholar]
- 27. Forero‐Torres A, de Vos S, Pohlman BL et al Results of a phase 1 study of AME‐133v (LY2469298), an Fc‐engineered humanized monoclonal anti‐CD20 antibody, in FcgammaRIIIa‐genotyped patients with previously treated follicular lymphoma. Clin Cancer Res 2012; 18:1395–403. [DOI] [PubMed] [Google Scholar]
- 28. Schreiber AD, Frank MM. Role of antibody and complement in the immune clearance and destruction of erythrocytes. II. Molecular nature of IgG and IgM complement‐fixing sites and effects of their interaction with serum. J Clin Invest 1972; 51:583–9. [DOI] [PMC free article] [PubMed] [Google Scholar]
- 29. Ehlenberger AG, Nussenzweig V. The role of membrane receptors for C3b and C3d in phagocytosis. J Exp Med 1977; 145:357–71. [DOI] [PMC free article] [PubMed] [Google Scholar]
- 30. Kabbash L, Esdaile J, Shenker S et al Reticuloendothelial system Fc receptor function in systemic lupus erythematosus: effect of decreased sensitization on clearance of autologous erythrocytes. J Rheumatol 1987; 14:487–9. [PubMed] [Google Scholar]
- 31. Lindorfer MA, Kohl J, Taylor RP. Interactions between the complement system and Fcg receptors In: Ackerman ME, Nimmerhahn F, eds. Antibody Fc: linking adaptive and innate immunity. Philadelphia: Elsevier Press, 2014:49–74. [Google Scholar]
- 32. Bleeker WK, Munk ME, Mackus WJ et al Estimation of dose requirements for sustained in vivo activity of a therapeutic human anti‐CD20 antibody. Br J Haematol 2008; 140:303–12. [DOI] [PubMed] [Google Scholar]
- 33. Taylor RP, Lindorfer MA. Fcgamma‐receptor‐mediated trogocytosis impacts mAb‐based therapies: historical precedence and recent developments. Blood 2015; 125:762–6. [DOI] [PubMed] [Google Scholar]
- 34. Zent CS, Taylor RP, Lindorfer MA et al Chemoimmunotherapy for relapsed/refractory and progressive 17p13 deleted chronic lymphocytic leukemia (CLL) combining pentostatin, alemtuzumab, and low dose rituximab is effective and tolerable and limits loss of CD20 expression by circulating CLL cells. Am J Hematol 2014; 89:757–65. [DOI] [PMC free article] [PubMed] [Google Scholar]
- 35. Da Roit F, Engelberts PJ, Taylor RP et al Ibrutinib interferes with the cell‐mediated anti‐tumor activities of therapeutic CD20 antibodies: implications for combination therapy. Haematologica 2015; 100:77–86. [DOI] [PMC free article] [PubMed] [Google Scholar]
- 36. Borge M, Almejun MB, Podaza E et al Ibrutinib impairs the phagocytosis of rituximab‐coated leukemic cells from chronic lymphocytic leukemia patients by human macrophages. Haematologica 2015; 100:e140–142. [DOI] [PMC free article] [PubMed] [Google Scholar]
- 37. Duong MN, Matera EL, Mathe D et al Effect of kinase inhibitors on the therapeutic properties of monoclonal antibodies. MAbs 2015; 7:192–8. [DOI] [PMC free article] [PubMed] [Google Scholar]
- 38. Hepburn AL, Mason JC, Wang S et al Both Fcgamma and complement receptors mediate transfer of immune complexes from erythrocytes to human macrophages under physiological flow conditions in vitro . Clin Exp Immunol 2006; 146:133–45. [DOI] [PMC free article] [PubMed] [Google Scholar]