Significance
The dopamine (DA) transporter (DAT) stringently controls brain DA levels. Several addictive psychostimulants, antidepressants, and attention-deficit/hyperactivity disorder (ADHD) therapeutics inhibit DAT function, and multiple DAT mutants have been reported in ADHD, autism spectrum disorder, and infantile Parkinsonism. Given that aberrant DAT function underlies many pathological conditions, it is critical to understand intrinsic regulatory mechanisms that modulate DAT function. DAT availability at the cell surface is dynamically modulated, but the mechanisms controlling this process are not well understood. In the current study, we identified the penultimate mechanism that controls DAT stability at the cell surface. Moreover, by genetically manipulating this mechanism, we successfully rescued an ADHD-associated DAT mutant with intrinsic membrane instability. Thus, targeting DAT regulatory mechanisms may be a viable approach for treating dysregulated DAT.
Keywords: dopamine, ADHD, membrane trafficking, tyrosine kinase, reuptake
Abstract
The dopamine (DA) transporter (DAT) facilitates high-affinity presynaptic DA reuptake that temporally and spatially constrains DA neurotransmission. Aberrant DAT function is implicated in attention-deficit/hyperactivity disorder and autism spectrum disorder. DAT is a major psychostimulant target, and psychostimulant reward strictly requires binding to DAT. DAT function is acutely modulated by dynamic membrane trafficking at the presynaptic terminal and a PKC-sensitive negative endocytic mechanism, or “endocytic brake,” controls DAT plasma membrane stability. However, the molecular basis for the DAT endocytic brake is unknown, and it is unknown whether this braking mechanism is unique to DAT or common to monoamine transporters. Here, we report that the cdc42-activated, nonreceptor tyrosine kinase, Ack1, is a DAT endocytic brake that stabilizes DAT at the plasma membrane and is released in response to PKC activation. Pharmacologic and shRNA-mediated Ack1 silencing enhanced basal DAT internalization and blocked PKC-stimulated DAT internalization, but had no effects on SERT endocytosis. Both cdc42 activation and PKC stimulation converge on Ack1 to control Ack1 activity and DAT endocytic capacity, and Ack1 inactivation is required for stimulated DAT internalization downstream of PKC activation. Moreover, constitutive Ack1 activation is sufficient to rescue the gain-of-function endocytic phenotype exhibited by the ADHD DAT coding variant, R615C. These findings reveal a unique endocytic control switch that is highly specific for DAT. Moreover, the ability to rescue the DAT(R615C) coding variant suggests that manipulating DAT trafficking mechanisms may be a potential therapeutic approach to correct DAT coding variants that exhibit trafficking dysregulation.
Dopamine (DA) is a modulatory neurotransmitter critical for locomotion and reward (1), and dopaminergic (DAergic) dysregulation is linked to multiple neuropsychiatric disorders, including Parkinson’s disease, schizophrenia, attention-deficit/hyperactivity disorder (ADHD), and autism spectrum disorder (ASD) (2, 3). Presynaptic recapture, facilitated by the high-affinity DA transporter (DAT), spatially and temporally restricts extracellular DA availability (4–6). Addictive psychostimulants that target DAT and its monoamine transporter homologs for 5HT (SERT) and NE (NET) are either competitive ligands, such as cocaine, or competitive substrates, such as amphetamine (7). Although these drugs interact with DAT, SERT, and NET with equimolar affinity, their binding to DAT is requisite for reward (8, 9). Transporter inhibitors with differential DAT, SERT, and NET specificity are widely used to treat neuropsychiatric disorders (10, 11). However, their therapeutic efficacy differs significantly among patients, consistent with the model that monoamines may differentially contribute to the pathogenesis of these disorders (10, 12). Thus, regulatory mechanisms specific to DAT, SERT, or NET may provide a novel route to develop transporter-specific therapeutics.
DAT plasma membrane expression is requisite for efficacious extracellular DA removal and to replenish presynaptic DA stores (13). Indeed, DAT allelic and coding variants have been identified in a variety of neuropsychiatric disorders, including ADHD, ASD, infantile Parkinsonism, and bipolar disorder (14–20), underscoring that even subtle DAT functional changes exert impactful consequences on DAergic neurotransmission. DAT is acutely regulated by membrane trafficking, and either protein kinase C (PKC) activation or AMPH exposure rapidly deplete DAT surface expression (5, 7, 21, 22). Intriguingly, a DAT coding variant, R615C, identified in an ADHD proband, exhibits profound membrane instability due to highly accelerated basal endocytosis (16), suggesting that dysregulated DAT membrane trafficking may contribute to the etiology of DA-related disorders.
Studies from our laboratory (23) and others (24) indicate that a unique negative regulatory mechanism, or “endocytic brake,” stabilizes DAT surface expression. PKC activation releases the endocytic brake, accelerates DAT internalization, and thereby reduces DAT surface levels and function. The cellular basis of this negative regulatory mechanism are completely undefined. Moreover, it is unknown whether the endocytic brake exists in DAergic terminals and whether it is specific to DAT.
Activated by cdc42 kinase 1 (Ack1) is a nonreceptor tyrosine kinase that is a major cdc42 effector activated via EGF, PDGF, and m3 muscarinic receptor stimulation (25, 26). Ack1 binds directly to clathrin heavy chain (27, 28) and is enriched in presynaptic terminals (29). Importantly, Ack1 is inactivated by PKC (26), and a recent study demonstrated that Ack1 overexpression suppresses endocytosis (30). Given these attributes, we asked whether Ack1 activity is the penultimate step that engages the DAT endocytic brake.
Results
Ack1 Negatively Regulates DAT, but Not SERT Endocytosis.
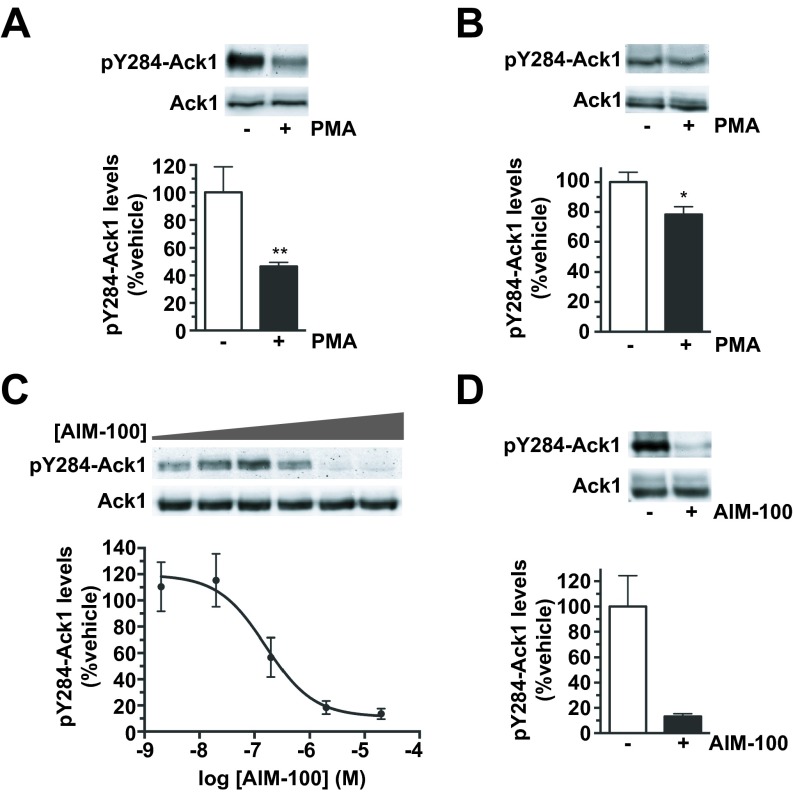
Ack1 and its active, autophosphorylated form, pY284-Ack1 (pAck1) (25, 31), were readily detected in both the DAergic cell line SK-N-MC and mouse striatum (Fig. S1 A and B). PKC activation significantly decreased pAck1 in both SK-N-MC cells (46.5 ± 3.0% control levels; Fig. S1A) and mouse striatum (78.3 ± 5.2% control levels; Fig. S1B). Likewise, the highly specific Ack1 inhibitor AIM-100 (32) dose-dependently decreased pAck1 in SK-N-MC cells (Fig. S1C) and dramatically decreased mouse striatal pAck1 to 13.2 ± 2.2% control levels (Fig. S1D). Thus, Ack1 is expressed in DAergic cell lines and striatum, and either PKC activation or AIM-100 inactivates Ack1 in both these model systems.
Fig. S1.
Ack1 is expressed in DAergic SK-N-MC cells and mouse striatum and is inactivated by PKC and the Ack1-specific inhibitor AIM-100. pY284-Ack1 quantification. Cells and striatal slices were treated as described, and pY284-Ack1 protein levels were determined by immunoblotting as described in SI Methods. (A and B) DAT SK-N-MC cells (A) and mouse striatal slices (B) were treated ±1 μM PMA for 30 min at 37 °C. (Upper) Representative pY284-Ack1 and total Ack1 blots. (Lower) Average pY284-Ack1 levels expressed as percent vehicle-treated ± SEM. Asterisks indicate a significant difference from vehicle controls, **P < 0.01, *P < 0.02, Student’s t test, n = 7 (A), n = 9 (B). (C) AIM-100 dose–response curves. DAT SK-N-MC cells were treated with the indicated AIM-100 concentrations, 30 min, 37 °C. (Upper) Representative pY284-Ack1 and total Ack1 blots. (Lower) Average pY284-Ack1 levels, normalized to total Ack1, expressed as percent vehicle-treated ± SEM n = 3–4. AIM-100 decreased pY284-Ack1 levels with an IC50 = 220.5 ± 42.5 nM. (D) Mouse striatal slices, prepared as described in SI Methods, were treated ±20 μM AIM-100, 30 min, 37 °C. (Upper) Representative pY284-Ack1 and Ack1 blots. (Lower) Average pYAck1 levels expressed as percent vehicle-treated ± SEM, *P < 0.02, Student’s t test, n = 3.
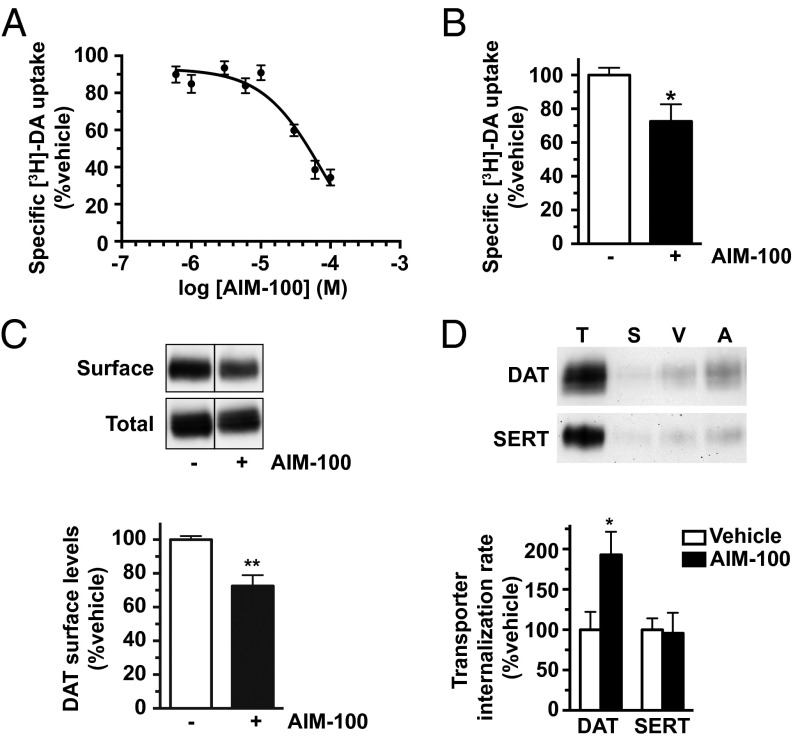
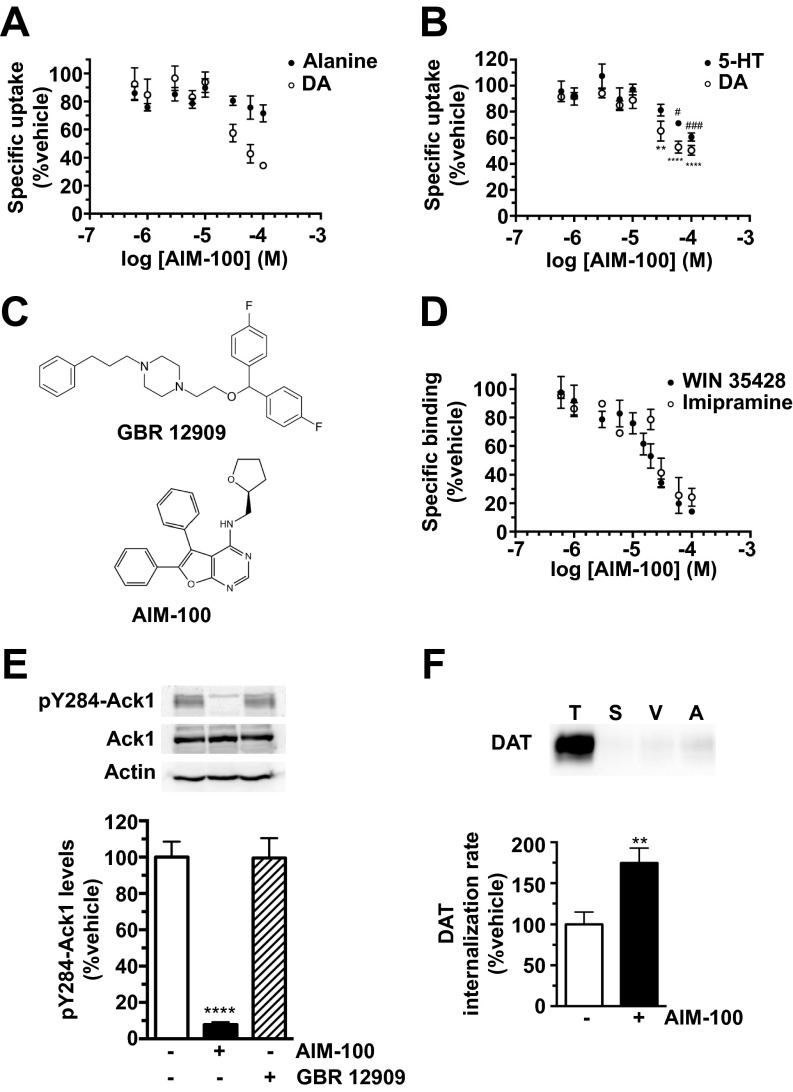
We predicted that if Ack1 imposes the DAT endocytic brake, then Ack1 inactivation would release the brake and decrease both DAT function and surface expression. Indeed, AIM-100 significantly decreased [3H]DA uptake in SK-N-MC cells (IC50 = 50.2 ± 9.9 μM) and striatal slices (Fig. 1 A and B) and significantly reduced DAT surface levels to 72.5 ± 6.4% control levels in mouse striatum (Fig. 1C). DAT surface loss in response to AIM-100 was due to a significant increase in the DAT internalization rate, to 192.9 ± 28.6% control levels (Fig. 1D), demonstrating that Ack1 negatively regulates DAT endocytosis. AIM-100 effects were specific to DAT and had no effect on the SERT endocytic rate measured in SERT-SK-N-MC cells (Fig. 1D; P = 0.89). Interestingly, high AIM-100 concentrations (>20 µM) inhibited DAT function to a much larger degree than what could be attributed to membrane trafficking. DAT loss of function was not due to transmembrane Na+ gradient disruption, as AIM-100 had no effect on Na+-dependent alanine uptake (Fig. S2A). To our surprise, AIM-100 also dose-dependently inhibited SERT function (Fig. S2B), despite exerting no effect on SERT trafficking (Fig. 1D). We noted that AIM-100 bears DAT and SERT pharmacophore properties similar to piperazine derivatives, such as GBR12909 (Fig. S2C). We therefore hypothesized that, in addition to its known function as a high-affinity Ack1 inhibitor, AIM-100 may also be a low-affinity, competitive DAT and SERT inhibitor. Whole cell binding studies revealed that AIM-100 competitively inhibited DAT and SERT binding to [3H]WIN 35428 and [3H]imipramine, respectively (Fig. S2D), supporting the premise that AIM-100 is a DAT and SERT inhibitor. However, GBR12909 had no effect on pAck1 levels (Fig. S2E), indicating that DAT ligand binding does not globally inactivate Ack1. Moreover, a 10-fold lower AIM-100 concentration that efficaciously decreased p284-Ack1 levels (2 µM; Fig. S1C), also significantly increased DAT internalization rates (Fig. S2F). Thus, distinct endocytic mechanisms regulate DAT and SERT, and Ack1 activity is required to impose the DAT endocytic brake. Moreover, AIM-100 is, coincidentally, a low-affinity, competitive DAT and SERT inhibitor.
Fig. 1.
Ack1 activity stabilizes DAT at the plasma membrane. (A) [3H]DA uptake. DAT SK-N-MC cells were treated with the indicated AIM-100 concentrations for 30 min at 37 °C, and [3H]DA uptake was measured as described in SI Methods. Data are expressed as percent specific DA uptake ± SEM (n = 12). (B) Ex vivo slice uptake. Striatal slices were treated ±20 μM AIM-100, 60 min, 37 °C and [3H]DA uptake was assessed as described in SI Methods. *P < 0.05, Student’s t test, n = 6 hemislices obtained from two independent mice. (C) Ex vivo slice biotinylation. Striatal slices were treated ±20 μM AIM-100 for 30 min at 37 °C, and surface proteins were isolated by biotinylation as described in SI Methods. (C, Upper) Representative immunoblots. (C, Lower) Average DAT surface levels expressed as percent vehicle-treated levels ± SEM. **P < 0.01, Student’s t test, n = 3. (D) Internalization assays. DAT and SERT internalization rates were measured in SK-N-MC cells ±20 μM AIM-100 as described in SI Methods. (D, Upper) Representative immunoblots showing the total DAT and SERT surface pools at t = 0 (T), strip control (S), and internalized protein during either vehicle (V) or AIM-100 (A) treatments. (D, Lower) Average internalization rates expressed as percent vehicle-treated ± SEM. *P < 0.02, Student’s t test; n = 5 (DAT); n = 3 (SERT).
Fig. S2.
AIM-100 is a low affinity, competitive monoamine transporter inhibitor. (A) Effect of AIM-100 on Na+-dependent alanine uptake and DA uptake in DAT-SK-N-MC cells. Cells were treated with the indicated concentrations of AIM-100 for 30 min at 37 °C and [3H]alanine or [3H]DA uptake were measured in parallel, as described in SI Methods. Data are expressed as percent nontreated controls ± SEM. Two-way ANOVA revealed a significant interaction of AIM-100 dose, P < 0.0001, and a significant interaction between transporter types, P < 0.04. Bonferroni’s multiple comparison test revealed: *, significant decrease in DA uptake; #, significant differences between DA and alanine uptake, n = 4. (B) Effect of AIM-100 on [3H]DA and [3H]5-HT uptake in DAT-SK-N-MC and SERT-SK-N-MC cells, respectively. Specific uptake is expressed as percent nontreated controls ± SEM. *, Significantly different DA uptake compared with the lowest AIM-100 dose; #, significantly different 5-HT uptake compared with the lowest AIM-100 dose, two-way ANOVA with Dunnett’s multiple comparisons, n = 4. (C) Chemical structures of AIM-100 and GBR12909. (D) Whole cell binding assays. DAT-SK-N-MC and SERT-SK-N-MC cells incubated with 1 nM [3H]WIN 35428 and 1 nM [3H]imipramine, respectively, 2 h, 4 °C, in the presence of the indicated AIM-100 concentrations. Average data shown, expressed as percent bound compared with vehicle controls ± SEM. AIM-100 dose-dependently inhibited DAT and SERT ligand binding with Ki values of 27.3 ± 4.9 µM and 33.1 ± 14.2 µM, respectively, n = 4. (E) pY284-Ack1 levels are insensitive to DAT ligand binding. DAT-SK-N-MC cells were treated either ±20 µM AIM-100 or ±10 µM GBR 12909, 30 min, 37 °C and pY284-Ack1 levels were determined by immunoblotting as described in SI Methods. (Upper) Representative pAck1, total Ack1, and actin immunoblots. (Lower) Average pAck1 levels following the indicated drug treatments, expressed as percent vehicle pAck1 levels ± SEM. ****P < 0.001 compared with vehicle control, one-way ANOVA with Dunnett’s multiple comparison test, n = 4–7. (F) Internalization assay. DAT internalization rates were measured as described in SI Methods, ±2 µM AIM-100. (Upper) Representative DAT immunoblot showing total DAT surface pool at t = 0 (T), strip control (S), and internalized DAT during either vehicle (V) or AIM-100 (A) treatments. (Lower) Average DAT internalization rate expressed as percent vehicle-treated rate ± SEM. **P < 0.01 compared with vehicle control, Student’s t test, , n = 4.
Constitutive and Regulated DAT Endocytosis Are Differentially Dependent on Clathrin.
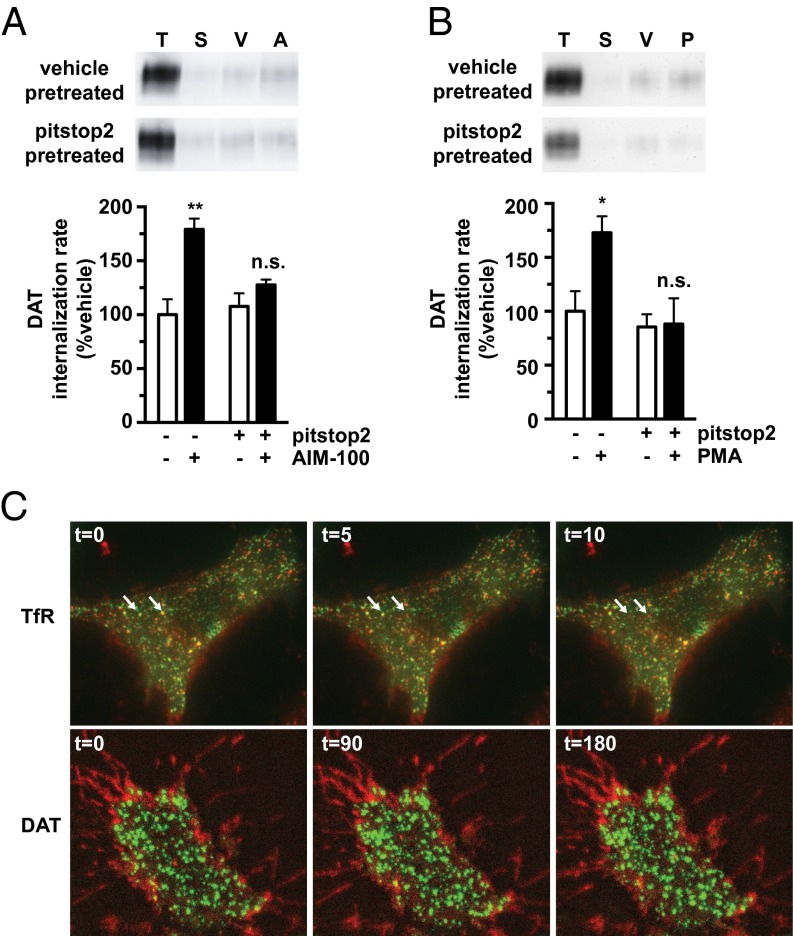
Ack1 is recruited to clathrin-coated pits via clathrin heavy chain interactions (27, 28). Thus, we hypothesized that clathrin is required to release the Ack1-imposed brake. To test clathrin-dependence, we acutely inhibited clathrin with pitstop2 and measured DAT internalization ±AIM-100 and ±PMA. Pitstop2 pretreatment significantly attenuated both AIM-100– and PKC-stimulated DAT internalization, but had no effect on basal DAT endocytosis (Fig. 2 A and B), suggesting that stimulated DAT endocytosis is clathrin-dependent, whereas constitutive DAT endocytosis is clathrin-independent. We further used total internal resonance fluorescence microscopy (TIRFM) to examine clathrin and surface DAT under basal conditions, compared with transferrin receptor (TfR), a protein known to undergo robust clathrin-mediated endocytosis. Alexa 594-Tf colocalized markedly with eGFP-clathrin across the plasma membrane, and distinct Tf/clathrin puncta moved away from the TIRF field during imaging, consistent with clathrin-mediated endocytosis (Fig. 2C). In contrast, TagRFP-T-DAT was diffusely distributed across the plasma membrane and was enriched in cellular microspikes, with little apparent clathrin colocalization (Fig. 2C). Taken together with the pitstop2 data, these data support that constitutive DAT endocytosis is clathrin-independent, whereas stimulated DAT endocytosis requires clathrin.
Fig. 2.
Stimulated DAT endocytosis is clathrin-dependent, whereas constitutive DAT endocytosis is clathrin-independent. (A and B) DAT internalization assay. DAT SK-N-MC cells were pretreated ±25 μM pitstop2 for 10 min at 37 °C and rapidly chilled, and DAT internalization rates were measured as described in SI Methods ±20 μM AIM-100 (A) or ±1 μM PMA (B). (A and B, Upper) Representative immunoblots showing total surface DAT at t = 0 (T), strip control (S), and internalized DAT during vehicle (V), AIM-100 (A), or PMA (P) treatments. (A and B, Lower) Average DAT internalization rates expressed as percent vehicle-treated ± SEM. Asterisks indicate a significant difference from vehicle. *P < 0.03; ***P < 0.005, one-way ANOVA with Bonferroni’s multiple comparison test; n = 7 (A); n = 4–6 (B). (C) TIRF microscopy. Time-lapse TIRF images were captured as described in SI Methods. (C, Upper) SK-N-MC cells stably expressing eGFP-clathrin labeled with Tf-Alexa594. White arrows indicate Tf/clathrin colocalized puncta that move away from the TIRF field during image capture. (C, Lower) SK-N-MC cells stably cotransfected with TagRFP-T-DAT and eGFP-clathrin.
Cdc42 Negatively Regulates DAT, but Not SERT, Endocytosis.
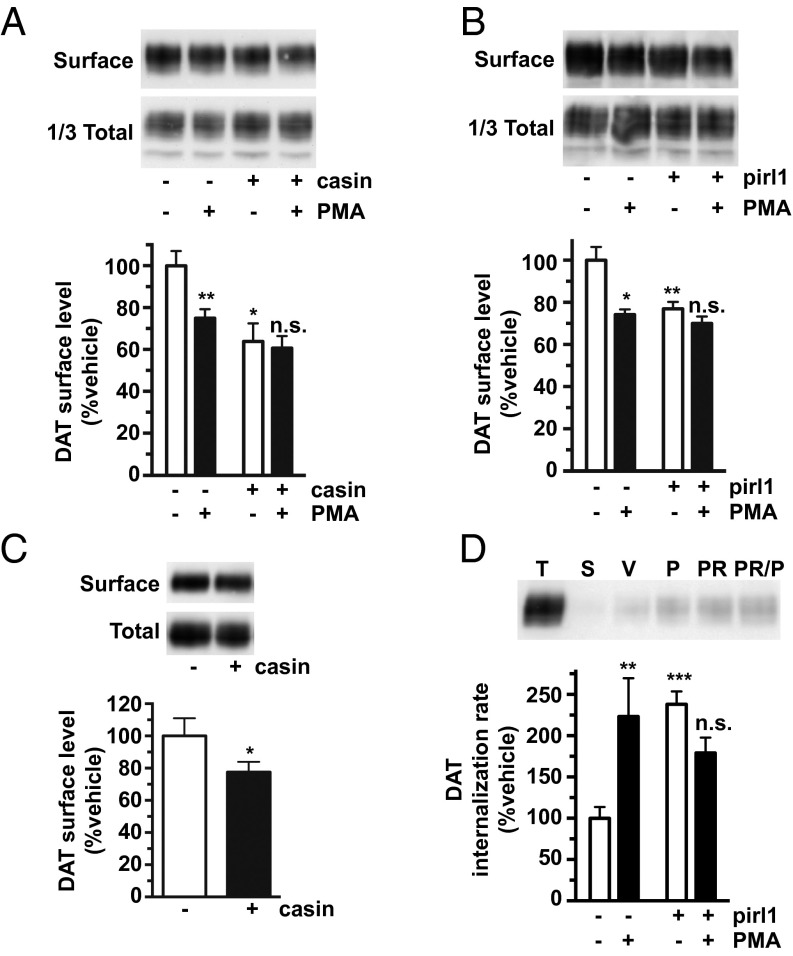
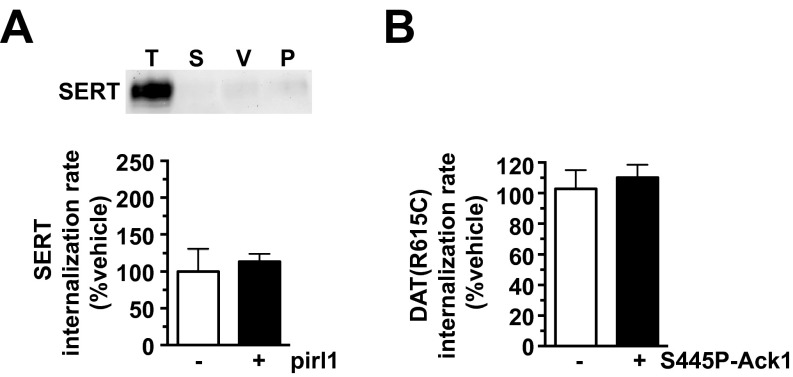
Ack1 is a major cdc42 effector, suggesting that cdc42 may contribute to the DAT endocytic brake, upstream of Ack1. To test this possibility, we measured DAT surface levels in DAT SK-N-MC cells and striatal DAergic terminals following acute treatment with two structurally distinct cdc42 inhibitors, casin and pirl1. Both casin and pirl1 significantly reduced DAT surface levels in SK-N-MC cells (Fig. 3 A and B), and casin significantly decreased surface DAT in mouse striatum (Fig. 3C). DAT surface loss in response to cdc42 inhibition was due to profound DAT endocytic acceleration (238.0 ± 15.5% control levels, Fig. 3D). In contrast, pirl1 did not significantly affect SERT internalization (Fig. S3A). We further tested whether PKC and cdc42 impact DAT surface stability in independent or convergent manners. Pretreatment ±casin (Fig. 3A) or ±pirl1 (Fig. 3B) significantly attenuated PKC-stimulated DAT endocytosis. Moreover, pirl1 and PMA coapplication had no additive effect on DAT internalization (Fig. 3D). Taken together, these results demonstrate that cdc42 activity is required to impose the DAT endocytic brake, likely via the same pathway as PKC and potentially upstream of Ack1. Moreover, these results further support that distinct endocytic mechanisms govern DAT and SERT surface stability.
Fig. 3.
Cdc42 stabilizes DAT surface expression. (A and B) Cell surface biotinylation. DAT SK-N-MC cells were pretreated ±10 μM casin (A) or ±20 μM pirl1 (B) for 30 min at 37 °C, followed by treatment ±1 μM PMA for 30 min at 37 °C. Relative DAT surface levels were measured by biotinylation as described in SI Methods. Representative immunoblots are shown at the top of each panel. (A) Casin treatment. Average DAT surface levels expressed as percent vehicle levels ± SEM. Asterisks indicate a significant difference from vehicle control. *P < 0.05; **P < 0.01, one-way ANOVA with Bonferroni’s multiple comparison test; n = 5–6. (B) Pirl1 treatment. Average DAT surface levels expressed as percent vehicle levels ± SEM. Asterisks indicate a significant difference from vehicle control. *P < 0.02; **P < 0.01, one-way ANOVA with Bonferroni’s multiple comparison test; n = 3. (C) Ex vivo striatal slice biotinylation. Mouse striatal slices were treated ±10 μM casin for 30 min at 37 °C, and relative DAT surface levels were measured by biotinylation as described in SI Methods. (C, Upper) Representative immunoblot. (C, Lower) Average DAT surface levels expressed as percent vehicle-treated ± SEM. *P < 0.05, Student’s t test; n = 10. (D) Internalization assay. DAT internalization rates were measured ±1 μM PMA, ±20 µM pirl1, or with PMA/pirl1 coapplication for 10 min at 37 °C, as described in SI Methods. (D, Upper) Representative immunoblots showing total surface DAT at t = 0 (T), strip control (S), and internalized DAT during vehicle (V), PMA (P), or pirl1 (PR) treatments. (D, Lower) Average DAT internalization rates expressed as percent vehicle rate ± SEM. Asterisks indicate a significant difference from vehicle control. **P < 0.01; ***P < 0.005, one-way ANOVA with Bonferroni’s multiple comparison test; n = 9–13.
Fig. S3.
(A) Cdc42 inhibition does not affect SERT internalization. Internalization assay: SERT internalization rates were measured as described in SI Methods, ±20 µM pirl1. (Upper) Representative SERT immunoblot showing total SERT surface pool at t = 0 (T), strip control (S), and internalized SERT during either vehicle (V) or pirl1 (P) treatment. (Lower) Average SERT internalization rates expressed as percent vehicle-treated rate ± SEM P = 0.68, Student’s t test, n = 5. (B) Constitutively Ack1 activation does not rescue PKC-stimulated DAT(R615C) internalization. Internalization assay. DAT(R615C) was coexpressed in SK-N-MC cells with either vector or S445P-Ack1 and internalization rates were measured ±1 µM PMA, as described in SI Methods (see Fig. 5D for representative immunoblot). Average PMA-stimulated DAT(R615C) internalization rates expressed as percent vehicle-treated ± SEM, P = 0.33, Student’s t test, n = 5–7.
Ack1 Inactivation Is Required to Release the DAT Endocytic Brake, Downstream of PKC or cdc42.
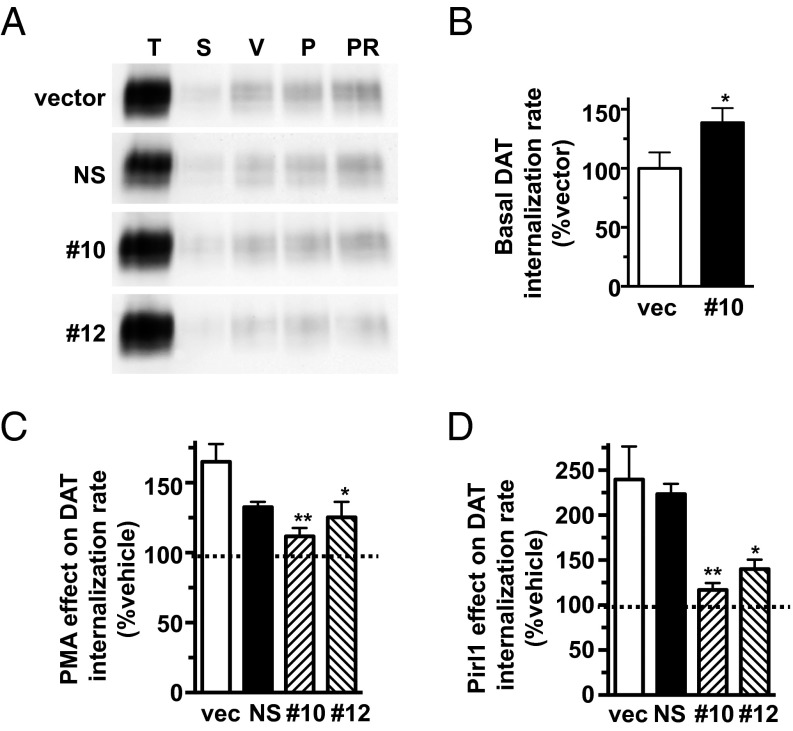
We next used two efficacious hAck1-targeted shRNAs, 10 and 12 (Fig. S4A), to test whether Ack1 is required to (i) engage the DAT endocytic brake and (ii) stimulate DAT endocytosis by PKC activation or cdc42 inhibition. The most efficacious hAck1 shRNA, 10, significantly increased basal DAT endocytosis to 138.7 ± 12.3% control levels (Fig. 4B), consistent with Ack1’s requisite role as the DAT endocytic brake. Moreover, Ack1 depletion with either shRNA 10 or 12 significantly attenuated stimulated DAT endocytosis, either via PKC stimulation (Fig. 4C) or cdc42 inhibition (Fig. 4D). In sum, these results support that Ack1 is required to engage the DAT endocytic brake.
Fig. S4.
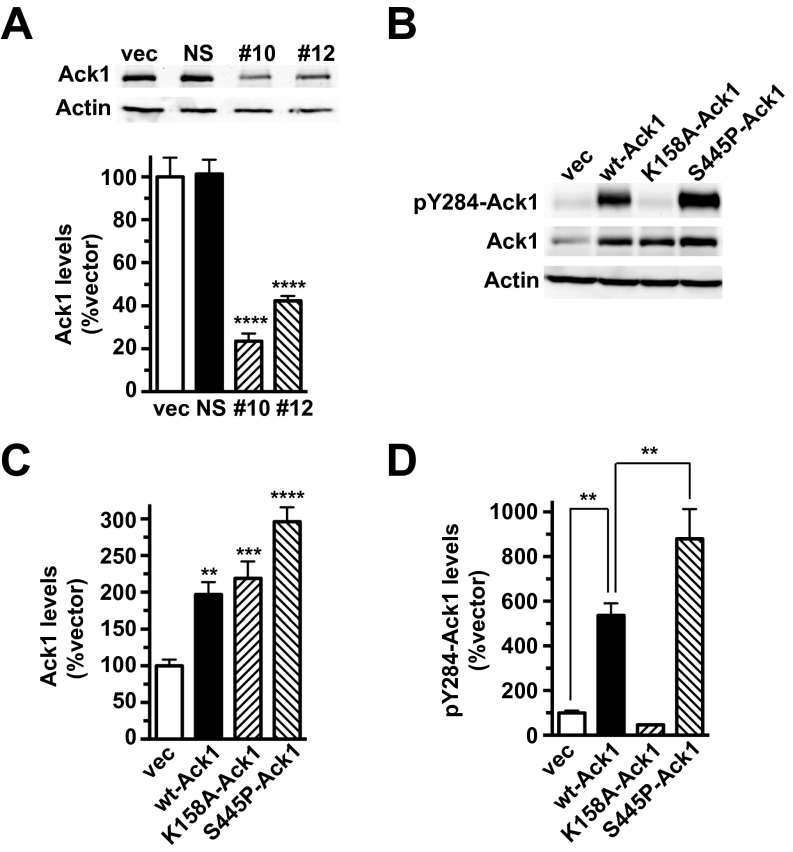
(A) Lentiviral-mediated hAck1 knockdown in SK-N-MC cells. DAT SK-N-MC cells were transduced with the indicated lentiviral particles and hAck1 protein expression was measured 72 h posttransduction. (Upper) Representative immunoblots showing endogenous Ack1 levels in lysates from cells transduced with lentiviral particles expressing either pGIPZ vector (vec), nonsilencing shRNA (NS), hAck1 10 (10), or hAck1 12 (12). (Lower) Average hAck1 protein levels expressed as percent vector-transduced hAck1 levels ± SEM (normalized to actin loading control). ****P < 0.001 compared with vector-transduced cells, one-way ANOVA with Dunnett’s multiple comparison test, n = 4–7. (B–D) Immunoblot assessment Ack1 overexpression: SK-N-MC cells were cotransfected with DAT and either vector or the indicated Ack1 cDNAs and were assayed 48 h posttransfection. (B) Representative immunoblots showing pY284-Ack1, total Ack1, and actin levels in lysates from cells cotransfected with DAT and either vector, wt-Ack1, K158A-Ack1, or S445P-Ack1. (C) Average total Ack1 levels expressed as percent vector-transfected levels ± SEM (normalized to actin loading control). Asterisks indicate a significant difference from vector-transfected control, one-way ANOVA with Dunnett’s multiple comparisons test, **P < 0.01, ***P < 0.005, ****P < 0.0001, n = 6. (D) Average pY284-Ack1 levels expressed as percent vector-transfected levels ± SEM (normalized to total Ack1 levels). **P < 0.01 compared with vector-transfected control, one-way ANOVA with Bonferroni’s multiple comparisons test, n = 6.
Fig. 4.
shRNA-mediated Ack1 depletion increases basal DAT internalization and abolishes stimulated DAT endocytosis in response to PKC activation or cdc42 inhibition. (A–D) DAT internalization assays: DAT SK-N-MC cells were transduced with lentiviral particles expressing either pGIPZ vector (vec), nonsilencing (NS), hAck1 10 (10), or hAck1 12 (12) shRNAs, and DAT internalization rates were measured ±1 μM PMA (C) or ±20 μM pirl1 (D) as described in SI Methods. (A) Representative immunoblots for each transduction condition showing total surface DAT at t = 0 (T), strip control (S), and internalized DAT during vehicle (V), PMA (P) or pirl1 (PR) treatments. (B) Basal DAT internalization rates expressed as percent vector-transduced rates ± SEM. *P < 0.04, Student’s t test; n = 6. (C) PKC-stimulated DAT internalization rates expressed as percent vehicle rate ± SEM for each transduction condition. Asterisks indicate a significant difference from vector-transduced control. *P < 0.03; **P < 0.01, one-way ANOVA with Dunnett’s multiple comparison test; n = 4–7. (D) Pirl1-induced DAT internalization rates expressed as percent vehicle rate ± SEM for each transduction condition. Asterisks indicate a significant difference from vector-transduced control, *P < 0.02; **P < 0.01, one-way ANOVA with Dunnett’s multiple comparison test; n = 4–7.
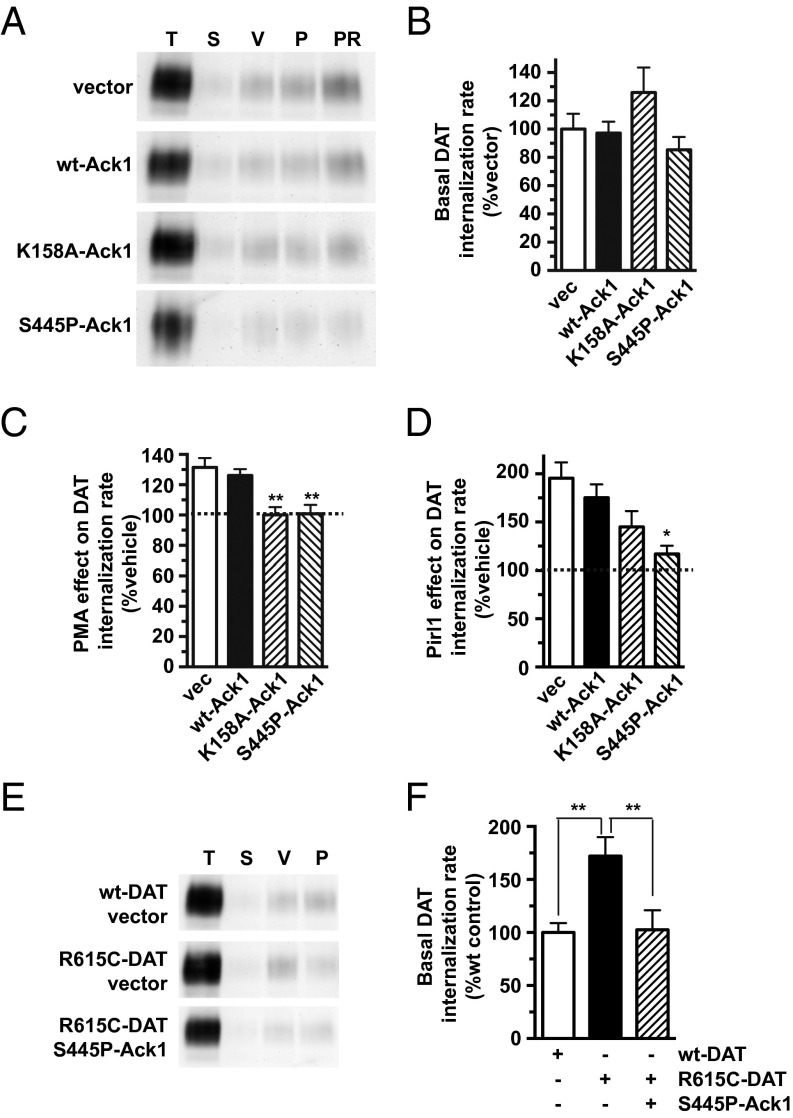
Although perturbing Ack1 enhanced DAT endocytosis, we next asked whether there is a direct causal link between Ack1 inactivation and either cdc42 inhibition or PKC activation to release the DAT endocytic brake. To test this, we coexpressed DAT with either wild-type, constitutively active (S445P), or kinase dead (K158A) Ack1 isoforms (33) (see Fig. S4B for Ack1 mutant overexpression profiles). We predicted that if Ack1 inactivation were required to release the DAT endocytic brake, then S445P-Ack1 would block accelerated DAT internalization in response to either PKC activation or cdc42 inhibition. Wild-type Ack1 overexpression had no effect on basal or accelerated DAT endocytosis in response to PKC activation or cdc42 inhibition (Fig. 5 B–D). In contrast, S445P-Ack1 significantly attenuated both PKC-stimulated (Fig. 5C) and pirl1-stimulated (Fig. 5D) DAT internalization. K158A-Ack1 had no significant effect either basal (P = 0.30) or pirl1-stimulated (P = 0.30) DAT internalization (Fig. 5 B and D), but significantly inhibited PKC-stimulated DAT endocytosis (100.1 ± 5.2% control level, Fig. 5C). Although the K158A mutant lacks kinase activity (34), it was unknown, a priori, whether this mutant would exert a dominant negative effect. Ack1 activation is required for targeting to clathrin-coated pits (30). Thus, it is not surprising the kinase dead mutant failed to exert a dominant effect on DAT internalization. Taken together, these results provide a causal link between upstream PKC or cdc42 stimuli and Ack1 inactivation as requisite steps in releasing the DAT endocytic brake.
Fig. 5.
Ack1 inactivation is required for stimulated DAT endocytosis, and constitutive Ack1 activation rescues ADHD DAT coding variant R615C endocytic dysfunction. Internalization assays: SK-N-MC cells were cotransfected with the indicated DAT and Ack1 isoforms and DAT internalization rates were measured during treatment ±1 µM PMA or 20 µM pirl1 as described in SI Methods. (A–D) Wild-type DAT cotransfected with the indicated Ack1 cDNAs. (A) Representative immunoblots showing total surface DAT at t = 0 (T), strip control (S), and internalized DAT during vehicle (V), 1 µM PMA (P), or 20 µM pirl1 (PR) treatments. (B) Average basal DAT internalization rate expressed as percent vector cotransfected rate ± SEM, one-way ANOVA; P = 0.10; n = 8–9. (C) Average PKC-stimulated DAT internalization rate expressed as percent vector cotransfected rate ± SEM. **P < 0.01 compared with vector control, one-way ANOVA with Dunnett’s multiple comparison test; n = 8–9. (D) Average pirl1-stimulated DAT internalization rates expressed as percent vector cotransfected rate ± SEM. *P < 0.02 compared with vector control, one-way ANOVA with Dunnett’s multiple comparison test; n = 8–9. (E and F) DAT vs. DAT(R615) internalization rates ±S445P-Ack1. (E) Representative immunoblots. (F) Average DAT internalization rates expressed as percent wild-type DAT control rate ± SEM. **P < 0.01 compared with indicated sample, one-way ANOVA with Bonferroni’s multiple comparison test; n = 8–11.
Ack1 Activity Restores Normal Trafficking to a DAT Coding Variant Expressed in an ADHD Proband.
A recent study reported that a DAT coding variant, R615C, identified in an ADHD proband, lacks endocytic braking, resulting in enhanced basal endocytosis and inability to undergo PKC- and AMPH-stimulated endocytosis (16). We asked whether constitutive Ack1 activation could restore the endocytic brake and thereby rescue the DAT(R615C) gain-of-function endocytic phenotype. DAT(R615C) expressed in SK-N-MC cells internalized significantly faster than wild-type DAT (Fig. 5 E and F) and was defective in PKC-stimulated endocytosis (Fig. S3B), consistent with the previous report (16). Remarkably, S445P-Ack1 significantly decreased DAT(R615C) basal endocytosis to wild-type DAT levels (Fig. 5D), but did not restore PKC-stimulated endocytosis (Fig. S3B).
Discussion
Reuptake inhibitors are used to treat a variety of neuropsychiatric disorders, including depression, obsessive-compulsive disorder, and ADHD (10, 35). These agents are differential selective for SERT, NET, and DAT, and their clinical efficacy varies considerably across the population (10, 12). Transporter-specific cellular regulation has the potential to lead to novel and selective therapeutic approaches that manipulate transporters intrinsically, rather than extrinsically. In the current study, we identified an endocytic regulatory mechanism that is selective for DAT, but not SERT. We previously reported that PKC-stimulated DAT internalization is also selectively dependent upon binding to the neuronal GTPase, Rin, whereas neither SERT nor the GABA transporter binds Rin (36). Taken together with our current findings, these data are consistent with a model wherein distinct mechanisms differentially regulate DAT and SERT surface stability.
There are conflicting reports regarding whether constitutive and regulated DAT internalization are clathrin-dependent. Gene silencing studies suggest that both constitutive and PKC-stimulated DAT internalization in nonneuronal cell lines is clathrin-dependent (37); however, whether chronic clathrin depletion artifactually skews these studies is uncertain. A recent study examining DAT trafficking in a knock-in mouse encoding a DAT extracellular epitope tag observed only modest DAT endocytosis and little/no clathrin colocalization under basal conditions (38). However, it is unclear whether antibody-bound DAT traffics similar to native DAT, as we investigate here. Multiple studies also demonstrate that DAT partitions into cholesterol-rich membrane microdomains (36, 39–44) and that the membrane raft protein flotillin-1 is required for PKC- and AMPH-mediated DAT internalization (42), consistent with a clathrin-independent endocytic mechanism. However, a separate study reported that flotillin-1 contributes to DAT membrane mobility rather than PKC-stimulated DAT internalization (45). Our findings suggest that basal DAT internalization is clathrin-independent, whereas stimulated DAT internalization is clathrin-dependent. Consistent with these data, we previously reported that basal and PKC-stimulated DAT internalization are mediated by independent mechanisms (46, 47) and that constitutive and PKC-stimulated DAT internalization are dynamin-independent and -dependent, respectively (40).
Cdc42 directly activates Ack1, and cdc42 inhibition released the DAT endocytic brake in a manner that required Ack1 inactivation (Fig. 5). Several forms of clathrin-independent endocytosis require cdc42 (48–50). In contrast, we found that cdc42 negatively regulates DAT endocytosis via Ack1 activation (Fig. 3), and that stimulated DAT endocytosis in response to Ack1 inactivation is clathrin-dependent (Fig. 2). Thus, it appears that cdc42 impacts DAT internalization in a unique fashion, in contrast to its more commonly known function in promoting endocytosis.
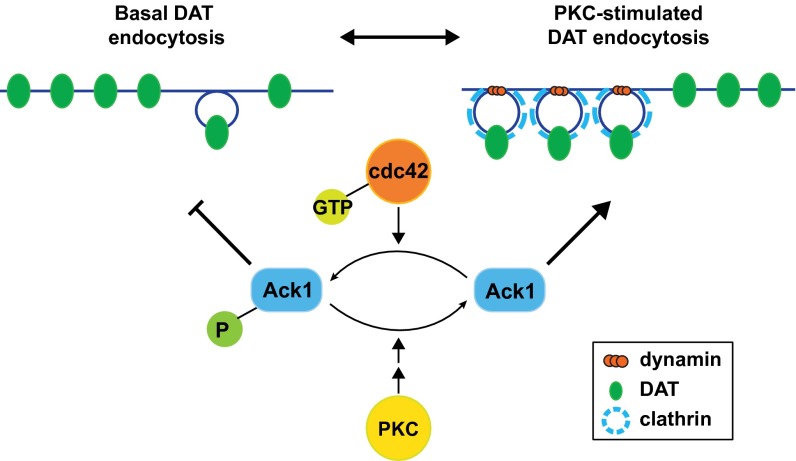
Given our current findings, and in light of previous reports, we propose the following model of basal and PKC-regulated DAT endocytosis (Fig. 6). Under basal conditions, an Ack1-mediated endocytic brake stabilizes DAT at the plasma membrane, and cdc42 promotes the braking mechanism via Ack1 activation. Basal internalization that occurs while the endocytic brake is engaged is clathrin- and dynamin-independent. PKC activation decreases Ack1 activity, which releases the endocytic brake and accelerates DAT internalization via a clathrin- and dynamin-dependent mechanism, resulting in intracellular DAT sequestration.
Fig. 6.
Model for a PKC-sensitive, Ack1-mediated DAT endocytic brake. Under basal conditions, the cdc42-activated Ack1 pool imposes an endocytic brake upon the plasma membrane DAT population, permitting slow, clathrin- and dynamin-independent DAT endocytosis. PKC activation inactivates Ack1 and releases the DAT endocytic brake, facilitating rapid, clathrin- and dynamin-dependent DAT internalization and intracellular sequestration.
What are the molecular players orchestrating the Ack1-imposed DAT endocytic brake and PKC-mediated Ack1 inactivation? PIP2 depletion inactivates Ack1 (30), and both DAT (51) and SERT (52) bind to PIP2. However, DAT mutants lacking PIP2 binding exhibited plasma membrane instability in HEK cells, whereas disrupting SERT/PIP2 interactions did not affect SERT membrane trafficking. These findings raise the possibility that PIP2 effects on Ack1 activity may specifically influence DAT surface stability. PKC activation also increases DAT ubiquitination via a Nedd4-2–mediated mechanism that is required for enhanced DAT endocytosis (53). Nedd4-2 also interacts with Ack1 and is recruited to clathrin-rich vesicles (54), and Nedd4-2/Ack1 interactions drive Ack1 degradation in an Ack1 activity-dependent fashion. Thus, it is possible that Nedd4-2 serves as a dual function player in the DAT endocytic brake by controlling Ack1 protein turnover as well as DAT ubiquitination.
Multiple DAT coding variants and missense mutants have been reported in ADHD, ASD, and infantile Parkinsonism patients, implicating DAT dysfunction as a common risk factor for several DA-related disorders (15–17, 19). Many DAT coding variants exhibit basal anomalous DA efflux and loss of AMPH-induced DA efflux. However, the ADHD-associated DAT(R615C) variant lacks plasma membrane stability due to rapid basal endocytosis and is unable to sequester in response to PKC activation or AMPH exposure. We were able to capitalize on the Ack1-mediated DAT endocytic brake to restore wild-type surface stability to DAT(R615C) (Fig. 5D). Not unexpectedly, S445P-Ack1 also prevented DAT(R615C) from responding to PKC stimulation (Fig. S3B), similar to its effect on wild-type DAT (Fig. 5B). Nevertheless, our ability to rescue DAT(R615C) endocytic dysfunction raises the tantalizing possibility that genetically targeting DAT trafficking may hold promise for DAT coding variants with inherent membrane trafficking dysregulation.
Materials and Methods
All of the methods used in this study have been previously reported by our laboratory. All animal studies were conducted according to University of Massachusetts Medical School Institutional Animal Care and Use Committee-approved protocol A-1506. Transporter function was determined by radiotracer flux assays (23, 46, 55), and relative initial DAT internalization rates were measured by using reversible biotinylation (23, 36, 40, 47, 56). DAT surface expression changes in cell lines (23, 40, 46, 47, 55, 56) and mouse striatal slices (40, 57) were measured by using surface biotinylation. Finally, DAT surface dynamics were assessed by using TIRFM (40). For detailed experimental protocols, refer to SI Methods.
SI Methods
Cell Culture and Transfections.
SK-N-MC cells were from American Type Culture Collection (ATCC) and were maintained in MEM (Sigma-Aldrich M2279) supplemented with 10% (vol/vol) FBS (Invitrogen), 2 mM l-glutamine, and 102 U/mL penicillin/streptomycin, at 37 °C, and 5% CO2. Clonal 12 and pooled stable SK-N-MC cell lines expressing either hDAT or hSERT, respectively, were generated by transfecting 1 × 10⁶ cells per well in six-well culture plate with 3 µg of plasmid DNA using Lipofectamine 2000, at lipid:DNA ratio of 2:1 (wt/wt). Stably transfected cells were selected with 0.5 mg/mL G418 (Invitrogen), and resistant cells were either pooled or selected by single colonies and maintained under selective pressure in 0.2 mg/mL G418. For DAT/Ack1 transient cotransfection studies, 4 × 10⁵ cells were transfected with a total of 1.5 µg of plasmid DNA at a DAT:Ack1 (or vector) ratio of 1:4 and were assayed 48 h posttransfection.
[3H]DA, [3H]alanine, and [3H]5-HT Uptake Assays in Cell Lines.
DAT-SK-N-MC cells or SERT-SK-N-MC cells were seeded in 96-well tissue culture plates at a density of 7.5 × 10⁴ cells per well 1 d before performing assays. Cells were washed twice with Krebs–Ringer–Hepes (KRH) buffer (120 mM NaCl, 4.7 mM KCl, 2.2 mM CaCl2, 1.2 mM MgSO4, 1.2 mM KH2PO4, 10 mM Hepes, pH 7.4) and incubated in KRH supplemented with 0.18% glucose (KRH/g), 37 °C for the indicated times with indicated drugs. Transport was initiated by adding either 1 µM [3H]DA, 1 µM [3H]5-HT, or 0.5 mM [3H]alanine in KRH/g supplemented with 10 µM each pargyline and sodium l-ascorbate and proceeded for 10 min at 37 °C. Transport was terminated by rapidly washing cells with ice-cold KRH buffer, cells were solubilized in scintillation fluid, and accumulated radioactivity was measured by liquid scintillation counting in a Wallac MicroBeta scintillation plate counter (Perkin-Elmer). Desipramine (100 nM) was included in all samples to block uptake contributed by endogenously expressed NET. Nonspecific DA and 5-HT uptake were defined with 10 µM GBR12909 and 1 µM paroxetine, respectively, and Na+-dependent alanine transport was defined by substituting NaCl with 120 mM choline chloride.
Whole Cell Radioligand Binding.
SK-N-MC cells stably expressing DAT or SERT were seeded in 96-well tissue culture plates at a density of 7.5 × 10⁴ cells per well 1 d before performing assays. Cells were washed three times with ice-cold KRH buffer and incubated with either 1.0 nM [3H]WIN 35428 (DAT) or 1.0 nM [3H]imipramine (SERT) and the indicated AIM-100 concentrations for 2 h at 4 °C. Unbound ligand was removed by aspirating, and cells were washed three times with ice-cold KRH buffer and were lysed in scintillation fluid. Bound ligand was measured by liquid scintillation as described above. Nonspecific binding was defined in the presence of either 10 µM GBR12909 (DAT) or 1 µM paroxetine (SERT). AIM-100 Ki values were determined from apparent IC50 values, using the Cheng–Prussoff equation.
Lentiviral Production and Transduction.
Short hairpin RNA (shRNA) targeting hAck1 were sourced from Open Biosystems via the University of Massachusetts Medical School RNAi Core. All shRNAs were provided in the pGIPZ vector which coexpresses turbo GFP (tGFP). shRNA sequences were as follows:
Nonsilencing (Luciferase 693):
TGCTGTTGACAGTGAGCGCTCTAAGAACGTTGTATTTATATAGTGAAGCCACAGATGTATATAAATACAACGTTCTTAGATTGCCTACTGCCTCGGA
Ack sh 10:
TGCTGTTGACAGTGAGCGATACCTGCTTCTTCCAGAGAAATAGTGAAGCCACAGATGTATTTCTCTGGAAGAAGCAGGTACTGCCTACTGCCTCGGA
Ack sh 12:
TGCTGTTGACAGTGAGCGAAAGGTGTTCAGTGGAAAGCGATAGTGAAGCCACAGATGTATCGCTTTCCACTGAACACCTTATGCCTACTGCCTCGGA
For lentivirus production.
Replication incompetent lentiviral particles were produced according to the Addgene second generation pLKO.1 protocol (https://www.addgene.org/tools/protocols/plko/), in accordance with University of Massachusetts Medical School Institutional Biosafety Committee protocol I-347-12 (H.E.M). Briefly, 4.4 × 10⁶ HEK293T cells per dish were seeded in 150-mm dishes 1 d before transfection and were cotransfected with 6.25 µg of shRNA (or control) plasmid, 4.7 µg of psPAX2 packaging plasmid, 1.56 µg of pMD2.G envelope plasmid, combined in Opti-MEM reduced serum media (Invitrogen) with 37.5 µL of Fugene 6 (Promega). Transfection mixtures were added dropwise to cells, incubated at 37 °C at 5% CO2, and were removed and replaced with fresh growth medium 12–16 h posttransfection. Viral supernatants were collected 48 and 72 h posttransfection, aliquoted, and stored at −80 °C. Titers were determined by transduction into HEK293T cells and counting GFP-positive cells 48 h posttransduction. Experiments were performed using a minimum of three independent viral preparations.
For lentiviral transduction.
A total of 5 × 10⁶ DAT-SK-N-MC cells per dish were seeded into 100-mm dishes 1 d before viral transduction and were infected with 50 mL of the indicated crude lentivirus supplemented with 0.8 µg/mL polybrene. Virus was removed 24 h postinfection, and transduced cells were enriched by selecting with 1 µg/mL puromycin for 48 h. Cells were replated into six-well dishes 48 h postinfection and were assayed 72 h postinfection.
Cell Surface Biotinylation.
DAT surface levels in SK-N-MC cells were determined by steady state biotinylation as described (33, 36). Briefly, cells were treated with the indicated drugs for the indicated times in PBS2+/g/BSA (PBS, pH 7.4, supplemented with 1 mM MgCl2 and 0.1 mM CaCl2, 0.18% glucose, 0.1% IgG-/protease-free BSA), and were rapidly cooled by repeated washing in ice-cold PBS2+. Cells were labeled twice for 15 min at 4 °C with 1.0 mg/mL sulfo-NHS-SS-biotin in PBS2+, and excess biotinylation reagent was quenched twice for 15 min at 4 °C with PBS2+/100 mM glycine. Excess glycine was removed by washing three times in ice-cold PBS2+, and cells were lysed in radioimmunoprecipitation assay (RIPA) buffer (10 mM Tris, pH 7.4, 150 mM NaCl, 1 mM EDTA, 0.1% SDS, 1% Triton-X-100, 1% sodium deoxycholate) containing protease inhibitors. Lysates were cleared by centrifugation, and protein concentrations were determined by BCA protein assay kit (Pierce). Lysate aliquots were stored in denaturing SDS/PAGE sample buffer at −20 °C until analysis. Biotinylated proteins from equivalent amount of cellular protein were recovered by batch streptavidin affinity chromatography (overnight, 4 °C), and bound proteins were eluted in denaturing SDS/PAGE sample buffer for 30 min at room temperature with rotation. Samples were analyzed by SDS/PAGE, and indicated proteins were detected by immunoblotting. Immunoreactive bands were detected with SuperSignal West Dura (Pierce) and were captured using the VersaDoc Imaging station (Bio-Rad). Nonsaturating bands were quantified using Quantity One software (Bio-Rad).
Mouse Striatal Slice Assays.
All animals were handled in accordance with University of Massachusetts Medical School IACUC protocol A-1506 (H.E.M.). Postnatal day 21 (P21)–P38 male C57BL/6 mice were killed by cervical dislocation and decapitation, and mouse brains were rapidly removed and immediately chilled in ice-cold sucrose- and kynurenic acid (1 mM)-supplemented artificial CSF (SACSF) (2.5 mM KCl, 1.2 mM NaH2PO4, 1.2 mM MgCl2, 2.4 mM CaCl2, 26 mM NaHCO3, 11 mM glucose, 250 mM sucrose) saturated with 95% O2/5% CO2. Brains were mounted on Leica VT1200S Vibratome, and 300-µm coronal sections were prepared. Striatal sections corresponding to the range between Bregma 1.54–0.34 (using corpus callosum as a landmark) were harvested, hemisected along the midline, and recovered for 40 min at 31 °C in 95%O2/5%CO2-saturated ACSF (125 mM NaCl, 2.5 mM KCl, 1.2 mM NaH2PO4, 1.2 mM MgCl2, 2.4 mM CaCl2, 26 mM NaHCO3, 11 mM glucose) containing 1 mM kynurenic acid. Hemislices were treated with the indicated drugs for the indicated times and temperatures in oxygenated ASCF, using the contralateral hemislice as the control.
For pAck1 and total Ack1 assessment.
Slices were lysed in RIPA buffer containing protease inhibitors and Phosphatase Inhibitor Mixture V (EMD Millipore) by triturating through a 200-µL pipet tip and rotating 30 min at 4 °C. Protein concentrations were determined using the BCA protein assay, and equivalent amounts of lysate were resolved by SDS/PAGE and underwent immunoblot with the indicated antibodies. pAck1 levels were normalized to total Ack1 levels, developed in parallel.
For striatal slice biotinylation.
Surface proteins were covalently labeled with 1.0 mg/mL sulfo-NHS-SS biotin in ice-cold ACSF for 45 min at 4 °C. Residual reactive biotin was quenched by incubating twice with ice-cold ACSF supplemented with glycine for 20 min at 4 °C. Slices were then washed with ice-cold ACSF and lysed in RIPA buffer containing protease inhibitors by triturating through a 200-µL pipet tip and rotating 30 min at 4 °C. Protein concentrations were determined by using the BCA protein assay, and biotinylated proteins were isolated as described for cell lines above by using a striatal lysate:streptavidin agarose bead ratio of 20 µg lysate:30 µL of streptavidin agarose to quantitatively recover all biotinylated DAT in the linear range of recovery.
Striatal Slice [3H]DA Uptake.
DA uptake was determined in 300-µm striatal hemislices from P21-P24 male C57BL/6 mice, prepared as described above. Following recovery, hemislices were pretreated ±20 μM AIM-100 for 1 h at 37 °C in oxygenated ASCF, using the contralateral hemislice as the vehicle control. DA transport was initiated by adding 1 μM [3H]DA in ACSF supplemented with 10 μM each pargyline and sodium l-ascorbate and proceeded for 10 min at 37 °C. Desipramine (100 nM) was included in all pretreatments to block uptake contribution from the norepinephrine transporter. Uptake was terminated by rapidly washing slices with ice-cold ACSF, followed by three 5-min incubations in ice-cold ACSF with gentle shaking. Slices were lysed in RIPA buffer containing protease inhibitors for 30 min at 4 °C, and insoluble material was removed by centrifugation at 18,000 × g for 10 min at 4 °C. Protein concentrations were determined by using the BCA protein assay (Pierce), and accumulated [3H]DA was quantified from each hemislice lysate, in triplicate (150 µg of total tissue lysate per replicate), by liquid scintillation counting. Given that DAT expression is highly variable along the rostral-caudal axis, relative DAT levels for each hemislice were determined in parallel by immunoblotting, using actin as a loading control. Hemislice uptake values were subsequently normalized to their respective relative DAT expression levels so that bona fide differences in uptake across slices could be accurately determined. Nonspecific [3H]DA accumulation was defined in the presence of 10 μM GBR12909, averaged from two independent hemislices per mouse.
Internalization Assays.
Cells were plated onto six-well tissue culture plates at a density of 1 × 10⁶ cells per well 1 d before assays. Cells were biotinylated twice for 15 min at 4 °C with 2.5 mg/mL sulfo-NHS-SS-biotin. After glycine quenching, zero time points and strip controls remained at 4 °C, and internalized samples were warmed to 37 °C by multiple rapid washes in prewarmed PBS2+, 0.18% glucose, and 0.2% IgG/protease-free BSA with the indicated drugs. Internalization proceeded in the same solutions for 10 min at 37 °C, was stopped by washing repeatedly with ice-cold NT buffer (150 mM NaCl, 20 mM Tris, pH 8.6, 1 mM EDTA, 0.2% IgG-/protease-free BSA), and residual surface biotin on experimental and strip control samples was cleaved by reducing twice for 25 min at 4 °C in 100 mM TCEP in NT buffer. Cells were washed thrice in PBS2+ and lysed in RIPA buffer with protease inhibitors, and biotinylated proteins were isolated and analyzed by immunoblot as described for steady state biotinylation, above. Stripping efficiencies were calculated for each sample and were >95% of total surface protein labeled at t = 0. Internalization rates were calculated as the percentage DAT internalized over 10 min compared with total surface DAT labeled at t = 0.
TIRF Microscopy Studies.
SK-N-MC cells stably expressing either TagRFP-T-DAT and eGFP-clathrin, or eGFP-clathrin alone, were plate on glass coverslips 1 d before imaging, and medium was replaced with KRH/0.18% glucose/0.1% BSA, 37 °C for live imaging. To label transferrin receptors in eGFP-clathrin SK-N-MC cells, 1 µg/mL human transferrin-Alexa594 (Life Technologies) was added in the imaging solution. TIRF images in red and green channels were captured by using a TESM microscope (Biomedical Imaging Group, University of Massachusetts Medical School) (54). Briefly, images of through-the-lens TIRF were generated using 491 nm (for eGFP-clathrin) and 561 nm (for TagRFP-T-DAT or transferrin-Alexa 594) laser illumination together with an Olympus TIRF 60 × objective (N.A. = 1.49) at an angel set to visualize around 200 nM from the glass coverslip. Focus stabilization was controlled by pgFocus (Biomedical Imaging Group, big.umassmed.edu/wiki/index.php/PgFocus). PgFocus is an open source and open hardware focus stabilization device that autonomously adjusts a piezo-positioned objective in response to the positional change of a reflected 808-nm laser beam. PgFocus is able to modify and pass on piezo-positon control signals from other devices, which allows pgFocus to identify the expected focus position and adjust accordingly. PgFocus operates at 30 Hz with ±3-nm accuracy and integrates with MicroManager. Time-lapse image data were acquired at 1 Hz using MicroManager open source microscopy software (https://www.micro-manager.org/). Images were then exported as tiff files and analyzed in ImageJ.
Acknowledgments
This work was supported by NIH Grant R01DA035224 (to H.E.M.).
Footnotes
The authors declare no conflict of interest.
This article is a PNAS Direct Submission.
This article contains supporting information online at www.pnas.org/lookup/suppl/doi:10.1073/pnas.1512957112/-/DCSupplemental.
References
- 1.Hyman SE, Malenka RC, Nestler EJ. Neural mechanisms of addiction: The role of reward-related learning and memory. Annu Rev Neurosci. 2006;29:565–598. doi: 10.1146/annurev.neuro.29.051605.113009. [DOI] [PubMed] [Google Scholar]
- 2.Iversen SD, Iversen LL. Dopamine: 50 years in perspective. Trends Neurosci. 2007;30(5):188–193. doi: 10.1016/j.tins.2007.03.002. [DOI] [PubMed] [Google Scholar]
- 3.Snyder SH. Forty years of neurotransmitters: A personal account. Arch Gen Psychiatry. 2002;59(11):983–994. doi: 10.1001/archpsyc.59.11.983. [DOI] [PubMed] [Google Scholar]
- 4.Amara SG, Kuhar MJ. Neurotransmitter transporters: Recent progress. Annu Rev Neurosci. 1993;16:73–93. doi: 10.1146/annurev.ne.16.030193.000445. [DOI] [PubMed] [Google Scholar]
- 5.Kristensen AS, et al. SLC6 neurotransmitter transporters: Structure, function, and regulation. Pharmacol Rev. 2011;63(3):585–640. doi: 10.1124/pr.108.000869. [DOI] [PubMed] [Google Scholar]
- 6.Bröer S, Gether U. The solute carrier 6 family of transporters. Br J Pharmacol. 2012;167(2):256–278. doi: 10.1111/j.1476-5381.2012.01975.x. [DOI] [PMC free article] [PubMed] [Google Scholar]
- 7.Torres GE, Gainetdinov RR, Caron MG. Plasma membrane monoamine transporters: Structure, regulation and function. Nat Rev Neurosci. 2003;4(1):13–25. doi: 10.1038/nrn1008. [DOI] [PubMed] [Google Scholar]
- 8.Thomsen M, Han DD, Gu HH, Caine SB. Lack of cocaine self-administration in mice expressing a cocaine-insensitive dopamine transporter. J Pharmacol Exp Ther. 2009;331(1):204–211. doi: 10.1124/jpet.109.156265. [DOI] [PMC free article] [PubMed] [Google Scholar]
- 9.Chen R, et al. Abolished cocaine reward in mice with a cocaine-insensitive dopamine transporter. Proc Natl Acad Sci USA. 2006;103(24):9333–9338. doi: 10.1073/pnas.0600905103. [DOI] [PMC free article] [PubMed] [Google Scholar]
- 10.Iversen L. Neurotransmitter transporters and their impact on the development of psychopharmacology. Br J Pharmacol. 2006;147(Suppl 1):S82–S88. doi: 10.1038/sj.bjp.0706428. [DOI] [PMC free article] [PubMed] [Google Scholar]
- 11.Gether U, Andersen PH, Larsson OM, Schousboe A. Neurotransmitter transporters: Molecular function of important drug targets. Trends Pharmacol Sci. 2006;27(7):375–383. doi: 10.1016/j.tips.2006.05.003. [DOI] [PubMed] [Google Scholar]
- 12.Tamminga CA, et al. Developing novel treatments for mood disorders: Accelerating discovery. Biol Psychiatry. 2002;52(6):589–609. doi: 10.1016/s0006-3223(02)01470-1. [DOI] [PubMed] [Google Scholar]
- 13.Jones SR, et al. Profound neuronal plasticity in response to inactivation of the dopamine transporter. Proc Natl Acad Sci USA. 1998;95(7):4029–4034. doi: 10.1073/pnas.95.7.4029. [DOI] [PMC free article] [PubMed] [Google Scholar]
- 14.Pinsonneault JK, et al. Dopamine transporter gene variant affecting expression in human brain is associated with bipolar disorder. Neuropsychopharmacology. 2011;36(8):1644–1655. doi: 10.1038/npp.2011.45. [DOI] [PMC free article] [PubMed] [Google Scholar]
- 15.Mazei-Robison MS, et al. Anomalous dopamine release associated with a human dopamine transporter coding variant. J Neurosci. 2008;28(28):7040–7046. doi: 10.1523/JNEUROSCI.0473-08.2008. [DOI] [PMC free article] [PubMed] [Google Scholar]
- 16.Sakrikar D, et al. Attention deficit/hyperactivity disorder-derived coding variation in the dopamine transporter disrupts microdomain targeting and trafficking regulation. J Neurosci. 2012;32(16):5385–5397. doi: 10.1523/JNEUROSCI.6033-11.2012. [DOI] [PMC free article] [PubMed] [Google Scholar]
- 17.Hamilton PJ, et al. NIH ARRA Autism Sequencing Consortium De novo mutation in the dopamine transporter gene associates dopamine dysfunction with autism spectrum disorder. Mol Psychiatry. 2013;18(12):1315–1323. doi: 10.1038/mp.2013.102. [DOI] [PMC free article] [PubMed] [Google Scholar]
- 18.Bowton E, et al. SLC6A3 coding variant Ala559Val found in two autism probands alters dopamine transporter function and trafficking. Transl Psychiatry. 2014;4:e464. doi: 10.1038/tp.2014.90. [DOI] [PMC free article] [PubMed] [Google Scholar]
- 19.Hansen FH, et al. Missense dopamine transporter mutations associate with adult parkinsonism and ADHD. J Clin Invest. 2014;124(7):3107–3120. doi: 10.1172/JCI73778. [DOI] [PMC free article] [PubMed] [Google Scholar]
- 20.Mergy MA, et al. The rare DAT coding variant Val559 perturbs DA neuron function, changes behavior, and alters in vivo responses to psychostimulants. Proc Natl Acad Sci USA. 2014;111(44):E4779–E4788. doi: 10.1073/pnas.1417294111. [DOI] [PMC free article] [PubMed] [Google Scholar]
- 21.Melikian HE. Neurotransmitter transporter trafficking: Endocytosis, recycling, and regulation. Pharmacol Ther. 2004;104(1):17–27. doi: 10.1016/j.pharmthera.2004.07.006. [DOI] [PubMed] [Google Scholar]
- 22.Rudnick G, Krämer R, Blakely RD, Murphy DL, Verrey F. The SLC6 transporters: Perspectives on structure, functions, regulation, and models for transporter dysfunction. Pflugers Arch. 2014;466(1):25–42. doi: 10.1007/s00424-013-1410-1. [DOI] [PMC free article] [PubMed] [Google Scholar]
- 23.Boudanova E, Navaroli DM, Stevens Z, Melikian HE. Dopamine transporter endocytic determinants: Carboxy terminal residues critical for basal and PKC-stimulated internalization. Mol Cell Neurosci. 2008;39(2):211–217. doi: 10.1016/j.mcn.2008.06.011. [DOI] [PMC free article] [PubMed] [Google Scholar]
- 24.Sorkina T, Richards TL, Rao A, Zahniser NR, Sorkin A. Negative regulation of dopamine transporter endocytosis by membrane-proximal N-terminal residues. J Neurosci. 2009;29(5):1361–1374. doi: 10.1523/JNEUROSCI.3250-08.2009. [DOI] [PMC free article] [PubMed] [Google Scholar]
- 25.Galisteo ML, Yang Y, Ureña J, Schlessinger J. Activation of the nonreceptor protein tyrosine kinase Ack by multiple extracellular stimuli. Proc Natl Acad Sci USA. 2006;103(26):9796–9801. doi: 10.1073/pnas.0603714103. [DOI] [PMC free article] [PubMed] [Google Scholar]
- 26.Linseman DA, Heidenreich KA, Fisher SK. Stimulation of M3 muscarinic receptors induces phosphorylation of the Cdc42 effector activated Cdc42Hs-associated kinase-1 via a Fyn tyrosine kinase signaling pathway. J Biol Chem. 2001;276(8):5622–5628. doi: 10.1074/jbc.M006812200. [DOI] [PubMed] [Google Scholar]
- 27.Teo M, Tan L, Lim L, Manser E. The tyrosine kinase ACK1 associates with clathrin-coated vesicles through a binding motif shared by arrestin and other adaptors. J Biol Chem. 2001;276(21):18392–18398. doi: 10.1074/jbc.M008795200. [DOI] [PubMed] [Google Scholar]
- 28.Yang W, Lo CG, Dispenza T, Cerione RA. The Cdc42 target ACK2 directly interacts with clathrin and influences clathrin assembly. J Biol Chem. 2001;276(20):17468–17473. doi: 10.1074/jbc.M010893200. [DOI] [PubMed] [Google Scholar]
- 29.Ureña JM, et al. Expression, synaptic localization, and developmental regulation of Ack1/Pyk1, a cytoplasmic tyrosine kinase highly expressed in the developing and adult brain. J Comp Neurol. 2005;490(2):119–132. doi: 10.1002/cne.20656. [DOI] [PubMed] [Google Scholar]
- 30.Shen H, et al. Constitutive activated Cdc42-associated kinase (Ack) phosphorylation at arrested endocytic clathrin-coated pits of cells that lack dynamin. Mol Biol Cell. 2011;22(4):493–502. doi: 10.1091/mbc.E10-07-0637. [DOI] [PMC free article] [PubMed] [Google Scholar]
- 31.Yokoyama N, Miller WT. Biochemical properties of the Cdc42-associated tyrosine kinase ACK1. Substrate specificity, authphosphorylation, and interaction with Hck. J Biol Chem. 2003;278(48):47713–47723. doi: 10.1074/jbc.M306716200. [DOI] [PubMed] [Google Scholar]
- 32.Mahajan K, et al. Effect of Ack1 tyrosine kinase inhibitor on ligand-independent androgen receptor activity. Prostate. 2010;70(12):1274–1285. doi: 10.1002/pros.21163. [DOI] [PMC free article] [PubMed] [Google Scholar]
- 33.Lin Q, Wang J, Childress C, Yang W. The activation mechanism of ACK1 (activated Cdc42-associated tyrosine kinase 1) Biochem J. 2012;445(2):255–264. doi: 10.1042/BJ20111575. [DOI] [PubMed] [Google Scholar]
- 34.Mahajan NP, Whang YE, Mohler JL, Earp HS. Activated tyrosine kinase Ack1 promotes prostate tumorigenesis: Role of Ack1 in polyubiquitination of tumor suppressor Wwox. Cancer Res. 2005;65(22):10514–10523. doi: 10.1158/0008-5472.CAN-05-1127. [DOI] [PubMed] [Google Scholar]
- 35.Iversen L. Neurotransmitter transporters: Fruitful targets for CNS drug discovery. Mol Psychiatry. 2000;5(4):357–362. doi: 10.1038/sj.mp.4000728. [DOI] [PubMed] [Google Scholar]
- 36.Navaroli DM, et al. The plasma membrane-associated GTPase Rin interacts with the dopamine transporter and is required for protein kinase C-regulated dopamine transporter trafficking. J Neurosci. 2011;31(39):13758–13770. doi: 10.1523/JNEUROSCI.2649-11.2011. [DOI] [PMC free article] [PubMed] [Google Scholar]
- 37.Sorkina T, Hoover BR, Zahniser NR, Sorkin A. Constitutive and protein kinase C-induced internalization of the dopamine transporter is mediated by a clathrin-dependent mechanism. Traffic. 2005;6(2):157–170. doi: 10.1111/j.1600-0854.2005.00259.x. [DOI] [PubMed] [Google Scholar]
- 38.Block ER, et al. Brain region-specific trafficking of the dopamine transporter. J Neurosci. 2015;35(37):12845–12858. doi: 10.1523/JNEUROSCI.1391-15.2015. [DOI] [PMC free article] [PubMed] [Google Scholar]
- 39.Kovtun O, et al. Single-quantum-dot tracking reveals altered membrane dynamics of an attention-deficit/hyperactivity-disorder-derived dopamine transporter coding variant. ACS Chem Neurosci. 2015;6(4):526–534. doi: 10.1021/cn500202c. [DOI] [PMC free article] [PubMed] [Google Scholar]
- 40.Gabriel LR, et al. Dopamine transporter endocytic trafficking in striatal dopaminergic neurons: Differential dependence on dynamin and the actin cytoskeleton. J Neurosci. 2013;33(45):17836–17846. doi: 10.1523/JNEUROSCI.3284-13.2013. [DOI] [PMC free article] [PubMed] [Google Scholar]
- 41.Jones KT, Zhen J, Reith ME. Importance of cholesterol in dopamine transporter function. J Neurochem. 2012;123(5):700–715. doi: 10.1111/jnc.12007. [DOI] [PMC free article] [PubMed] [Google Scholar]
- 42.Cremona ML, et al. Flotillin-1 is essential for PKC-triggered endocytosis and membrane microdomain localization of DAT. Nat Neurosci. 2011;14(4):469–477. doi: 10.1038/nn.2781. [DOI] [PMC free article] [PubMed] [Google Scholar]
- 43.Foster JD, Adkins SD, Lever JR, Vaughan RA. Phorbol ester induced trafficking-independent regulation and enhanced phosphorylation of the dopamine transporter associated with membrane rafts and cholesterol. J Neurochem. 2008;105(5):1683–1699. doi: 10.1111/j.1471-4159.2008.05262.x. [DOI] [PMC free article] [PubMed] [Google Scholar]
- 44.Adkins EM, et al. Membrane mobility and microdomain association of the dopamine transporter studied with fluorescence correlation spectroscopy and fluorescence recovery after photobleaching. Biochemistry. 2007;46(37):10484–10497. doi: 10.1021/bi700429z. [DOI] [PubMed] [Google Scholar]
- 45.Sorkina T, Caltagarone J, Sorkin A. Flotillins regulate membrane mobility of the dopamine transporter but are not required for its protein kinase C dependent endocytosis. Traffic. 2013;14(6):709–724. doi: 10.1111/tra.12059. [DOI] [PMC free article] [PubMed] [Google Scholar]
- 46.Holton KL, Loder MK, Melikian HE. Nonclassical, distinct endocytic signals dictate constitutive and PKC-regulated neurotransmitter transporter internalization. Nat Neurosci. 2005;8(7):881–888. doi: 10.1038/nn1478. [DOI] [PMC free article] [PubMed] [Google Scholar]
- 47.Loder MK, Melikian HE. The dopamine transporter constitutively internalizes and recycles in a protein kinase C-regulated manner in stably transfected PC12 cell lines. J Biol Chem. 2003;278(24):22168–22174. doi: 10.1074/jbc.M301845200. [DOI] [PMC free article] [PubMed] [Google Scholar]
- 48.Sabharanjak S, Sharma P, Parton RG, Mayor S. GPI-anchored proteins are delivered to recycling endosomes via a distinct cdc42-regulated, clathrin-independent pinocytic pathway. Dev Cell. 2002;2(4):411–423. doi: 10.1016/s1534-5807(02)00145-4. [DOI] [PubMed] [Google Scholar]
- 49.Massol P, Montcourrier P, Guillemot JC, Chavrier P. Fc receptor-mediated phagocytosis requires CDC42 and Rac1. EMBO J. 1998;17(21):6219–6229. doi: 10.1093/emboj/17.21.6219. [DOI] [PMC free article] [PubMed] [Google Scholar]
- 50.Gauthier NC, et al. Helicobacter pylori VacA cytotoxin: A probe for a clathrin-independent and Cdc42-dependent pinocytic pathway routed to late endosomes. Mol Biol Cell. 2005;16(10):4852–4866. doi: 10.1091/mbc.E05-05-0398. [DOI] [PMC free article] [PubMed] [Google Scholar]
- 51.Hamilton PJ, et al. PIP2 regulates psychostimulant behaviors through its interaction with a membrane protein. Nat Chem Biol. 2014;10(7):582–589. doi: 10.1038/nchembio.1545. [DOI] [PMC free article] [PubMed] [Google Scholar]
- 52.Buchmayer F, et al. Amphetamine actions at the serotonin transporter rely on the availability of phosphatidylinositol-4,5-bisphosphate. Proc Natl Acad Sci USA. 2013;110(28):11642–11647. doi: 10.1073/pnas.1220552110. [DOI] [PMC free article] [PubMed] [Google Scholar]
- 53.Vina-Vilaseca A, Sorkin A. Lysine 63-linked polyubiquitination of the dopamine transporter requires WW3 and WW4 domains of Nedd4-2 and UBE2D ubiquitin-conjugating enzymes. J Biol Chem. 2010;285(10):7645–7656. doi: 10.1074/jbc.M109.058990. [DOI] [PMC free article] [PubMed] [Google Scholar]
- 54.Chan W, et al. Down-regulation of active ACK1 is mediated by association with the E3 ubiquitin ligase Nedd4-2. J Biol Chem. 2009;284(12):8185–8194. doi: 10.1074/jbc.M806877200. [DOI] [PMC free article] [PubMed] [Google Scholar]
- 55.Melikian HE, Buckley KM. Membrane trafficking regulates the activity of the human dopamine transporter. J Neurosci. 1999;19(18):7699–7710. doi: 10.1523/JNEUROSCI.19-18-07699.1999. [DOI] [PMC free article] [PubMed] [Google Scholar]
- 56.Boudanova E, Navaroli DM, Melikian HE. Amphetamine-induced decreases in dopamine transporter surface expression are protein kinase C-independent. Neuropharmacology. 2008;54(3):605–612. doi: 10.1016/j.neuropharm.2007.11.007. [DOI] [PMC free article] [PubMed] [Google Scholar]
- 57.Gabriel LR, Wu S, Melikian HE. Brain slice biotinylation: An ex vivo approach to measure region-specific plasma membrane protein trafficking in adult neurons. J Vis Exp. 2014;86(86):51240. doi: 10.3791/51240. [DOI] [PMC free article] [PubMed] [Google Scholar]


