Significance
Hyperactivity of the hormone glucagon plays an important role in the pathophysiology of type 2 diabetes, but the factors that affect glucagon levels and α-cell proliferation are not entirely understood. This is particularly important for the development diabetes drugs based on glucagon receptor inhibition, which increase glucagon levels in plasma and α-cell mass. Here we show that increased levels of Angiopoietin-like 4 (Angptl4) in adipose tissue and plasma are sufficient to induce α-cell proliferation. Angptl4 is a conserved, secreted lipoprotein lipase inhibitor expressed by many tissues that is regulated by exercise and feeding. Moreover, Angptl4 is required for the compensatory hyperglucagonemia and α-cell proliferation following treatment with glucagon receptor antagonists.
Keywords: diabetes, metabolism, angiopoietin, glucagon, LPL
Abstract
Type 2 diabetes is characterized by a reduction in insulin function and an increase in glucagon activity that together result in hyperglycemia. Glucagon receptor antagonists have been developed as drugs for diabetes; however, they often increase glucagon plasma levels and induce the proliferation of glucagon-secreting α-cells. We find that the secreted protein Angiopoietin-like 4 (Angptl4) is up-regulated via Pparγ activation in white adipose tissue and plasma following an acute treatment with a glucagon receptor antagonist. Induction of adipose angptl4 and Angptl4 supplementation promote α-cell proliferation specifically. Finally, glucagon receptor antagonist improves glycemia in diet-induced obese angptl4 knockout mice without increasing glucagon levels or α-cell proliferation, underscoring the importance of this protein. Overall, we demonstrate that triglyceride metabolism in adipose tissue regulates α-cells in the endocrine pancreas.
Type 2 diabetes is a metabolic disease characterized by high levels of fasting and postprandial glucose levels. Diabetic patients display elevated levels of glucagon and a relatively low activity of insulin, leading to increased hepatic gluconeogenesis, reduced glucose uptake, and altered lipid profile (1–4). At the histological level, islets of diabetic patients display an increase in the numbers of glucagon-secreting α-cells and a decrease in the number of insulin-secreting β-cells (5–7). Glucagon has received increasing attention after glucagon receptor knockout mice (gcgr−/−) were shown to be protected from development of diabetes in type 1 and type 2 diabetes models (8, 9). These and other studies highlight diabetes as a joint glucagon and insulin disorder (10–12).
Glucagon receptor antagonists (GRAs) have been developed as antidiabetic drugs. GRAs improve glycemic control in humans, but may induce compensatory hyperglucagonemia and proliferation of α-cells (13–15). These results concur with the dramatic hyperglucagonemia and increase in α-cell proliferation in gcgr−/− mice (16) and humans with a nonfunctional glucagon receptor (17). The adverse side effects of GRAs present a practical need to understand the compensatory response of α-cells and raise basic questions regarding the control over α-cell proliferation. Surprisingly, nearly full ablation of α-cells does not increase α-cell proliferation or alter circulating glucagon levels (18), raising the hypothesis that, unlike β-cells, hormonal hypersecretion alone does not promote proliferation (19, 20). Rather, a reduction of glucagon signaling, either by GRA treatment or receptor knockout, feeds back to induce α-cell proliferation (21).
In this study, we treated mice with a GRA to identify secreted factors leading to α-cell proliferation and hyperglucagonemia. We find that Angptl4 is up-regulated in white adipose tissue (WAT) and in plasma following GRA treatment. Angptl4 is a multifunctional secreted protein that is cleaved into an N-terminal part containing a coil-coil domain that inhibits lipoprotein lipase (LPL) and a C-terminal part with a fibrinogen-like domain that affects vasculature (22). The LPL inhibitory N-terminal fragment constitutes most of the blood-borne fraction of Angptl4 and can act in a paracrine and endocrine manner (23, 24). Angptl4 is a glucocorticoid and Ppar target gene, up-regulated during fasting and exercise and expressed in many tissues, but primarily in WAT in mice. Local up-regulation of Angptl4 expression diverts triglyceride utilization for fatty acid oxidation to other tissues (25–30). Knockout and overexpression of angptl4 lead to decreased or increased triglyceride levels, respectively, in mice (31), and mutations in the human angptl4 gene are associated with lower triglyceride levels in the blood (32).
We show that treatment with recombinant Angptl4 protein specifically increases α-cell proliferation rates of young and old mice without increasing glucagon levels. Activation of Pparγ up-regulates angptl4 expression in WAT but not in the liver and results in increased α-cell proliferation. Pparα activation increased hepatic angptl4 but did not raise α-cell proliferation rates. Notably, GRA treatment led to Pparγ activation in WAT but did not activate Pparα in liver. Caloric restriction, which increases plasma Angptl4 levels (29), led to up-regulation of WAT but not liver angptl4 expression and increased α-cell proliferation. Angptl4−/− mice have a normal islet morphology and α-cell proliferation rate. GRA treatment improves glycemia of diet-induced obese (DIO) angptl4−/− mice without increasing glucagon levels or α-cell proliferation. In all, the data show that Angplt4 is sufficient to induce α-cell proliferation and is required for the adverse response of α-cells to GRA treatment.
Results
Glucagon Receptor Antagonism Leads to Hyperglucagonemia and an Increase in α-Cell Proliferation.
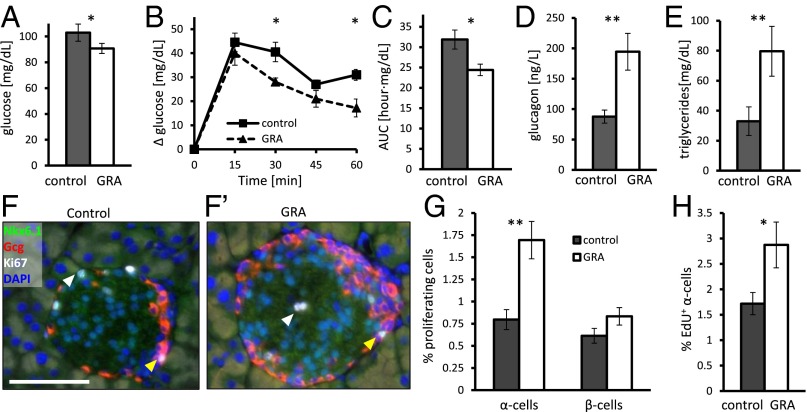
We generated a model of an acute treatment with a GRA to identify secreted factors leading to α-cell replication and hyperglucagonemia. Osmotic pumps were used to administer either PBS (control) or the GRA des-His1-[Glu9)-glucagon(1–29) amide for 6 d in 8-wk-old male mice (33, 34). As expected, administration of this GRA led to a lower fasting glycemia, a reduction in glucose production following i.p. injection of glucagon, and an increase in plasma glucagon and triglyceride levels (Fig. 1 A–E).
Fig. 1.
A 7-d administration of GRA increases α-cell proliferation and plasma glucagon concentration. (A) Overnight fasting glucose levels following 7 d of GRA administration. n = 7–8 per group; P = 0.03. (B and C) Increase in glucose levels relative to basal glucose level following glucagon injection over time (B) and area under the curve (AUC) (C). n = 4–5 per group; P = 0.02 in all three cases. (D) Glucagon levels after a 6-h fast following 7 d of PBS or GRA administration. n = 5 and 7; P = 0.003. (E) Triglyceride levels after overnight fast following 7 d of PBS or GRA administration. n = 5; P = 0.008. (F) Immunofluorescence image of proliferating α-cells in control (F) and GRA-treated mice (F′). Yellow and white arrowheads point to proliferating α- and β-cells, respectively. (Scale bar, 50 μm.) (G) Percentage of proliferating α- and β-cells following 7 d of PBS (control) or GRA administration. n = 10. P = 0.003 for α-cells; P = 0.17 for β-cells. (H) Percentage of EdU-positive α-cells following 7 d of PBS (control) or GRA administration. P = 0.02; *P < 0.05; **P < 0.01.
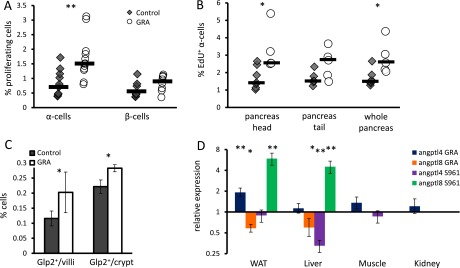
GRA administration caused a twofold increase in the fraction of proliferating α-cells, rising from 0.75 to 1.5% without changing β-cell proliferation (Fig. 1 F–G and Fig. S1). EdU staining shows an increase in the fraction of new α-cells following GRA treatment in both the head and the tail of the pancreas (Fig. 1H and Fig. S1), confirming the previously reported increase in α-cell proliferation in GRA-treated mice (13–15). There was also a small increase in the fraction of L-cells in the ileum of GRA-treated mice (Fig. S1) (35). IL6R signaling was shown to be required for α-cell proliferation in a high-fat-diet model and after duct ligation (36, 37); however, we did not detect nuclear pStat3 in α-cells following GRA treatment.
Fig. S1.
Supporting figure for Figs. 1 and 2. (A) Percentage of Ki67-positive cells in control and GRA-treated mice. Each point represents a single mouse; black horizontal line is the median. n = 10. P = 0.003 for α-cells; P = 0.17 for β-cells. (B) Percentage of EdU-positive α-cells in control and GRA-treated mice. Each point represents a single mouse; black horizontal line is the median. n = 5. P = 0.02 (head), 0.07 (tail), and 0.02 (whole pancreas). (C) Glp2-positive cells per crypt or villus in ileum of 8-wk-old mice treated for 7 d with GRA or PBS. P = 0.03; n = 5–7. (D) Fold change in gene expression following a 7-d treatment with GRA or insulin receptor inhibition by S961 (41). In GRA-treated animals, tissues were collected following overnight fast, and qPCR was used to generate the data as in Fig. 2C. In S961, tissues were collected from nonfasted animals, and we present published data from microarrays (41).
Angptl4 Is Up-Regulated in White Adipose Tissue Following Glucagon Receptor Antagonism.
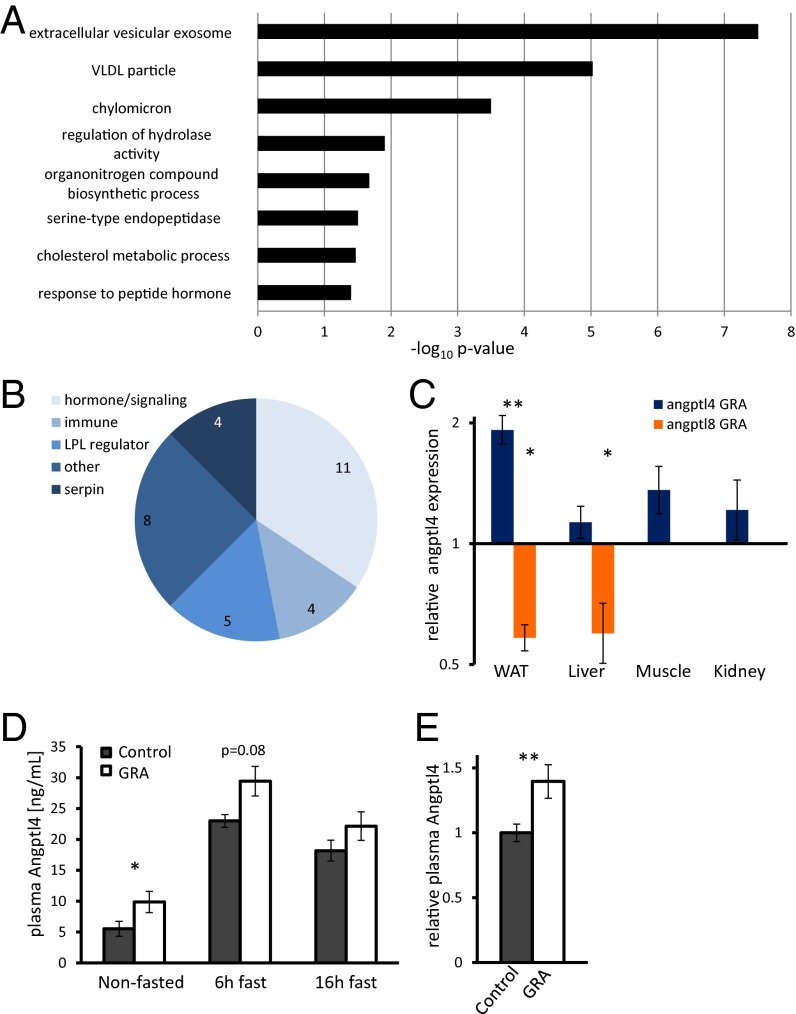
We measured gene expression in liver and WAT of fasted mice treated with GRA for 7 d to identify factors affecting α-cell proliferation. There was a widespread change in gene expression in the liver; notably, gcgr was down-regulated and amino acid metabolism altered (Dataset S1). Analysis of overrepresented gene ontology terms in WAT pointed to changes in lipoprotein handling in the extracellular space (Fig. 2A), which may relate to the reported altered lipid profile of gcgr−/− mice (38, 39). We focused our analysis on extracellular blood-borne proteins in WAT and identified several differentially expressed hormones, serpin family members, cytokines, and LPL regulators (Fig. 2B and Dataset S2) (40).
Fig. 2.
Gene expression analysis in white adipose tissue following GRA identifies up-regulation of Angptl4. (A) Overrepresented gene ontology terms in WAT following GRA administration. Genes with a fold change >1.5 and differential expression P value < 0.05 were chosen for this analysis. (B) Classification of extracellular proteins significantly differentially expressed (P < 0.005). See Dataset S1. (C) qPCR analysis showing fold change in gene expression in angptl4 (blue) and angptl8 (orange) across tissues following 7 d of GRA treatment relative to nontreated controls. P = 0.009; P = 0.03 (WAT); P = 0.05 (liver); n = 3. (D) Plasma levels of Angptl4 in GRA and control mice. n = 5. P = 0.04 (nonfasted). (E) Relative plasma levels of Angptl4 in GRA and control mice during the day. Angptl4 levels were normalized to control level at the same feeding/fasting state to demonstrate overall increase in Angptl4 levels. P = 0.006; *P < 0.05; **P < 0.01.
Angptl4/fiaf was one of the most highly expressed, up-regulated genes in WAT (Dataset S3) and a prominent LPL inhibitor. Quantitative PCR (qPCR) showed that angptl4 is up-regulated twofold in WAT of GRA-treated mice, where it is most highly expressed, but not in the liver, kidney, or muscle (Fig. 2C). Interestingly, angptl4 was down-regulated in the liver of mice treated with the insulin receptor antagonist s961 (Fig. S1) (41). Angptl8, an angptl4 homologous gene, was down-regulated by GRA in liver and WAT and up-regulated by S961 in those organs (Fig. 2C and Fig. S1). At the protein level, the concentration of Angptl4 in the plasma increased in the fed and fasted states of GRA-treated mice (Fig. 2 D and E).
3D Treatment with Angptl4 Leads to an Increase in α-Cell Proliferation.
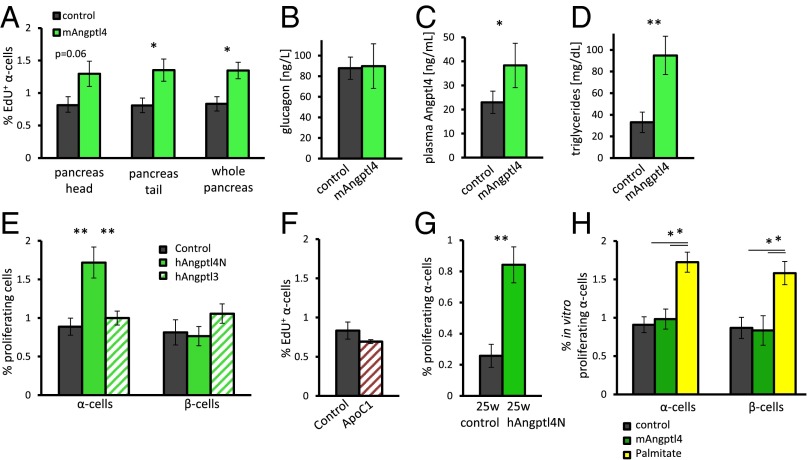
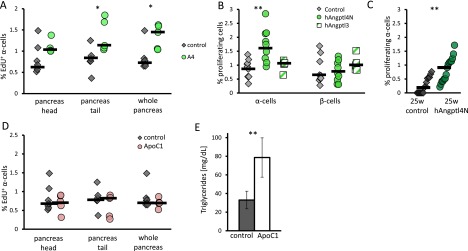
We administered 10 μg of recombinant mouse Angptl4 to 8-wk-old male mice for 3 d to determine whether Angptl4 is sufficient to induce α-cell proliferation. We detected an increase of 50% in EdU-positive cells following treatment whereas glucagon levels did not change between the two groups (Fig. 3 A and B; Fig. S2). mAngptl4-treated mice displayed an increased level of plasma Angptl4 and, correspondingly, increased triglyceride levels (Fig. 3 C and D).
Fig. 3.
A 3-d treatment with Angptl4 leads to an increase in the percentage of proliferating α-cells. (A) Percentage of EdU-positive cells following mouse Angptl4 treatment in head, tail, or whole pancreas. n = 7 and 5. P = 0.06, 0.02, and 0.02 for head, tail, or whole pancreas, respectively. (B–D) Plasma glucagon (B), Angptl4 (C), and triglyceride (D) level following a 6-h fast in control and Angpt4-treated mice. n = 5. P = 0.02 (C) and 0.004 (D). (E) Percentage of Ki67-positive α- and β-cells in 8-wk-old mice following a 3-d treatment with BSA (control), human Angptl4N (hAngptl4N), or human Angptl3 (hAngptl3). n = 9, 10, 5. P = 0.004 and 0.008. (F) Percentage of EdU-positive α-cells following a 3-d treatment with BSA or ApoC1. n = 7, 5. (G) Percentage of Ki67-positive α-cells in 5- to 6-mo-old SCID beige mice following a 3-d treatment with hAngptl4N or BSA. n = 16, 17. P = 0.002. (H) Percentage of Ki67-positive α-cells in freshly isolated mouse islets treated with 0.5 mM of palmitic acid or mAngptl4 for 36 h or nontreated islets as controls. n = 3; P = 0.04. *P < 0.05; **P < 0.01.
Fig. S2.
Supporting figure for Fig. 3. (A) Percentage of EdU-positive α-cells in control and mAngptl4-treated mice. Each point represents a single mouse, black horizontal line is the median. n = 5–7. P = 0.1 (head), 0.003 (tail), 0.01 (whole pancreas). (B) Percentage of Ki67-positive α- and β-cells in young mice following a 3-d treatment with hAngptl4N or BSA. n = 9, 10. P = 0.004. (C) Percentage of Ki67-positive α-cells in 5- to 6-mo-old SCID beige mice following a 3-d treatment with hAngptl4N or BSA. n = 16, 17. P = 0.002. (D and E) Percentage of Ki67-positive α-cells (D) and triglyceride levels (E) in overnight-fasted mice treated with ApoC1 for 3 d or BSA (control). Each point represents a single mouse; black horizontal line is the median.
We similarly treated mice with the N-terminal, LPL-inhibiting fraction of human Angptl4 (hAngptl4N). In this case, there was a nearly twofold increase in the fraction of proliferating α-cells compared with BSA-treated controls, with no change in β-cell proliferation (Fig. 3E and Fig. S2) The Angptl4 homolog and LPL inhibitor Angptl3 did not elicit this effect after 3 d of treatment (Fig. 3E). Treatment with the LPL inhibitor ApoC1 did not affect α-cell proliferation as well, whereas it did increase triglyceride levels in plasma (Fig. 3F and Fig. S3). These results point toward a more specific role of Angptl4 in terms of localization or timing than merely global LPL inhibition (29).
Fig. S3.
Supporting figure for Fig. 4. (A) Percentage of Ki67-positive α- and β-cells in Rosiglitiazone- or DMSO-treated mice (control). P = 0.01. (B) Percentage of Ki67-positive α- and β-cells in fenofibrate or corn oil gavaged mice (control). (C) Percentage of Ki67-positive α- and β-cells in calorically restricted or overnight-fasted mice (control). P = 0.02. Each point represents a single mouse; black horizontal line is the median.
hAngptl4N increased the α-cell proliferation rate of 6-mo-old male SCID beige mice, which are of a BALB/c genetic background. The proliferation rate of α-cells in the control group was only 0.2%, possibly because of their older age (42, 43) (Fig. 3G and Fig. S2). In vitro, recombinant mAngptl4 was unable to increase β- or α-cell proliferation in isolated mouse islets. Supplementing 0.5 mM of palmitic acid to the media increased both β- and α-cell proliferation by twofold (44) (Fig. 3H).
Activation of the angptl4 Regulator Pparγ Induces α-Cell Proliferation.
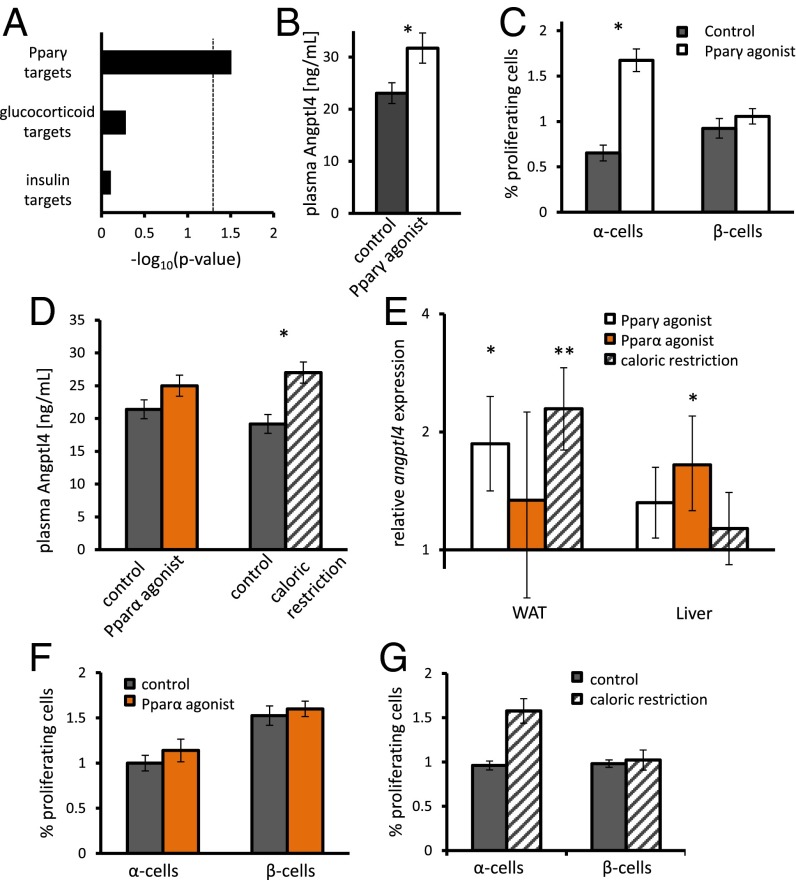
Angptl4 is induced by Ppar and glucocorticoid activity (25, 26). Analysis of our transcriptomic data shows that many Pparγ targets are regulated in WAT (P = 0.03) and that expression of glucocorticoid or insulin target genes is not changed (Fig. 4A). We therefore treated 8-wk-old male mice with the Pparγ agonist Rosiglitiazone by daily injections for 7 d. Both levels of Angptl4 in plasma and the fraction of proliferating α-cells increased following treatment (Fig. 4 B and C; Fig. S3).
Fig. 4.
Pparγ agonist and caloric restriction lead to increase in adipose and plasma Angpt4 and α-cell proliferation. (A) Enrichment for Pparγ, glucocorticoid, and insulin target genes differentially expressed in WAT following GRA administration. (B) Fasting levels of plasma Angptl4 following a 7-d treatment with the Pparγ agonist Rosiglitiazone or DMSO. P = 0.03; n = 4–5. (C) Percentage of Ki67-positive β- and α-cells following a 7-d treatment with the Pparγ agonist Rosiglitiazone or DMSO as control. n = 5. P = 0.01. (D) Plasma Angptl4 levels of mice treated with the Pparα agonist fenofibrate vs. control or caloric restriction vs. its control. P = 0.02; n = 5 in all cases. (E) Relative expression of angpl4 in WAT and liver as assayed by qPCR. P = 0.005 and 0.03. n = 5 in all cases. (F and G) Percentage of Ki67-positive α- and β-cells in mice treated with fenofibrate (F) or calorically restricted mice (G). P = 0.02; n = 5 in all cases. *P < 0.05 and **P < 0.01.
We treated mice for 7 d with the Pparα agonist fibronate to study whether the organ where angptl4 was activated was of importance for α-cell proliferation. The increase in plasma Angptl4 levels in plasma did not reach significance (Fig. 4D). qPCR analysis has shown that angptl4 was induced in liver and WAT of Pparα- and γ-treated mice, respectively (Fig. 4E). However, Pparα agonist administration did not increase α-cell proliferation (Fig. 4F). Notably, Pparα signaling was not active in livers of GRA-treated animals, and hepatic angptl4 was not up-regulated. Interestingly, Pparα signaling was down-regulated in livers of gcgr−/− mice (42).
Caloric restriction was shown to elevate plasma Angptl4 levels (29). We verified this result and found that angptl4 was up-regulated in WAT of calorically restricted animals (Fig. 4 D and E). α-Cell proliferation was increased in calorically restricted animals compared with overnight fasted animals (Fig. 4G).
Angptl4−/− Mice Do Not Increase Their α-Cell Proliferation and Glucagon Levels Following Glucagon Receptor Antagonism.
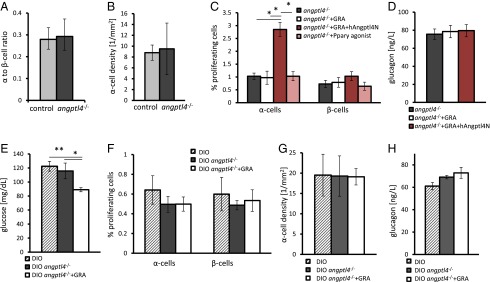
We have shown so far that an increase in Angptl4 is sufficient to increase α-cell proliferation in vivo and wanted to test if Angptl4 was necessary to induce α-cell proliferation in a GRA model. Angptl4−/− mice (45) and age- and weight-matched mice had a comparable α- to β-cell ratio, α-cell density, α-cell proliferation rate, and plasma glucagon levels (Fig. 5 A and B; Fig. S4). Hence, Angptl4 does not affect α-cell proliferation under normal conditions or have an effect on the structure of the endocrine pancreas.
Fig. 5.
Angptl4 is required for hyperglucagonemia and compensatory α-cell proliferation following GRA treatment. (A and B) C57BL/6J (control) and angptl4−/− mice display a similar α- to β-cell ratio (A) and α-cell density (B). (C) Percentage of Ki67-positive α- and β-cells in young angptl4−/− mice treated for 7 d with PBS (control), GRA, GRA+hAngptl4, or the Pparγ agonist Rosiglitiazone. P = 0.01 (Kruskal–Wallis); adjusted Mann–Whitney P values are 0.02, 0.01, and 0.02 between GRA-, control, and Rosiglitazone-treated vs. GRA+hAngptl4, respectively. (D) Plasma glucagon levels following a 6-h fast in angptl4−/− mice following treatment with PBS, GRA, or GRA+hAngptl4. (E) Fasting glucose levels in 14-wk-old DIO C57BL/6J mice, DIO angptl4−/− mice treated with PBS, or DIO angptl4−/− mice treated with GRA for 7 d. P = 0.03 and P = 0.005 (ANOVA, n = 4–5 per group). (F–H) Percentage of Ki67-positive α- and β-cells (F), α-cell density (G), and 6-h fasting plasma glucagon levels (H) in mice treated as in E. *P < 0.05; **P < 0.01.
Fig. S4.
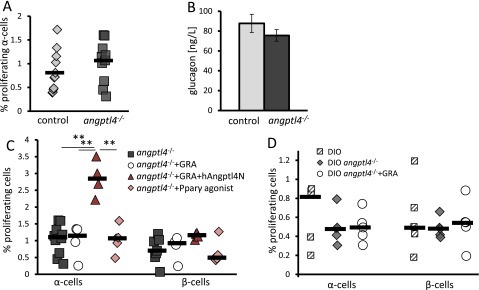
Supporting figure for Fig. 5. (A) Percentage of Ki67-positive α-cells in C57BL/6J (control) and angptl4−/− that are of the same genetic background. (B) Plasma glucagon level following a 6-h fast in control and angptl4−/− mice. (C) Percentage of Ki67-positive α- and β-cells in young angptl4−/− mice treated for 7 d with PBS (control), GRA, GRA+hAngptl4, and the Pparγ agonist Rosiglitiazone. For α-cells, P = 0.01 (Kruska–Wallis); adjusted Mann–Whitney P values are 0.02, 0.01, and 0.02 between GRA, control, and Rosiglitazone-treated vs. GRA+hAngptl4, respectively. (D) Percentage of Ki67-positive α- and β-cells in 14-wk-old DIO control mice, angptl4−/− DIO treated with PBS, or angptl4−/− DIO treated with GRA. Each point represents a single mouse; black horizontal line is the median.
A 7-d treatment with GRA did not affect β- or α-cell proliferation rates of 8-wk-old angptl4−/− mice, nor did it elevate glucagon levels following a 6-h fast (Fig. 5 C and D). Rosiglitazone treatment did not increase α-cell proliferation, stressing the role of Angptl4 in this process (Fig. 5C). A 3-d cotreatment of GRA and hAngptl4N to angptl4−/− mice restored the increase in the fraction of proliferating α-cells to 2.5% (Fig. 5C and Fig. S4) without affecting glucagon levels (Fig. 5D).
Finally, we tested whether GRA treatment was effective in improving glycemia of DIO angptl4−/− mice. DIO angptl4−/− mice had the same glucose levels, α-cell proliferation rates, α-cell density, and glucagon levels as control DIO mice, indicating that Angptl4 is not required to increase endocrine pancreas mass in response to metabolic demand (Fig. 5 E–H). The mice did not display peritonitis or other symptoms associated with angptl4−/− DIO mice at this age (46). A 7-d treatment with GRA reduced fasting blood glucose levels of DIO angptl4−/− mice (Fig. 5E). As before, neither glucagon levels nor the fraction of proliferating α-cells or α-cell density of DIO angptl4−/− mice increased following GRA treatment (Fig. 5 F–H).
Discussion
Our data demonstrate that Angptl4 is sufficient to induce an increase in the rate of α-cell replication. The magnitude of this increase is similar to that reported for β-cells in response to various compounds (47–49). Angptl4−/− mice do not increase α-cell proliferation or glucagon levels in response to GRA administration, underscoring the role of Angptl4 in the compensatory proliferation of α-cells following GRA treatment. Our results using DIO angptl4−/− mice suggest that control of Angptl4 levels or Angptl4’s downstream targets might be important for the development of diabetes drugs that are based on glucagon receptor antagonism. However, it is important to note that expression patterns of mice and human angptl4 vary and that, unlike humans, mice express low levels of the glucagon receptor in WAT.
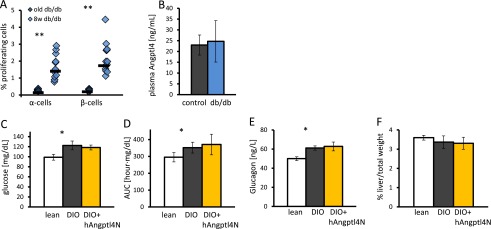
Angptl4 is not required for α-cell proliferation per se. DIO angptl4−/− mice display higher α-cell density than lean angptl4−/− mice, similar to normal DIO mice (compare Fig. 5 B and G), and α-cell proliferation was high in young db/db mice without an increase in plasma Angptl4 levels (Fig. S5). There are numerous factors affecting α-cell proliferation in development and various physiological conditions (21, 36, 50, 51).
Fig. S5.
Supporting figure for Discussion. (A) Percentage of Ki67-positive α-cells in 1-y-old and 8-wk-old db/db mice. Each point represents a single mouse. P < 0.001. (B) Six-hour fasting plasma Angptl4 levels in 8-wk-old control and db/db mice. (C–E) Fasting glucose (C), area under the curve following i.p. glucose tolerance test (D), and glucagon (E) levels increase from lean to DIO mice (P = 0.03 in all cases). A 7-d treatment with Angptl4 in DIO mice does not change these parameters. (F) Percentage of liver weight out of total weight is unchanged for lean, DIO, and Angptl4-treated DIO mice. *P < 0.05; **P < 0.01.
Treatment with Angptl4 increased α-cell proliferation without increasing glucagon levels, implying that α-cell proliferation can be decoupled from glucagon secretion. This result corroborates with a recent finding that ablation of 98% of α-cells does not lead to α-cell regeneration, even though the remaining α-cells secrete as much glucagon as a normal pancreas does (18). Increase in α-cell mass by itself in 1 wk is too small to have a measureable effect on glucagon levels.
GRA treatment did not lead to hyperglucagonemia in angptl4−/− mice. This is a surprising finding, which can be explained by Angptl4 suppression of hepatic gluconeogenesis (52) through the altered inflammatory response in mesenteric lymph nodes of angptl4−/− fed with saturated fats (46) or by the overall altered lipid composition of angptl4−/− plasma that affects insulin and glucagon secretion (31).
Acute overexpression of angptl4 in the liver of db/db mice was shown to improve glycemia while increasing liver weight lipid content and causing liver steatosis (52). We treated DIO mice with hAngptl4N for 7 d by an osmotic pump but did not detect a difference in glucose and glucagon levels or liver weight between treated and control groups (Fig. S5). Different diabetes mouse models and particularly systemic administration vs. liver-specific overexpression of angptl4 may account for the different phenotypes.
Our results indicate that WAT angptl4 induction starts the chain of events leading to augmented α-cell proliferation. This is supported by the fact that Pparγ but not Pparα induced α-cell proliferation and that GRA and caloric restriction increased mostly adipose and not hepatic angptl4 expression. angptl4 is most highly expressed in WAT (26, 53), and therefore it is not surprising that adipose up-regulation has also led to an increase in plasma levels of Angptl4.
Angptl4 most likely acts indirectly on α-cells by inhibiting LPL and inducing lipolysis in a paracrine fashion in WAT (26, 30). As a result, changes in plasma composition may affect α-cell physiology and proliferation. This is supported by our in vitro findings showing that palmitic acid but not Angptl4 was able to induce α-cell proliferation in isolated mouse islets.
Increasing LPL activity through Angptl3 or ApoC1 administration or decreasing it in angptl4−/− mice (31) is not sufficient to affect α-cell replication, hinting at an Angptl4-specific effect, which may be exerted through its unique inhibition mechanism, its organ expression pattern, and its diurnal metabolic regulation. Overall, we find a positive correlation between the increase of plasma and adipose angptl4 and α-cell proliferation, but not with triglyceride levels.
A liver-specific glucagon receptor knockout mouse displays an increased α-cell proliferation rate (54). The liver is the prime target of glucagon signaling, but WAT is a sensitive and active metabolic endocrine organ that can affect insulin sensitivity and systemic metabolism (55). GRA treatment may cause a change in the liver and other organs that leads to secondary changes in WAT (56), in particular the up-regulation of angptl4 expression, or it can act directly on WAT because gcgr is lowly expressed in WAT. The putative liver-secreted α-cell proliferative factor may induce angptl4 in WAT and/or affect α-cells by separate mechanisms (21, 36, 50).
There is an ongoing debate regarding the role of Angptl8 in β-cell replication (49, 57–60), but the balance of evidence shows that our laboratory’s claim (41) that injecting angpt8 DNA increases β-cell replication by 17-fold is not reproducible. Numerous additional experiments have since been performed, and they show that the results reported in Yi et al. (41) were anomalous and that there is, at most, a modest (less than twofold) effect of Angptl8 on β-cell replication. The homologous angptl4 and angptl8 genes are oppositely regulated under physiological conditions: Angptl4 is up-regulated in fasting and cold exposure, whereas angptl8 is up-regulated in refeeding (26, 59, 61–63). Both Angptl4 and angptl8 knockout mice display decreased triglyceride levels, linking the function of both proteins to lipid metabolism. Indeed, the two proteins have a homologous domain that was shown to inhibit LPL (58, 59, 64, 65); Pparα can bind the angptl4 promoter (24) and a putative Ppar response element exists in the angptl8 promoter. In this study, angptl4 was up-regulated and angptl8 down-regulated in WAT in response to GRA treatment. Angptl8 was up-regulated and angptl4 was down-regulated in the liver in response to insulin receptor inhibition (41). We hypothesize that an acute change in the balance of the contrasting hormones insulin and glucagon is reflected in the oppositely regulated levels of Angptl8 and Angptl4 in the periphery. This may affect the fasted and fed levels of plasma lipids and amino acids, which were shown to affect endocrine cell proliferation (21, 66, 67).
Glucagon plays an important role in the pathophysiology of type 2 diabetes. We describe a circuit connecting α-cells with Angptl4, a secreted LPL inhibitor expressed in the periphery that is regulated by exercise, the gut microbiota, feeding, and during diabetes (27, 45, 52). Our study highlights the role of Angptl4 in inducing α-cell proliferation and its importance in the compensatory hyperglucagonemia following treatment with GRA.
Methods
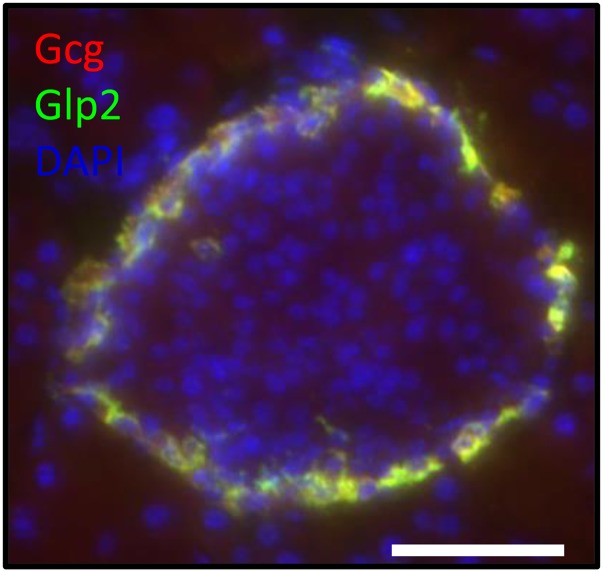
Animal experiments were performed in compliance with the Harvard University Animal Care and Use Committee guidelines. C57BL/6 served as control mice. Angptl4−/− mice (45) were generously provided by Prof. A. Nagi (Mount Sinai Hospital, Toronto). For GRA experiments, PBS or 1 mg of the glucagon receptor antagonist des-His1-Glu9-glucagon(1–29) (Tocris Bioscience) was applied for 7 d using Alzet osmotic pumps. Ten micrograms of recombinant human coiled-coil domain of Angptl4 (Adipogen), mouse Angptl4 (R&D systems), or human Angptl3 (PromoKine) together with 5 μg of BSA were applied for 3 d by osmotic pumps. Fifty micrograms of ApoC1 (Novus Biologicals) was used per mouse. BSA (15 or 50 μg) was used as control accordingly. Quantification of α- and β-cell proliferation was performed blindly. Mice were euthanized after a 6-h fast. α- and β-cell proliferation were determined by counting at least 400 α-cells or 1,500 β-cells per mouse in at least five nonconsecutive sections of the pancreas. Glp2 or Glucagon and Nkx6.1 immunostaining were used to mark mouse α- and β-cells in mice, respectively (Fig. S6). Regarding statistics, error bars denote standard errors. Student’s t test was used for qPCR, glucose, and protein levels in plasma; Mann–Whitney test was used for proliferation quantification in mice, except in vitro, where a t test was used. Gene enrichment analysis was done using the hypergeometric distribution with a Benjamini–Hochberg correction.
Fig. S6.
Supporting figure for Methods. Colocalization of Glucagon and Glp2 staining in the mouse pancreas. (Scale bar, 50 μm.)
SI Methods
Mice.
Animal experiments were performed in compliance with the Harvard University Animal Care and Use Committee guidelines. C57BL/6 served as control mice. C57BL/6 and db/db (68) were purchased from Jackson Laboratories. SCID beige mice were purchased from Taconic and Jackson Laboratories. Angptl4−/− mice (45) were generously provided by Nagi (Mount Sinai Hospital, Toronto). Diet-induced obesity was induced by an 11-wk diet with 60% calories from fat (D12492, Research Diets, Inc.).
Caloric Restriction.
Mice were single-caged and were given unlimited access to normal chow 1 wk before the experiment. During 9 d of caloric restriction, mice were fed 50–60% of the weight of the food. In all studies, control mice were overnight-fasted.
Glucose and Glucagon Tolerance Test.
Glucose tolerance tests were done using 1 mg/g i.p. glucose injection following an overnight fast. Glucagon sensitivity tests were done following a 6-h fast by an i.p. injection of 1 mg/kg glucagon (Phoenix) (18). Glucose was measured by OneTouch Ultra2 glucometer (LifeScan).
Osmotic Pumps.
Alzet mini osmotic pumps were implanted s.c. for 7 d (pump model 2001) or 3 d (pump model 1003). For GRA experiments, PBS or 1 mg of the glucagon receptor antagonist des-His1-Glu9-glucagon (1–29) (Tocris Bioscience) was applied for 7 d. Ten micrograms of recombinant human coiled-coil domain of Angptl4 (Adipogen), mouse Angptl4 (R&D Systems), or human Angptl3 (PromoKine) together with 5 μg of BSA were applied to pumps. Fifty micrograms were used for ApoC1 (Novus Biologicals); 15 or 50 μg of BSA were used as control accordingly.
Pparα and Pparγ Agonist Delivery.
Fenofibrate (Sigma) (150mg/kg) was dissolved in corn oil and was administered to mice by gavage with 50 μL of corn oil. Controls were gavaged with 50 μL for the same period. Rosiglitiazone (Cayman Chemicals) was dissolved in DMSO and diluted in saline to reach 50% DMSO. Mice received 10 mg/kg Rosiglitiazone or 50% DMSO as controls for 7 d by daily i.p. injections.
Protein and Triglyceride Quantification in Plasma.
Aprotinin (1 mg/10 mL) (Santa Cruz Biotechnologies) was added to blood immediately after collection. Insulin (Alpco), Glucagon (Alpco), and Angptl4 ELISAs (MyBioSource) or were performed according to manufacturers’ instructions. A triglyceride quantification kit (Abcam) was used to measure triglyceride levels in plasma.
Immunohistochemistry.
Pancreata were fixed immediately in cold 4% paraformaldehyde (PFA) in PBS, overnight at 4 °C. Whole pancreas was embedded in optimal cutting temperature compound (OCT) for Ki67 staining or in paraffin for EdU staining. In vitro-treated mouse islets were fixed for 1 h in 4% PFA and embedded in Histogel (Thermo) and in paraffin; before their staining, paraffin slides were cleared using HistoClear (Thermoscientific) and rehydrated. Antigen retrieval was done using 45 min of pressure cooking in Citrate buffer at pH 6.0. Slides were blocked in PBS + 0.1% Triton X-100 + 10% normal donkey serum (Jackson Immunoresearch) and stained overnight in 4 °C using a 1:100 concentration of the following: mouseαGcg (Abcam), goatαGlp2 C-20 (Santa Cruz), and rabbitαKi67 (Dako). RatαC-peptide GN-ID4 and mouseαNkx6.1 F55A12 developed by Madson, O.D. were obtained from the Developmental Studies Hybridoma Bank, created by the National Institute of Child Health and Human Development of the NIH, and maintained at Department of Biology, The University of Iowa, Iowa City.
EdU Staining.
Edu (Life Tchnologies) was administered to the mice through drinking water for 3 d (mAngptl4, ApoC1) or 6 d (GRA). Pancreata were divided into head and tail parts, each sectioned into at least eight levels separated by 200 μm. A Click-iT kit (Life Technologies) was used to stain for EdU incorporation.
Quantification of α- and β-Cell Proliferation.
Quantification was performed blindly. Mice were euthanized after a 6-h fast. α- and β-cell proliferation were determined by counting at least 400 α-cells or 1,500 β-cells per mouse in at least five nonconsecutive sections of the pancreas. Glp2 or glucagon and Nkx6.1 immunostaining were used to mark α- and β-cells, respectively (Fig. S6).
Gene Expression Analysis.
RNA was isolated using an RNeasy minikit (Qiagen). Illumina TotalPrep RNA Amplification Kit (Life Technologies) was used to make cRNA, which was run on mouse ref8 V2 Expression BeadChips (Illumina) using the Whole-Genome Expression Direct Hybridization kit (Illumina). Chips were scanned on the Illumina Beadstation 500. cDNA for qPCR was prepared using SuperScript III reverse transcriptase (Life Technologies). Relative expression of angptl4 and angptl8 was measured using TaqMan probes with TaqMan Fast Universal PCR Master Mix (Life Technologies) on an ABI 7900 Real-Time PCR machine.
In Vitro Treatment of Mouse Islets.
Mouse islet isolation was performed by common bile duct perfusion with 0.8 mM Collagenase P (Roche) and further purification in Histopaque gradient (Sigma) as described previously (69). Isolated mouse islets were treated for 36 h with 250 ng/mL mAngptl4 or no additional peptides in islet media (DMEM containing 1 g/L glucose, 10% vol/vol FBS, 0.1% vol/vol penicillin/streptomycin) supplemented with 50 μg/mL human LDL (Millipore). Palmitic acid (Millipore) was dissolved in 25% ethanol at 60 °C, incubated with 10% BSA for 1 h at 37 °C, and diluted in medium to reach a concentration of 0.5 mM (44).
Statistics.
Error bars denote SEs. Student’s t test was used for qPCR, glucose, and protein levels in plasma; Mann–Whitney test was used for proliferation quantification in mice, except in vitro, where a t test was used. Gene enrichment analysis was done using the hypergeometric distribution with Benjamini–Hochberg correction.
Supplementary Material
Acknowledgments
We thank George Kenty for running the microarrays and members of our group for fruitful discussions. D.B.-Z. was supported by the Human Frontiers in Science postdoctoral fellowship. O.B. was supported by the Howard Hughes Medical Institute. S.H. was supported by the Harvard College Research Program undergraduate research fellowship. B.B. and Q.P.P. were supported by Juvenile Diabetes Research Foundation postdoctoral fellowships. D.A.M. is an Investigator of the Howard Hughes Medical Institute.
Footnotes
The authors declare no conflict of interest.
This article is a PNAS Direct Submission.
This article contains supporting information online at www.pnas.org/lookup/suppl/doi:10.1073/pnas.1513872112/-/DCSupplemental.
References
- 1.Shah P, et al. Lack of suppression of glucagon contributes to postprandial hyperglycemia in subjects with type 2 diabetes mellitus. J Clin Endocrinol Metab. 2000;85(11):4053–4059. doi: 10.1210/jcem.85.11.6993. [DOI] [PubMed] [Google Scholar]
- 2.Chuang LT, et al. Comparison of the fatty acid composition of the serum phospholipids of controls, prediabetics and adults with type 2 diabetes. J Diabetes Mellitus. 2012;2(4):393–401. doi: 10.4236/jdm.2012.24061. [DOI] [PMC free article] [PubMed] [Google Scholar]
- 3.Unger RH, Roth MG. A new biology of diabetes revealed by leptin. Cell Metab. 2015;21(1):15–20. doi: 10.1016/j.cmet.2014.10.011. [DOI] [PubMed] [Google Scholar]
- 4.D’Alessio D. The role of dysregulated glucagon secretion in type 2 diabetes. Diabetes Obes Metab. 2011;13(Suppl 1):126–132. doi: 10.1111/j.1463-1326.2011.01449.x. [DOI] [PubMed] [Google Scholar]
- 5.Yoon KH, et al. Selective beta-cell loss and alpha-cell expansion in patients with type 2 diabetes mellitus in Korea. J Clin Endocrinol Metab. 2003;88(5):2300–2308. doi: 10.1210/jc.2002-020735. [DOI] [PubMed] [Google Scholar]
- 6.Rahier J, Goebbels RM, Henquin JC. Cellular composition of the human diabetic pancreas. Diabetologia. 1983;24(5):366–371. doi: 10.1007/BF00251826. [DOI] [PubMed] [Google Scholar]
- 7.Deng S, et al. Structural and functional abnormalities in the islets isolated from type 2 diabetic subjects. Diabetes. 2004;53(3):624–632. doi: 10.2337/diabetes.53.3.624. [DOI] [PubMed] [Google Scholar]
- 8.Lee Y, Wang MY, Du XQ, Charron MJ, Unger RH. Glucagon receptor knockout prevents insulin-deficient type 1 diabetes in mice. Diabetes. 2011;60(2):391–397. doi: 10.2337/db10-0426. [DOI] [PMC free article] [PubMed] [Google Scholar]
- 9.Lee Y, et al. Metabolic manifestations of insulin deficiency do not occur without glucagon action. Proc Natl Acad Sci USA. 2012;109(37):14972–14976. doi: 10.1073/pnas.1205983109. [DOI] [PMC free article] [PubMed] [Google Scholar]
- 10.Unger RH, Cherrington AD. Glucagonocentric restructuring of diabetes: A pathophysiologic and therapeutic makeover. J Clin Invest. 2012;122(1):4–12. doi: 10.1172/JCI60016. [DOI] [PMC free article] [PubMed] [Google Scholar]
- 11.Lund A, Bagger JI, Christensen M, Knop FK, Vilsbøll T. Glucagon and type 2 diabetes: The return of the alpha cell. Curr Diab Rep. 2014;14(12):555. doi: 10.1007/s11892-014-0555-4. [DOI] [PubMed] [Google Scholar]
- 12.Kawamori D, et al. Insulin signaling in alpha cells modulates glucagon secretion in vivo. Cell Metab. 2009;9(4):350–361. doi: 10.1016/j.cmet.2009.02.007. [DOI] [PMC free article] [PubMed] [Google Scholar]
- 13.van Dongen MG, et al. First proof of pharmacology in humans of a novel glucagon receptor antisense drug. J Clin Pharmacol. 2014;55(3) doi: 10.1002/jcph.396. [DOI] [PubMed] [Google Scholar]
- 14.McShane LM, Franklin ZJ, O’Harte FP, Irwin N. Ablation of glucagon receptor signaling by peptide-based glucagon antagonists improves glucose tolerance in high fat fed mice. Peptides. 2014;60:95–101. doi: 10.1016/j.peptides.2014.08.002. [DOI] [PubMed] [Google Scholar]
- 15.Mu J, et al. Anti-diabetic efficacy and impact on amino acid metabolism of GRA1, a novel small-molecule glucagon receptor antagonist. PLoS One. 2012;7(11):e49572. doi: 10.1371/journal.pone.0049572. [DOI] [PMC free article] [PubMed] [Google Scholar]
- 16.Gelling RW, et al. Lower blood glucose, hyperglucagonemia, and pancreatic alpha cell hyperplasia in glucagon receptor knockout mice. Proc Natl Acad Sci USA. 2003;100(3):1438–1443. doi: 10.1073/pnas.0237106100. [DOI] [PMC free article] [PubMed] [Google Scholar]
- 17.Zhou C, Dhall D, Nissen NN, Chen CR, Yu R. Homozygous P86S mutation of the human glucagon receptor is associated with hyperglucagonemia, alpha cell hyperplasia, and islet cell tumor. Pancreas. 2009;38(8):941–946. doi: 10.1097/MPA.0b013e3181b2bb03. [DOI] [PMC free article] [PubMed] [Google Scholar]
- 18.Thorel F, et al. Normal glucagon signaling and β-cell function after near-total α-cell ablation in adult mice. Diabetes. 2011;60(11):2872–2882. doi: 10.2337/db11-0876. [DOI] [PMC free article] [PubMed] [Google Scholar]
- 19.Dadon D, et al. Glucose metabolism: Key endogenous regulator of β-cell replication and survival. Diabetes Obes Metab. 2012;14(Suppl 3):101–108. doi: 10.1111/j.1463-1326.2012.01646.x. [DOI] [PubMed] [Google Scholar]
- 20.Sharma RB, et al. Insulin demand regulates β cell number via the unfolded protein response. J Clin Invest. 2015;125(10):3831–3846. doi: 10.1172/JCI79264. [DOI] [PMC free article] [PubMed] [Google Scholar]
- 21.Solloway MJ, et al. Glucagon couples hepatic amino acid catabolism to mTOR-dependent regulation of α-cell mass. Cell Rep. 2015;12(3):495–510. doi: 10.1016/j.celrep.2015.06.034. [DOI] [PubMed] [Google Scholar]
- 22.Zhu P, Goh YY, Chin HF, Kersten S, Tan NS. Angiopoietin-like 4: A decade of research. Biosci Rep. 2012;32(3):211–219. doi: 10.1042/BSR20110102. [DOI] [PubMed] [Google Scholar]
- 23.Sukonina V, Lookene A, Olivecrona T, Olivecrona G. Angiopoietin-like protein 4 converts lipoprotein lipase to inactive monomers and modulates lipase activity in adipose tissue. Proc Natl Acad Sci USA. 2006;103(46):17450–17455. doi: 10.1073/pnas.0604026103. [DOI] [PMC free article] [PubMed] [Google Scholar]
- 24.Mandard S, et al. The direct peroxisome proliferator-activated receptor target fasting-induced adipose factor (FIAF/PGAR/ANGPTL4) is present in blood plasma as a truncated protein that is increased by fenofibrate treatment. J Biol Chem. 2004;279(33):34411–34420. doi: 10.1074/jbc.M403058200. [DOI] [PubMed] [Google Scholar]
- 25.Koliwad SK, et al. Angiopoietin-like 4 (ANGPTL4, fasting-induced adipose factor) is a direct glucocorticoid receptor target and participates in glucocorticoid-regulated triglyceride metabolism. J Biol Chem. 2009;284(38):25593–25601. doi: 10.1074/jbc.M109.025452. [DOI] [PMC free article] [PubMed] [Google Scholar]
- 26.Kersten S, et al. Characterization of the fasting-induced adipose factor FIAF, a novel peroxisome proliferator-activated receptor target gene. J Biol Chem. 2000;275(37):28488–28493. doi: 10.1074/jbc.M004029200. [DOI] [PubMed] [Google Scholar]
- 27.Catoire M, et al. Fatty acid-inducible ANGPTL4 governs lipid metabolic response to exercise. Proc Natl Acad Sci USA. 2014;111(11):E1043–E1052. doi: 10.1073/pnas.1400889111. [DOI] [PMC free article] [PubMed] [Google Scholar]
- 28.Yu X, et al. Inhibition of cardiac lipoprotein utilization by transgenic overexpression of Angptl4 in the heart. Proc Natl Acad Sci USA. 2005;102(5):1767–1772. doi: 10.1073/pnas.0409564102. [DOI] [PMC free article] [PubMed] [Google Scholar]
- 29.Kersten S, et al. Caloric restriction and exercise increase plasma ANGPTL4 levels in humans via elevated free fatty acids. Arterioscler Thromb Vasc Biol. 2009;29(6):969–974. doi: 10.1161/ATVBAHA.108.182147. [DOI] [PubMed] [Google Scholar]
- 30.Dijk W, et al. ANGPTL4 mediates shuttling of lipid fuel to brown adipose tissue during sustained cold exposure. eLife. 2015;4:4. doi: 10.7554/eLife.08428. [DOI] [PMC free article] [PubMed] [Google Scholar]
- 31.Köster A, et al. Transgenic angiopoietin-like (angptl)4 overexpression and targeted disruption of angptl4 and angptl3: Regulation of triglyceride metabolism. Endocrinology. 2005;146(11):4943–4950. doi: 10.1210/en.2005-0476. [DOI] [PubMed] [Google Scholar]
- 32.Romeo S, et al. Rare loss-of-function mutations in ANGPTL family members contribute to plasma triglyceride levels in humans. J Clin Invest. 2009;119(1):70–79. doi: 10.1172/JCI37118. [DOI] [PMC free article] [PubMed] [Google Scholar]
- 33.Post SR, Rubinstein PG, Tager HS. Mechanism of action of des-His1-[Glu9]glucagon amide, a peptide antagonist of the glucagon receptor system. Proc Natl Acad Sci USA. 1993;90(5):1662–1666. doi: 10.1073/pnas.90.5.1662. [DOI] [PMC free article] [PubMed] [Google Scholar]
- 34.Unson CG, Gurzenda EM, Merrifield RB. Biological activities of des-His1[Glu9]glucagon amide, a glucagon antagonist. Peptides. 1989;10(6):1171–1177. doi: 10.1016/0196-9781(89)90010-7. [DOI] [PubMed] [Google Scholar]
- 35.Grigoryan M, Kedees MH, Charron MJ, Guz Y, Teitelman G. Regulation of mouse intestinal L cell progenitors proliferation by the glucagon family of peptides. Endocrinology. 2012;153(7):3076–3088. doi: 10.1210/en.2012-1120. [DOI] [PMC free article] [PubMed] [Google Scholar]
- 36.Ellingsgaard H, et al. Interleukin-6 regulates pancreatic alpha-cell mass expansion. Proc Natl Acad Sci USA. 2008;105(35):13163–13168. doi: 10.1073/pnas.0801059105. [DOI] [PMC free article] [PubMed] [Google Scholar]
- 37.Cai Y, et al. IL-6-dependent proliferation of alpha cells in mice with partial pancreatic-duct ligation. Diabetologia. 2014;57(7):1420–1427. doi: 10.1007/s00125-014-3242-8. [DOI] [PubMed] [Google Scholar]
- 38.Longuet C, et al. The glucagon receptor is required for the adaptive metabolic response to fasting. Cell Metab. 2008;8(5):359–371. doi: 10.1016/j.cmet.2008.09.008. [DOI] [PMC free article] [PubMed] [Google Scholar]
- 39.Yang J, et al. Polyomic profiling reveals significant hepatic metabolic alterations in glucagon-receptor (GCGR) knockout mice: Implications on anti-glucagon therapies for diabetes. BMC Genomics. 2011;12:281. doi: 10.1186/1471-2164-12-281. [DOI] [PMC free article] [PubMed] [Google Scholar]
- 40.Binder JX, et al. 2014. COMPARTMENTS: Unification and visualization of protein subcellular localization evidence. Database (Oxford) 2014:bau012.
- 41.Yi P, Park JS, Melton DA. Betatrophin: A hormone that controls pancreatic β cell proliferation. Cell. 2013;153(4):747–758. doi: 10.1016/j.cell.2013.04.008. [DOI] [PMC free article] [PubMed] [Google Scholar] [Retracted]
- 42.Finegood DT, Scaglia L, Bonner-Weir S. Dynamics of beta-cell mass in the growing rat pancreas. Estimation with a simple mathematical model. Diabetes. 1995;44(3):249–256. doi: 10.2337/diab.44.3.249. [DOI] [PubMed] [Google Scholar]
- 43.Teta M, Long SY, Wartschow LM, Rankin MM, Kushner JA. Very slow turnover of beta-cells in aged adult mice. Diabetes. 2005;54(9):2557–2567. doi: 10.2337/diabetes.54.9.2557. [DOI] [PubMed] [Google Scholar]
- 44.Brelje TC, Bhagroo NV, Stout LE, Sorenson RL. Beneficial effects of lipids and prolactin on insulin secretion and beta-cell proliferation: A role for lipids in the adaptation of islets to pregnancy. J Endocrinol. 2008;197(2):265–276. doi: 10.1677/JOE-07-0657. [DOI] [PubMed] [Google Scholar]
- 45.Bäckhed F, et al. The gut microbiota as an environmental factor that regulates fat storage. Proc Natl Acad Sci USA. 2004;101(44):15718–15723. doi: 10.1073/pnas.0407076101. [DOI] [PMC free article] [PubMed] [Google Scholar]
- 46.Lichtenstein L, et al. Angptl4 protects against severe proinflammatory effects of saturated fat by inhibiting fatty acid uptake into mesenteric lymph node macrophages. Cell Metab. 2010;12(6):580–592. doi: 10.1016/j.cmet.2010.11.002. [DOI] [PMC free article] [PubMed] [Google Scholar]
- 47.Stolovich-Rain M, Hija A, Grimsby J, Glaser B, Dor Y. Pancreatic beta cells in very old mice retain capacity for compensatory proliferation. J Biol Chem. 2012;287(33):27407–27414. doi: 10.1074/jbc.M112.350736. [DOI] [PMC free article] [PubMed] [Google Scholar]
- 48.Sturis J, et al. GLP-1 derivative liraglutide in rats with beta-cell deficiencies: Influence of metabolic state on beta-cell mass dynamics. Br J Pharmacol. 2003;140(1):123–132. doi: 10.1038/sj.bjp.0705397. [DOI] [PMC free article] [PubMed] [Google Scholar]
- 49.Yi P, Park JS, Melton DA. Perspectives on the activities of ANGPTL8/betatrophin. Cell. 2014;159(3):467–468. doi: 10.1016/j.cell.2014.09.028. [DOI] [PubMed] [Google Scholar]
- 50.Spaeth JM, et al. The FOXP1, FOXP2 and FOXP4 transcription factors are required for islet alpha cell proliferation and function in mice. Diabetologia. 2015;58(8):1836–1844. doi: 10.1007/s00125-015-3635-3. [DOI] [PMC free article] [PubMed] [Google Scholar]
- 51.Liu Z, et al. Insulin and glucagon regulate pancreatic α-cell proliferation. PLoS One. 2011;6(1):e16096. doi: 10.1371/journal.pone.0016096. [DOI] [PMC free article] [PubMed] [Google Scholar]
- 52.Xu A, et al. Angiopoietin-like protein 4 decreases blood glucose and improves glucose tolerance but induces hyperlipidemia and hepatic steatosis in mice. Proc Natl Acad Sci USA. 2005;102(17):6086–6091. doi: 10.1073/pnas.0408452102. [DOI] [PMC free article] [PubMed] [Google Scholar]
- 53.Gray NE, et al. Angiopoietin-like 4 (Angptl4) protein is a physiological mediator of intracellular lipolysis in murine adipocytes. J Biol Chem. 2012;287(11):8444–8456. doi: 10.1074/jbc.M111.294124. [DOI] [PMC free article] [PubMed] [Google Scholar]
- 54.Longuet C, et al. Liver-specific disruption of the murine glucagon receptor produces α-cell hyperplasia: Evidence for a circulating α-cell growth factor. Diabetes. 2013;62(4):1196–1205. doi: 10.2337/db11-1605. [DOI] [PMC free article] [PubMed] [Google Scholar]
- 55.Galic S, Oakhill JS, Steinberg GR. Adipose tissue as an endocrine organ. Mol Cell Endocrinol. 2010;316(2):129–139. doi: 10.1016/j.mce.2009.08.018. [DOI] [PubMed] [Google Scholar]
- 56.Charron MJ, Vuguin PM. Lack of glucagon receptor signaling and its implications beyond glucose homeostasis. J Endocrinol. 2015;224(3):R123–R130. doi: 10.1530/JOE-14-0614. [DOI] [PMC free article] [PubMed] [Google Scholar]
- 57.Chen J, et al. In vivo targeted delivery of ANGPTL8 gene for beta cell regeneration in rats. Diabetologia. 2015;58(5):1036–1044. doi: 10.1007/s00125-015-3521-z. [DOI] [PubMed] [Google Scholar]
- 58.Gusarova V, et al. ANGPTL8/betatrophin does not control pancreatic beta cell expansion. Cell. 2014;159(3):691–696. doi: 10.1016/j.cell.2014.09.027. [DOI] [PMC free article] [PubMed] [Google Scholar]
- 59.Wang Y, et al. Mice lacking ANGPTL8 (Betatrophin) manifest disrupted triglyceride metabolism without impaired glucose homeostasis. Proc Natl Acad Sci USA. 2013;110(40):16109–16114. doi: 10.1073/pnas.1315292110. [DOI] [PMC free article] [PubMed] [Google Scholar]
- 60.Cox AR, et al. Angiopoietin-like protein 8 (ANGPTL8)/betatrophin overexpression does not increase beta cell proliferation in mice. Diabetologia. 2015;58(7):1523–1531. doi: 10.1007/s00125-015-3590-z. [DOI] [PMC free article] [PubMed] [Google Scholar]
- 61.Zhang R. Lipasin, a novel nutritionally-regulated liver-enriched factor that regulates serum triglyceride levels. Biochem Biophys Res Commun. 2012;424(4):786–792. doi: 10.1016/j.bbrc.2012.07.038. [DOI] [PubMed] [Google Scholar]
- 62.Ren G, Kim JY, Smas CM. Identification of RIFL, a novel adipocyte-enriched insulin target gene with a role in lipid metabolism. Am J Physiol Endocrinol Metab. 2012;303(3):E334–E351. doi: 10.1152/ajpendo.00084.2012. [DOI] [PMC free article] [PubMed] [Google Scholar]
- 63.Mattijssen F, Kersten S. Regulation of triglyceride metabolism by Angiopoietin-like proteins. Biochim Biophys Acta. 2012;1821(5):782–789. doi: 10.1016/j.bbalip.2011.10.010. [DOI] [PubMed] [Google Scholar]
- 64.Yoshida K, Shimizugawa T, Ono M, Furukawa H. Angiopoietin-like protein 4 is a potent hyperlipidemia-inducing factor in mice and inhibitor of lipoprotein lipase. J Lipid Res. 2002;43(11):1770–1772. doi: 10.1194/jlr.c200010-jlr200. [DOI] [PubMed] [Google Scholar]
- 65.Yau MH, et al. A highly conserved motif within the NH2-terminal coiled-coil domain of angiopoietin-like protein 4 confers its inhibitory effects on lipoprotein lipase by disrupting the enzyme dimerization. J Biol Chem. 2009;284(18):11942–11952. doi: 10.1074/jbc.M809802200. [DOI] [PMC free article] [PubMed] [Google Scholar]
- 66.Pascoe J, et al. Free fatty acids block glucose-induced β-cell proliferation in mice by inducing cell cycle inhibitors p16 and p18. Diabetes. 2012;61(3):632–641. doi: 10.2337/db11-0991. [DOI] [PMC free article] [PubMed] [Google Scholar]
- 67.Charles MA, et al. The role of non-esterified fatty acids in the deterioration of glucose tolerance in Caucasian subjects: Results of the Paris Prospective Study. Diabetologia. 1997;40(9):1101–1106. doi: 10.1007/s001250050793. [DOI] [PubMed] [Google Scholar]
- 68.Chen H, et al. Evidence that the diabetes gene encodes the leptin receptor: Identification of a mutation in the leptin receptor gene in db/db mice. Cell. 1996;84(3):491–495. doi: 10.1016/s0092-8674(00)81294-5. [DOI] [PubMed] [Google Scholar]
- 69.Blum B, et al. Reversal of β cell de-differentiation by a small molecule inhibitor of the TGFβ pathway. eLife. 2014;3:e02809. doi: 10.7554/eLife.02809. [DOI] [PMC free article] [PubMed] [Google Scholar]
Associated Data
This section collects any data citations, data availability statements, or supplementary materials included in this article.


