Significance
Clarifying the phylogeny of animals is fundamental to understanding their evolution. Traditionally, sponges have been considered the sister group of all other extant animals, but recent genomic studies have suggested comb jellies occupy that position instead. Here, we analyzed the current genomic evidence from comb jellies and found no convincing support for this hypothesis. Instead, when analyzed with appropriate methods, recent genomic data support the traditional hypothesis. We conclude that the alternative scenario of animal evolution according to which ctenophores evolved morphological complexity independently from cnidarians and bilaterians or, alternatively, sponges secondarily lost a nervous system, muscles, and other characters, is not supported by the available evidence.
Keywords: Metazoa, Ctenophora, Porifera, phylogenomics, evolution
Abstract
Understanding how complex traits, such as epithelia, nervous systems, muscles, or guts, originated depends on a well-supported hypothesis about the phylogenetic relationships among major animal lineages. Traditionally, sponges (Porifera) have been interpreted as the sister group to the remaining animals, a hypothesis consistent with the conventional view that the last common animal ancestor was relatively simple and more complex body plans arose later in evolution. However, this premise has recently been challenged by analyses of the genomes of comb jellies (Ctenophora), which, instead, found ctenophores as the sister group to the remaining animals (the “Ctenophora-sister” hypothesis). Because ctenophores are morphologically complex predators with true epithelia, nervous systems, muscles, and guts, this scenario implies these traits were either present in the last common ancestor of all animals and were lost secondarily in sponges and placozoans (Trichoplax) or, alternatively, evolved convergently in comb jellies. Here, we analyze representative datasets from recent studies supporting Ctenophora-sister, including genome-scale alignments of concatenated protein sequences, as well as a genomic gene content dataset. We found no support for Ctenophora-sister and conclude it is an artifact resulting from inadequate methodology, especially the use of simplistic evolutionary models and inappropriate choice of species to root the metazoan tree. Our results reinforce a traditional scenario for the evolution of complexity in animals, and indicate that inferences about the evolution of Metazoa based on the Ctenophora-sister hypothesis are not supported by the currently available data.
Resolving the phylogenetic relationships close to the root of the animal tree of life, which encompass the phyla Porifera (sponges), Cnidaria (jellyfish, corals, and their allies), Ctenophora (comb jellies), Placozoa (the “plate animals” of the genus Trichoplax), and Bilateria (the group containing all remaining phyla), is fundamental to understanding early animal evolution and the emergence of complex traits [reviewed by Dohrmann and Wörheide (1)]. Traditionally, sponges have been recognized as the sister group to the remaining animals (the “Porifera-sister” hypothesis). Under this scenario, true epithelia (with belt desmosomes connecting neighboring cells) and extracellular digestion are conventionally thought to have been primitively absent in sponges, having evolved in the common ancestor of Placozoa, Ctenophora, Cnidaria, and Bilateria. Within this group, gap junctions between neighboring cells, ectodermal and endodermal germ layers, sensory cells, nerve cells, and muscle cells evolved only once in the common ancestor of Ctenophora, Cnidaria, and Bilateria. Thus, Porifera-sister is consistent with the view that the last common ancestor of the animals was relatively simple and more complex body plans evolved after sponges had separated from the other animal lineages. However, a series of recent papers (2–6) have challenged this view, arguing the earliest split in the animal phylogeny separated ctenophores from all other animals (the “Ctenophora-sister” hypothesis), implying a group uniting Porifera, Placozoa, Cnidaria, and Bilateria, for which no shared derived morphological characters (synapomorphies) are known. The Ctenophora-sister hypothesis, if correct, would require a major revision of our understanding of animal evolution because it would imply a more complicated evolutionary history, dominated by multiple independent gains and/or losses, of key metazoan characters (7, 8). Indeed, this hypothesis has already stirred a controversial discussion about multiple origins of nervous systems (9–11).
Although results from the first study supporting Ctenophora-sister (2) were questioned soon thereafter and suggested to be an artifact stemming from the inclusion of too few nonbilaterian species (12) and the use of too rapidly evolving genes (13), this hypothesis has recently been revived in several studies, including analyses of the first two complete ctenophore nuclear genomes, as well as transcriptomic datasets from numerous other ctenophore species (4–6). Here, we present analyses of key datasets from Ryan et al. (4), Moroz et al. (5), and Whelan et al. (6), and identify several problems in these studies, specifically the combined use of relatively simplistic models of molecular evolution and distantly related outgroups (the species used to root the animal tree), and not accounting for a data acquisition bias in the analysis of a gene presence/absence matrix (4). Our analyses correcting for these issues consistently failed to support Ctenophora as the sister group to all other animals, and we therefore conclude that previous support for Ctenophora-sister arose from uncorrected systematic biases. Given the absence of convincing evidence in support of Ctenophora-sister, downstream inferences based on this hypothesis should be considered with caution.
Addressing Biases in Phylogenetic Reconstruction
Potential Biases in Phylogenomic Datasets.
When analyzing phylogenomic datasets, proper modeling of the amino acid substitution process is crucial because the use of overly simplistic models can lead to inaccurate phylogenetic inferences (reviewed in 13–17). For example, the monophyly of Chordata was not confidently resolved from phylogenomic data until sophisticated substitution models were applied (18, 19). The most commonly used models assume the substitution process is the same in all sites of a protein (site-homogeneous) (e.g., 20). Although these models have the advantage of allowing for fast computation, site homogeneity is biologically unrealistic because biochemical constraints (e.g., polarity, hydrophobicity) tend to limit the set of amino acids allowed at different sites in a protein. By not accounting for this effect, site-homogeneous models tend to overestimate the number of amino acids a site can accept, and therefore underestimate the probability of convergent evolution toward identical amino acids in unrelated species (17). This underestimation can lead to the misidentification of some convergent substitutions as evidence of shared common ancestry (reviewed in 21). To address this issue, site-heterogeneous models have been developed (22), which relax the homogeneity assumption to account for site-specific biochemical constraints. Although computationally more demanding, their increased capacity to identify convergent evolution is reflected in the better statistical fit these models generally provide to many empirical datasets (e.g., 23, 24). Here, we used a common statistical technique, Bayesian cross-validation, to compare the fit of site-homogeneous and site-heterogeneous models, and investigate whether previous studies that recovered Ctenophora-sister were influenced by the use of poorly fitting substitution models.
Outgroup selection (the species used to root the tree) can also strongly affect phylogenetic results (13, 25, 26). In particular, the inclusion of outgroups very distant from the ingroup can cause reconstruction artifacts by attracting fast-evolving (long-branched) ingroup species toward the root (25, 27–31). A typical solution is to introduce more closely related outgroups to “break up” the long branch leading to the ingroup, but long-branch attraction artifacts can be further minimized by also removing the distant outgroups. This effect has previously been documented, for example, in the case of the nematode worms in the context of testing the Ecdysozoa hypothesis against Coelomata (32), as well as for nonbilaterian relationships (33), where the removal of distant outgroups stabilized ingroup relationships. Although the effect of outgroup composition was investigated in some previous studies supporting Ctenophora-sister, this test was done only in combination with site-homogeneous models (5, 6) or results obtained under site-heterogeneous models were considered unreliable (4). Here, we performed outgroup subsampling experiments under the best-fitting models and compared our results with previous studies to clarify whether the use of distant outgroups in combination with poorly fitting models might have influenced previous analyses that found support for Ctenophora-sister.
Potential Bias in Analyses of Gene Content Datasets.
The presence or absence of genes in different species (gene content) can be considered an independent source of information to test alternative phylogenetic hypotheses. Indeed, the gene content analysis presented by Ryan et al. (4) is argued to be among the most important independent lines of evidence in support of the Ctenophora-sister hypothesis (7, 8). However, the model of gene gain and loss used by these authors was not corrected for the fact that two types of genes were not included in their dataset: (i) genes that have been lost in all species, because these genes cannot be observed, and (ii) genes lost in all but one species, which were excluded by the authors as part of the data matrix construction process. This ascertainment bias has an impact on the inference of gene loss rates, because from the perspective of the model, the absence of these patterns of gene loss in the data matrix makes it appear as though relatively fewer losses have occurred. As a result, estimates of the gene loss rate are biased downward, potentially influencing the estimation of evolutionary relationships. To obtain unbiased estimates, a correction must be applied to the model (34, 35), which formalizes the fact that these patterns of gene loss cannot be observed (the probability of observing them is equal to 0) and rescales the total probability of all other patterns appropriately (so it is equal to 1). After incorporating such a correction, we conducted phylogenetic analyses to investigate whether previous support for Ctenophora-sister based on gene content data is robust to ascertainment bias.
Results
Model Selection.
We investigated whether previous studies supporting Ctenophora-sister were conducted using adequately fitting substitution models. Using three exemplar datasets, which we call Ryan-Choano, Moroz-3D, and Whelan-6-Choano (details are provided below and in Methods), we compared the relative fit of site-homogeneous and site-heterogeneous models using Bayesian cross-validation (36, 37), a routine statistical technique used to evaluate the predictive performance of a probabilistic model, which has been commonly used in the context of phylogenetics (23, 24, 38–41). Using 10 cross-validation replicates, we found that in all cases, site-heterogeneous models fit these data significantly better than the site-homogeneous models that previous studies mostly relied upon (Table 1).
Table 1.
Cross-validation likelihood scores under the models GTR, CAT, and CAT-GTR (relative to WAG, used as a reference model)
| Dataset | GTR | CAT | CAT-GTR |
| Ryan-Choano | 342 ± 32 | 1,282 ± 110 | 1,654 ± 93 |
| Moroz-3D | 242 ± 25 | 701 ± 85 | 1,060 ± 71 |
| Whelan-6-Choano | 560 ± 50 | 1,472 ± 153 | 2,376 ± 100 |
Analysis of the Ryan et al. Phylogenomic Datasets.
We analyzed three main datasets from the original Mnemiopsis leidyi genome study (4). One dataset (Ryan-Choano) included only Choanoflagellata (the closest living relatives of Metazoa) as the outgroup. Another included Choanoflagellata plus more distantly related holozoans (Ryan-Holo), and the third (Ryan-Opistho) further included several Fungi (the most distantly related group to Metazoa among Opisthokonta). Applying the site-homogeneous general time reversible (GTR) substitution model (42), Ryan et al. (4) found strong support for Ctenophora-sister in their analyses of all three datasets, and therefore concluded it is robust to outgroup composition.
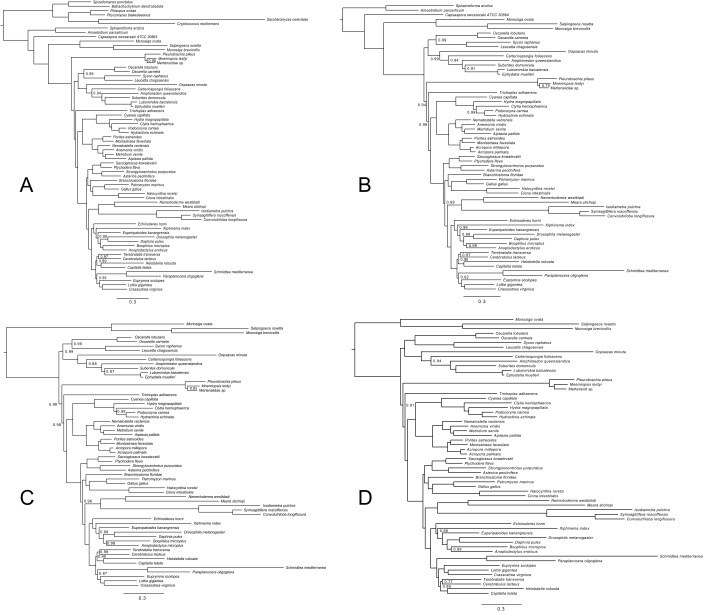
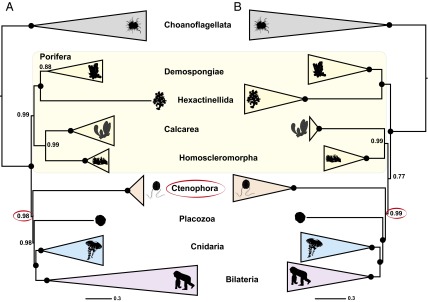
Ryan et al. (4) also attempted to analyze these datasets using the site-heterogeneous CAT (“CATegory”) model (22). In the case of Ryan-Choano and Ryan-Holo, they recovered Porifera-sister, potentially raising doubts about the credibility of Ctenophora-sister, but they dismissed these results because they did not meet standard statistical criteria for reliability (their Bayesian analyses did not reach convergence). Repeating the analyses of Ryan et al. (4), we were able to confirm the reported convergence issues. However, we identified the phylogenetically unstable bilaterian species Xenoturbella bocki (43) as the cause for the lack of convergence. Repeating the analyses after excluding X. bocki, all three reached convergence (SI Methods). Although Ryan-Opistho still supported Ctenophora-sister (Fig. S1A), Ryan-Holo and Ryan-Choano strongly supported Porifera-sister instead (Fig. 1 A–C). In other words, under the better-fitting site-heterogeneous model, ctenophores emerge as sister to all other animals only when the most distantly related outgroup, Fungi, is included, suggesting Ctenophora-sister most likely represents a long-branch attraction artifact. Repeating the analyses under CAT-GTR also gave preliminary support for Porifera-sister, but we were unable to run this analysis to convergence within the time frame of this study (Fig. S1D).
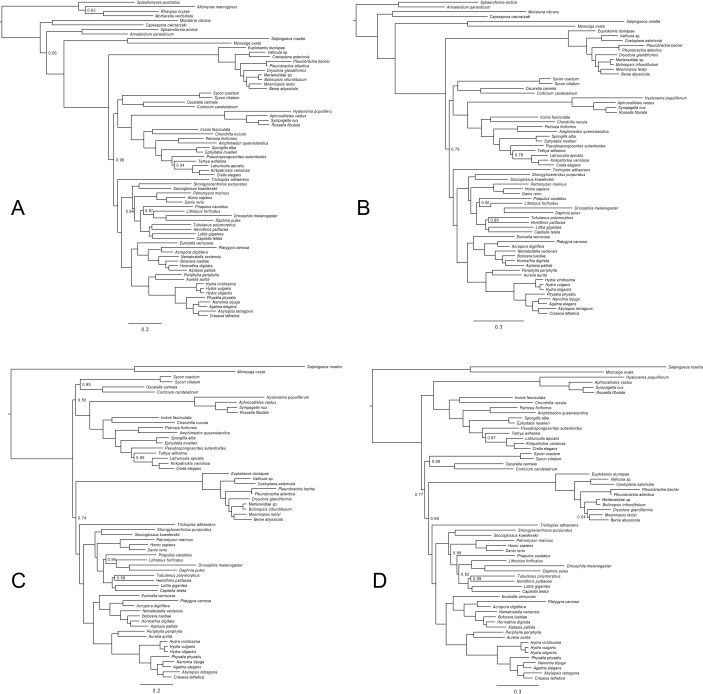
Fig. S1.
Bayesian phylogenies inferred from the datasets of Ryan et al. (4) under CAT and CAT-GTR. Nodes are labeled with posterior probabilities distinguishable from 1.0. (Scale bars, expected number of substitutions per site.) (A) Phylogeny inferred from Ryan-Opistho under CAT. Sampled points = 39,362, burnin = 15,000, bpcomp maxdiff = 0.062, tracecomp minimum effsize = 80, maximum rel_diff = 0.19. (B) Phylogeny inferred from Ryan-Holo under CAT. Sampled points = 58,543, burnin = 25,000, bpcomp maxdiff = 0.096, tracecomp minimum effsize = 90, maximum rel_diff = 0.25. (C) Phylogeny inferred from Ryan-Choano under CAT. Sampled points = 53,617, burnin = 22,000, bpcomp maxdiff = 0.077, tracecomp minimum effsize = 116, maximum rel_diff = 0.22. (D) Phylogeny inferred from Ryan-Choano under CAT-GTR. Sampled points = 15,231, burnin = 5,000, bpcomp maxdiff = 0.24, tracecomp minimum effsize = 8, maximum rel_diff = 0.7. This analysis did not reach convergence.
Fig. 1.
(A) Phylogeny inferred from Ryan-Choano (4) using the site-heterogeneous CAT model. (B) Phylogeny inferred from Whelan-D16-Choano (6) using the site-heterogeneous CAT-GTR model. For both analyses, we used the site-heterogeneous model implemented by the original study and limited the outgroups to include only choanoflagellates (the closest living relatives of animals) (details and justifications are provided in Addressing Biases in Phylogenetic Reconstruction and Methods). Major groups are summarized, and full phylogenies illustrated are in Figs. S1 and S4C. Nodes with maximal statistical support are marked with a circle. Most silhouettes from organisms are from Phylopic (phylopic.org/).
Analysis of the Moroz et al. Phylogenomic Datasets.
In the Pleurobrachia bachei genome study (5), the Ctenophora-sister hypothesis was obtained from the analysis of two datasets, one of which was constructed to maximize the number of species and the other to maximize the number of proteins. Whereas the dataset emphasizing protein sampling was broadly comparable to the dataset of Ryan et al. (4), the dataset emphasizing species sampling (Moroz-3D; Methods) was unique because it included the largest number of ctenophores sampled thus far. Given that the same authors have now assembled new datasets (6) that supersede the protein-rich datasets of Moroz et al. (5) (discussed in the next section), we only analyzed the species-rich dataset Moroz-3D.
The analysis of Moroz et al. (5) was conducted under the site-homogeneous Whelan and Goldman (WAG) model (20), which gave a tree congruent with the Ctenophora-sister hypothesis, albeit with weak statistical support. However, analyzing the Moroz-3D dataset using the similar but generally better-fitting site-homogeneous Le and Gascuel (LG) model (44), we found a different tree with a better likelihood score (Fig. S2A). This tree united demosponges and glass sponges as the sister group of all other animals, followed by ctenophores and then by calcareous and homoscleromorph sponges. Although statistical support for this branching order is very low (Fig. S2A), the same is true for the tree found by Moroz et al. (5). Finally, an analysis of this dataset using the better-fitting site-heterogeneous CAT-GTR model (45) supported demosponges, glass sponges, and homoscleromorphs as the sister group of all other animals, followed by ctenophores. However, in this tree, the calcareous sponges are deeply nested within cnidarians (Fig. S2B), and, furthermore, this analysis did not converge. The high dissimilarity between these three trees and the uniformly low support obtained across all analyses suggest the phylogenetic signal in this dataset is very weak. This weakness of signal might, among other factors, be related to massive amounts of missing data, which reach 98% for the calcareous sponges, the most unstable lineage in this dataset. Furthermore, Moroz et al. (5) reported that using a subset of their data consisting only of the most conserved proteins, they were unable to resolve relationships of the major animal lineages and could not reject Porifera-sister with statistical tests. Accordingly, we conclude the Moroz-3D dataset does not provide sufficient signal for resolving the position of Ctenophora.
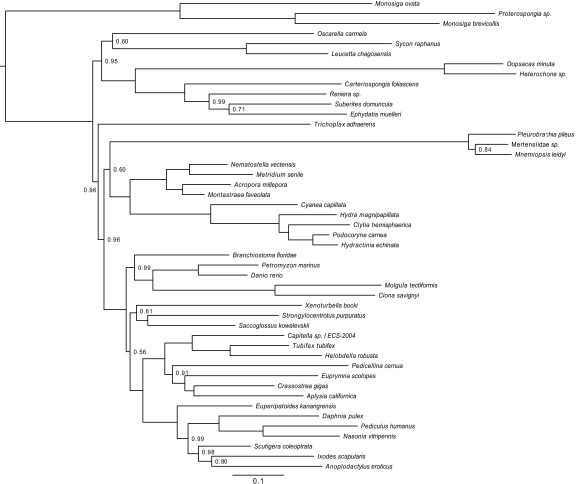
Fig. S2.
(A) Maximum likelihood phylogeny inferred from Moroz-3D (5) under LG. Final log-likelihood score = −502135. The log-likelihood score under WAG was −505012 and recovered the same topology as Moroz et al. (5). (Scale bar, expected number of substitutions per site.) Nodes are labeled with bootstrap support values less than 100%. (B) Phylogeny inferred from Moroz-3D under CAT-GTR. Sampled points = 14,140, burnin = 7,000, bpcomp maxdiff = 0.24, tracecomp minimum effsize = 17, maximum rel_diff = 0.73. This analysis did not reach convergence. (Scale bar, expected number of substitutions per site.) Nodes are labeled with posterior probabilities distinguishable from 1.0.
Analysis of the Whelan et al. Phylogenomic Datasets.
Whelan et al. (6) assembled 25 datasets differing in protein and species selection, and recovered Ctenophora-sister with strong support from all of them. Although they pointed out the importance of using site-heterogeneous substitution models, as well as the impact of outgroup composition, they did not examine the combined effect of these factors. That is, all of the outgroup-subsampled datasets were analyzed exclusively using site-homogeneous substitution models, whereas the analyses using the better-fitting site-heterogeneous model were exclusively performed using the full set of outgroups, which included distantly related Fungi.
We chose to base our analyses on their two most stringent datasets (Whelan-6 and Whelan-16; details are provided in Methods), because Whelan et al. (6) argue that these datasets are the most robust to systematic errors. Furthermore, these datasets were the only ones they analyzed with a site-heterogeneous model of sequence evolution (CAT-GTR). We performed outgroup subsampling analogous to Ryan et al. (4) on both of these datasets and analyzed the resulting six datasets under the site-heterogeneous CAT model (Methods). Consistent with our results from the Ryan et al. (4) datasets, analysis of the Whelan et al. (6) datasets gave decreased support for Ctenophora-sister because distantly related outgroups were excluded (Fig. 2 and Figs. S3 A–C and S4 A–C). At the same time, support for Porifera-sister increased (Fig. 2 B and C). These analyses were repeated for Whelan-6-Choano and Whelan-16-Choano under the computationally more demanding CAT-GTR model, which confirmed the lack of support for Ctenophora-sister with Whelan-6-Choano (Fig. S3D) and found strong support for Porifera-sister with Whelan-16-Choano (Fig. 1 and Fig. S4D). Although strong support for Porifera-sister is only provided by Whelan-16, this dataset is more conservative than the Whelan-6 dataset in that it has undergone an additional data filtering step in which further potentially paralogous sequences were removed. Because the inclusion of ctenophore paralogs would have the net effect of pushing Ctenophora toward the root of the tree, the stronger support for Porifera-sister after removing these sequences is consistent with the artifactual nature of Ctenophora-sister. Taken together, our results show the datasets of Whelan et al. (6) do not support Ctenophora-sister when both distantly related outgroups are excluded and better-fitting substitution models are used.
Fig. 2.
Decreasing support for the Ctenophora-sister hypothesis as distant outgroups are removed from phylogenomic datasets. Statistical support values (posterior probabilities) were obtained from three different datasets using the site-heterogeneous CAT model: Ryan (4) (A), Whelan-6 (6) (B), and Whelan-16 (6) (C). For each dataset, three analyses were conducted, each with a different outgroup sampling scheme: Choanoflagellata = choanoflagellates, Holozoa = nonfungal outgroups, and Opisthokonta = fungal and nonfungal outgroups. Statistical support for Ctenophora-sister and Porifera-sister is indicated in red and green, respectively. Support values are from the trees in Figs. S1, S3, and S4. The Ctenophore silhouette is from Phylopic (phylopic.org/).
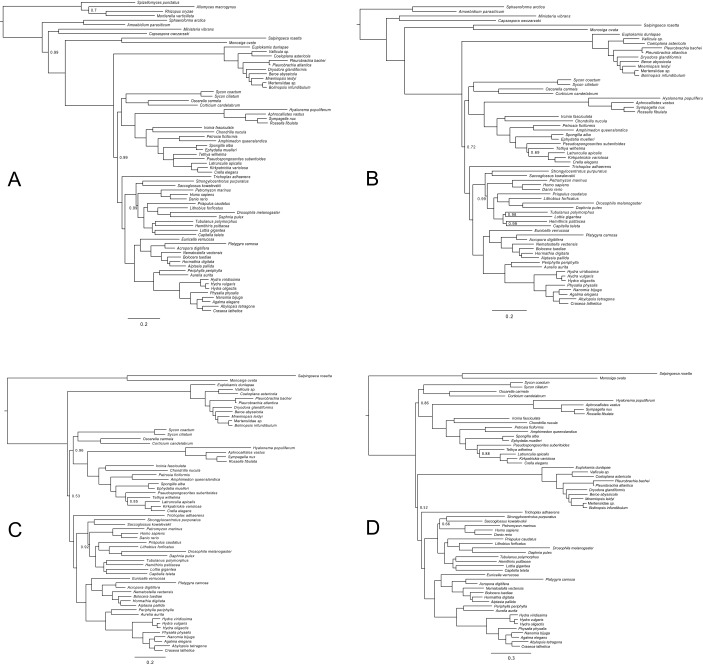
Fig. S3.
Bayesian phylogenies inferred from datasets based on Whelan-6 (6) under CAT and CAT-GTR. Nodes are labeled with posterior probabilities distinguishable from 1.0. (Scale bars, expected number of substitutions per site.) (A) Phylogeny inferred from Whelan-6-Opistho under CAT. Sampled points = 66,346, burnin = 20,000, bpcomp maxdiff = 0.038, tracecomp minimum effsize = 152, maximum rel_diff = 0.14. (B) Phylogeny inferred from Whelan-6-Holo under CAT. Sampled points = 18,095, burnin = 2,000, bpcomp maxdiff = 0.097, tracecomp minimum effsize = 50, maximum rel_diff = 0.18. (C) Phylogeny inferred from Whelan-6-Choano under CAT. Sampled points = 11,503, burnin = 3,750, bpcomp maxdiff = 0.073, tracecomp minimum effsize = 50, maximum rel_diff = 0.29. (D) Phylogeny inferred from Whelan-6-Choano under CAT-GTR. Sampled points = 44,405, burnin = 14,000, bpcomp maxdiff = 0.2, tracecomp minimum effsize = 51, maximum rel_diff = 0.45.
Fig. S4.
Bayesian phylogenies inferred from datasets based on Whelan-16 (6) under CAT and CAT-GTR. Nodes are labeled with posterior probabilities distinguishable from 1.0. (Scale bars, expected number of substitutions per site.) (A) Phylogeny inferred from Whelan-16-Opistho under CAT. Sampled points = 35,477, burnin = 15,000, bpcomp maxdiff = 0.1, tracecomp minimum effsize = 61, maximum rel_diff = 0.23. (B) Phylogeny inferred from Whelan-16-Holo under CAT. Sampled points = 12,714, burnin = 5,000, bpcomp maxdiff = 0.07, tracecomp minimum effsize = 63, maximum rel_diff = 0.26. (C) Phylogeny inferred from Whelan-16-Choano under CAT. Sampled points = 9,729, burnin = 3,750, bpcomp maxdiff = 0.08, tracecomp minimum effsize = 84, maximum rel_diff = 0.29. (D) Phylogeny inferred from Whelan-16-Choano under CAT-GTR. Sampled points = 27,929, burnin = 13,965, bpcomp maxdiff = 0.12, tracecomp minimum effsize = 76, maximum rel_diff = 0.3.
Whelan et al. (6) further argued that support for Coelenterata, a sister-group relationship of Ctenophora and Cnidaria, in the phylogenomic study of Philippe et al. (33), resulted from a bias caused by excessive reliance on ribosomal proteins. They illustrate the effect of this putative bias by reanalyzing the dataset of Philippe et al. (33) after excluding all ribosomal proteins, which yielded a tree that did not support Coelenterata and showed only moderate support for Porifera-sister. Here, we performed the same analysis, but excluded all nonchoanoflagellate outgroups, and recovered Coelenterata (albeit with weak support) and strong support for Porifera-sister (Fig. S5). These results suggest that the lack of support for Coelenterata and decreased support for Porifera-sister in Whelan et al.’s (6) reanalysis was not caused by the absence of a misleading signal specific to the generally slowly evolving ribosomal proteins but, instead, by a bias introduced by distant outgroups that becomes dominant when only the faster evolving nonribosomal proteins are retained.
Fig. S5.
Bayesian phylogeny inferred from the dataset of Philippe et al. (33) under CAT-GTR after excluding all ribosomal proteins and with only Choanoflagellata as the outgroup. Sampled points = 23,714, burnin = 3,000, bpcomp maxdiff = 0.26, tracecomp minimum effsize = 90, maximum rel_diff = 0.4. (Scale bar, expected number of substitutions per site.) Nodes are labeled with posterior probabilities distinguishable from 1.0.
Analysis of the Ryan et al. Gene Content Dataset.
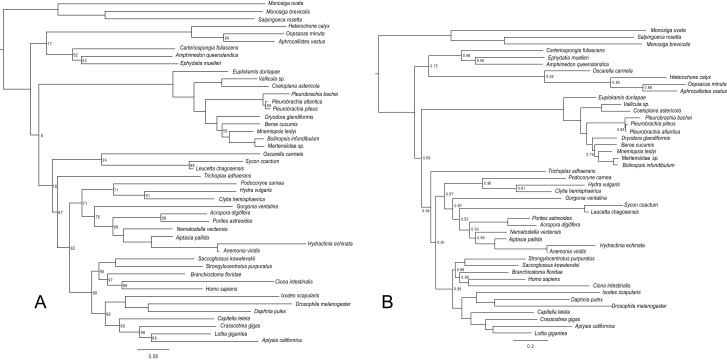
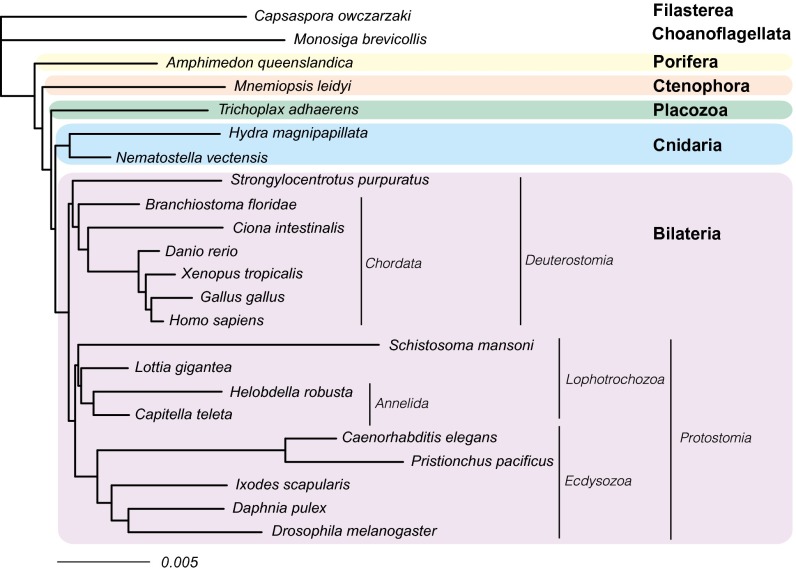
We analyzed the gene content dataset of Ryan et al. (4) both before (Fig. S6A) and after (Fig. 3 and Fig. S6B) applying an ascertainment bias correction to account for the fact that genes present in fewer than two species were not included in this dataset. Our estimate for the ratio of gene loss and gain rates was two orders of magnitude higher after accounting for unobserved losses (posterior mean = 189.4) compared with the uncorrected estimate (posterior mean = 1.94), indicating the original analysis of Ryan et al. (4) was severely biased. Indeed, we found the magnitude of this bias had a major impact on the inference of animal relationships. First, several well-established groups, such as Protostomia, Deuterostomia, Lophotrochozoa, Chordata, and Annelida, which the original analysis of Ryan et al. failed to recover (figure 4 of ref. 4), were resolved with strong statistical support once a corrected model was used (Fig. 3 and Fig. S6B). Second, the strong support for Ctenophora-sister found in the uncorrected analysis (Fig. S6A) entirely disappeared, and strong support was obtained for Porifera-sister instead (Fig. 3 and Fig. S6B). Thus, our results show that the gene content dataset of Ryan et al. (4) contains strong signal in favor of Porifera-sister, and the Ctenophora-sister hypothesis only emerges, together with a number of other erroneous groups, when an uncorrected model of gene gain and loss is applied.
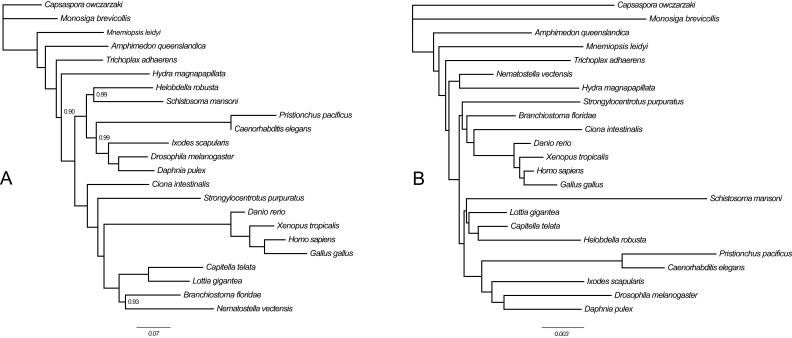
Fig. S6.
Bayesian phylogenies inferred from the gene content dataset of Ryan et al. (4) using MrBayes (discussed above and in main text). (Scale bars, expected number of substitutions per site.) Nodes are labeled with posterior probabilities distinguishable from 1.0. (A) Analysis with no ascertainment bias correction. Note that this topology is different from the one obtained by Ryan et al. (4) but gives a higher maximum log-likelihood score in RAxML (−223301 vs. −223502). Sampled points = 1 million, burnin = 250,000, MrBayes maximum SD of split frequencies = 0.017, bpcomp maxdiff = 0.024, tracecomp minimum effsize = 852, maximum rel_diff = 0.049. (B) Analysis using a correction for the absence of parsimony uninformative sites. Note that this correction required the exclusion of 1,615 parsimony uninformative characters before analysis. Sampled points = 1 million; burnin = 250,000, MrBayes maximum SD of split frequencies = 0.0, bpcomp maxdiff = 0.0, tracecomp minimum effsize = 191, maximum rel_diff = 0.17.
Fig. 3.
Animal phylogeny obtained after correcting for ascertainment bias in the full-gene content dataset of Ryan et al. (4) (more details are provided in SI Methods). All nodes had maximal statistical support.
SI Methods
Gene Content Analysis.
We reanalyzed the gene content dataset of Ryan et al. (4) after applying a correction for the fact that some gene conservation patterns were not included in the data matrix. This correction formalizes the fact that the probability of observing these patterns is equal to 0, and rescales the likelihoods of all other patterns to sum to 1. Formally, if S is the set of excluded patterns, and is the likelihood of any pattern c (given model parameters θ), then the corrected likelihood of pattern c, the likelihood given that it is observable (i.e., given ), is computed as
Specifically, in the case of the gene content dataset of Ryan et al. (4), S contains two unobservable gene conservation patterns: genes present in zero species and genes present in only a single species. We implemented a correction specifically for the exclusion of these patterns in MrBayes, development version 3.2.6 r1067 (62). Using the binary restriction site model (datatype = restriction) and a discrete gamma distribution with four site rate categories (rates = gamma), we conducted three analyses: (i) applying no ascertainment bias correction (coding = all; Fig. S6A); (ii) applying the correction we developed to account specifically for the removal of genes present in fewer than two taxa (coding = noabsencesites|nosingletonpresence; Fig. 3); and (iii) applying a correction for the removal of parsimony uninformative sites (coding = informative; Fig. S6B), which was already available in MrBayes and accounts for the absence of two additional patterns that had not been removed from this dataset: genes present in all but one species and genes present in all species. Therefore, applying this last correction required 1,615 genes displaying one of these patterns to be excluded before analysis (Note: In MrBayes 3.2.6 r1066, we corrected a bug that had prevented some of these sites from being automatically excluded; sourceforge.net/p/mrbayes/bugs/1634/).
Each analysis consisted of two runs with four Metropolis-coupled chains for 1 million generations. With the default burnin of 25%, the maximum SD of split frequencies was 0.017 for the uncorrected analysis and 0.0 for both corrected analyses. The MrBayes script used for this analysis is available at https://github.com/willpett/ctenophora-gene-content.
Discussion
We have analyzed representative genomic datasets presented by recent studies in support of the Ctenophora-sister hypothesis, which proposes that the first split on the metazoan tree of life was between comb jellies (Ctenophora) and all other animals (4–6), rather than between sponges (Porifera) and all other animals (the Porifera-sister hypothesis). We found that support for Ctenophora-sister disappears once steps are taken to minimize systematic errors, including the exclusion of distantly related outgroups and the use of better-fitting substitution models. The results of our phylogenomic analyses were further corroborated by our analysis of gene content data (4), which, after accounting for the data acquisition and filtering process, found strong support for Porifera-sister. Beyond our results, another recent study including only data from published whole-genome sequences (46) found support for Ctenophora-sister, but support for this hypothesis became insignificant when the data were analyzed under a biologically more realistic, site-heterogeneous model. Taken together, these results demonstrate the current lack of support for Ctenophora-sister, and therefore indicate that inferences about the origin of complex anatomical and genomic features in animals should not be based on an assumed position of Ctenophora as the sister group to all of the remaining animals.
Ctenophores are morphologically complex predators with true epithelia, nervous systems, muscle cells, and a digestive tract. These characters are absent from sponges, and in light of our results, this absence should be interpreted as an ancestral condition, contrary to the alternative scenario in which sponges lost these characters secondarily from a complex common ancestor of all animals [a discussion regarding nervous systems is provided elsewhere (47)]. An alternative interpretation under the Ctenophora-sister hypothesis would be that some or all of these characters evolved convergently in ctenophores. However, resolving the exact phylogenetic positions of Ctenophora and Placozoa [discussions are provided elsewhere (1, 48, 49)] will be crucial to reconstruct the evolution of key characters, such as nervous systems, muscles, and digestive tracts, in more detail. Although resolving the relationships among these taxa will require further research, our results support a clade uniting all nonsponge animals, which is consistent with a scenario in which the last common metazoan ancestor was a relatively simple, possibly filter-feeding organism, and complex traits related to a predatory lifestyle originated later.
One major result of the first whole-genome analyses of ctenophores (4, 5) was the finding that these organisms apparently lack many genes or use different genes involved in the development of anatomical structures, such as nervous systems, in other animal groups. In light of the Ctenophora-sister hypothesis, this result has been interpreted as evidence for convergent evolution, especially for nervous systems (5, 11). However, other authors have interpreted the same data differently, concluding they actually are consistent with a single origin of nervous systems (9, 10). Likewise, analyses of the opsin gene family, which is involved in light detection in animals, as well as ion-channel proteins involved in mechanoreception, are consistent with a close relationship between Ctenophora, Cnidaria, and Bilateria (50, 51). Finally, the absence of many gene families, coupled with massive lineage-specific expansions in others (6), suggests ctenophore genomes may be extremely derived compared with genomes of other animals. Thus, it may be difficult to draw conclusions about the homology or nonhomology of anatomical structures and cell types between ctenophores and other animals based on the genes involved in their development. Future studies focused on the evolution of gene content in animals will help to clarify the relationship between the homology of similar structures and their underlying genetic mechanisms (52–54).
Conclusions
The Ctenophora-sister hypothesis originally emerged as a surprising byproduct of a study aimed at resolving bilaterian relationships (2), and it has continued to grow in popularity following the recent publication of the first ctenophore nuclear genomes and accompanying phylogenetic results (4, 5). In our assessment of these previous studies (4–6), we found that support for Ctenophora-sister vanishes when steps are taken to minimize systematic error. Thus, while strong support for Ctenophora-sister may be obtained from phylogenomic datasets (2–6, 46, 55), our analysis suggests these results are caused by undetected systematic bias. Therefore, several recent studies whose conclusions are based on the assumed accuracy of Ctenophora-sister (e.g., 56–58) should be reassessed in light of alternative phylogenetic hypotheses. Our results do not support the currently emerging point of view according to which the origin of complex characters, such as nervous systems, was far more complicated than previously thought (e.g., 7, 8). More broadly, our study highlights the danger of relying solely on the presumed power of large datasets rather than on the best possible modeling of the data and carefully designed phylogenetic analyses aimed at correcting systematic errors.
Methods
Dataset Selection.
We considered a representative selection of datasets from the studies of Ryan et al. (4), Moroz et al. (5), and Whelan et al. (6):
-
i–iii)
EST datasets of Ryan et al. (4), called est.choanimalia, est.holozoa, and est.opisthokonta in the original study but, for consistency, called Ryan-Choano, Ryan-Holo, and Ryan-Opistho here. These datasets include the same set of genes but differ in the composition of outgroup species. Ryan-Choano only includes choanoflagellates; Ryan-Holo includes additional, more distantly related holozoans; and Ryan-Opistho also includes Fungi.
-
iv)
Dataset of Moroz et al. (5) associated with their extended data figure 3D (Moroz-3D). This dataset was chosen because it has a substantially improved sampling of ctenophores (11 vs. three) compared with the datasets of Ryan et al. (4), as well as other datasets presented by Moroz et al. (5).
-
v–x)
Datasets 6 and 16 of Whelan et al. (6), each with a different outgroup composition analogous to the Ryan et al. datasets (Whelan-6-Opistho, -Holo, -Choano; Whelan-16-Opistho -Holo, -Choano). These datasets were chosen because the authors stated that they maximize the number of slowly evolving genes and minimize the number of certain paralogs (dataset 6) and the number of certain and uncertain paralogs (dataset 16).
-
xi)
Gene content dataset of Ryan et al. (4). This dataset is a binary matrix representing the presence or absence of 23,910 ortholog clusters in the complete genomes of 23 animals.
-
xii)
Dataset composed of all nonribosomal proteins extracted by Whelan et al. (6) from the Philippe et al. (33) dataset, with all nonchoanoflagellate outgroups removed.
Model Testing.
We used Bayesian cross-validation (36, 37) implemented in PhyloBayes 3.3 (59) to compare the fit of the site-homogeneous WAG and GTR models and the site-heterogeneous CAT and CAT-GTR models (20, 22). To alleviate computational burden, we restricted these analyses to three exemplar datasets: Ryan-Choano, Moroz-3D, and Whelan-6-Choano. Cross-validation scores were computed by comparison with the WAG model. In addition, all models were trained under the tree topology favored by WAG, thus making the test conservative in favor of the WAG model. Ten replicates were considered, each consisting of a random subsample of 10,000 sites for training the model and 2,000 sites for calculating the cross-validation likelihood score.
Phylogenetic Reconstruction.
We analyzed the Ryan et al. (4) datasets under CAT either including or excluding X. bocki. Ryan-Choano was also analyzed under CAT-GTR. All CAT and CAT-GTR analyses were performed using PhyloBayes MPI 1.5a (59). We analyzed Moroz-3D in RAxML 8.0.26 (60) using WAG (20) and LG (44) with empirical amino acid frequencies (+F), as well as under CAT-GTR with PhyloBayes MPI. We analyzed each of the Whelan et al. (6) datasets under CAT in PhyloBayes MPI. To minimize computational burden, only Whelan-6-Choano and Whelan-16-Choano were also analyzed under CAT-GTR. The nonribosomal protein dataset of Philippe et al. (33) was stripped of all nonchoanoflagellate outgroups and analyzed with CAT-GTR. In all Bayesian analyses, among-site rate variation was modeled using a gamma distribution (+Γ) discretized into four rate categories. In maximum likelihood analyses, the 25-category CAT approximation (61) was used instead (note that the CAT approximation in RAxML is unrelated to the CAT mixture model used in PhyloBayes). Node support was evaluated using posterior probabilities in Bayesian analyses and bootstrapping (100 replicates) in maximum likelihood analyses. Convergence of Bayesian analyses was assessed by running two independent Markov chains and using the bpcomp and tracecomp tools from PhyloBayes to monitor the maximum discrepancy in clade support (maxdiff), the effective sample size (effsize), and the relative difference in posterior mean estimates (rel_diff) for several key parameters and summary statistics of the model. The appropriate number of samples to discard as “burnin” was determined first by visual inspection of parameter trace plots, and then by optimizing convergence criteria. With the exception of the CAT-GTR analyses of Ryan-Choano and Moroz-3D, the maxdiff statistic was always <0.1 under the CAT model (<0.25 under the computationally more intensive CAT-GTR model); the minimum effective sample size was >50; and the maximum rel_diff statistic was <0.3 in all but one case (the CAT-GTR analysis of Whelan-6-Choano), which had a maximum rel_diff statistic <0.45.
Gene Content Analysis.
We analyzed Ryan et al.’s (4) binary gene content dataset after applying a correction we developed specifically for the exclusion of genes present in fewer than two taxa, which we implemented in MrBayes, development version 3.2.6 r1067 (62). We also analyzed this dataset after applying a correction for the exclusion of parsimony uninformative sites, which was already available in MrBayes (more details are provided in SI Methods and Fig. S6).
Acknowledgments
We are indebted to the computational resources at the University of Bristol and the Iowa State University High Performance Computing Group. We thank the Leibniz Supercomputing Centre of the Bavarian Academy of Sciences and Humanities for the provisioning and support of Cloud computing infrastructure essential to this publication. René Neumeier is highly acknowledged for setting up and maintaining computational resources at Ludwig-Maximilians-Universität München Geobiology. We thank the associate editor and two anonymous reviewers for their constructive comments. We are also indebted to Prof. Eric Davidson for his help and encouragement while composing the manuscript. G.W. was funded by the German Research Foundation [Deutsche Forschungsgemeinschaft (DFG)] and the Ludwig-Maximilians-Universität München LMUexcellent program (Project MODELSPONGE) through the German Excellence Initiative. M.D. was funded through DFG Grants DO 1742/1-1,2. W.P. and N.L. were funded by the Agence Nationale de la Recherche (ANR) grant Ancestrome ANR-10-BINF-01-01.
Footnotes
The authors declare no conflict of interest.
This article is a PNAS Direct Submission.
Data deposition: The scripts to run our gene content analyses have been deposited in Github, github.com/willpett/ctenophora-gene-content (apart from implementing the methods in MrBayes).
This article contains supporting information online at www.pnas.org/lookup/suppl/doi:10.1073/pnas.1518127112/-/DCSupplemental.
References
- 1.Dohrmann M, Wörheide G. Novel scenarios of early animal evolution--is it time to rewrite textbooks? Integr Comp Biol. 2013;53(3):503–511. doi: 10.1093/icb/ict008. [DOI] [PubMed] [Google Scholar]
- 2.Dunn CW, et al. Broad phylogenomic sampling improves resolution of the animal tree of life. Nature. 2008;452(7188):745–749. doi: 10.1038/nature06614. [DOI] [PubMed] [Google Scholar]
- 3.Hejnol A, et al. Assessing the root of bilaterian animals with scalable phylogenomic methods. Proc Biol Sci. 2009;276(1677):4261–4270. doi: 10.1098/rspb.2009.0896. [DOI] [PMC free article] [PubMed] [Google Scholar]
- 4.Ryan JF, et al. The genome of the ctenophore Mnemiopsis leidyi and its implications for cell type evolution. Science. 2013;342(6164):1242592. doi: 10.1126/science.1242592. [DOI] [PMC free article] [PubMed] [Google Scholar]
- 5.Moroz LL, et al. The ctenophore genome and the evolutionary origins of neural systems. Nature. 2014;510(7503):109–114. doi: 10.1038/nature13400. [DOI] [PMC free article] [PubMed] [Google Scholar]
- 6.Whelan NV, Kocot KM, Moroz LL, Halanych KM. Error, signal, and the placement of Ctenophora sister to all other animals. Proc Natl Acad Sci USA. 2015;112(18):5773–5778. doi: 10.1073/pnas.1503453112. [DOI] [PMC free article] [PubMed] [Google Scholar]
- 7.Dunn CW, Giribet G, Edgecombe GD, Hejnol A. Animal phylogeny and its evolutionary implications. Annu Rev Ecol Evol Syst. 2014;45:371–395. [Google Scholar]
- 8.Dunn CW, Leys SP, Haddock SHD. The hidden biology of sponges and ctenophores. Trends Ecol Evol. 2015;30(5):282–291. doi: 10.1016/j.tree.2015.03.003. [DOI] [PubMed] [Google Scholar]
- 9.Marlow H, Arendt D. Evolution: Ctenophore genomes and the origin of neurons. Curr Biol. 2014;24(16):R757–R761. doi: 10.1016/j.cub.2014.06.057. [DOI] [PubMed] [Google Scholar]
- 10.Jékely G, Paps J, Nielsen C. The phylogenetic position of ctenophores and the origin(s) of nervous systems. Evodevo. 2015;6:1. doi: 10.1186/2041-9139-6-1. [DOI] [PMC free article] [PubMed] [Google Scholar]
- 11.Moroz LL. Convergent evolution of neural systems in ctenophores. J Exp Biol. 2015;218(Pt 4):598–611. doi: 10.1242/jeb.110692. [DOI] [PMC free article] [PubMed] [Google Scholar]
- 12.Pick KS, et al. Improved phylogenomic taxon sampling noticeably affects nonbilaterian relationships. Mol Biol Evol. 2010;27(9):1983–1987. doi: 10.1093/molbev/msq089. [DOI] [PMC free article] [PubMed] [Google Scholar]
- 13.Philippe H, et al. Resolving difficult phylogenetic questions: Why more sequences are not enough. PLoS Biol. 2011;9(3):e1000602. doi: 10.1371/journal.pbio.1000602. [DOI] [PMC free article] [PubMed] [Google Scholar]
- 14.Jeffroy O, Brinkmann H, Delsuc F, Philippe H. Phylogenomics: The beginning of incongruence? Trends Genet. 2006;22(4):225–231. doi: 10.1016/j.tig.2006.02.003. [DOI] [PubMed] [Google Scholar]
- 15.Rannala B, Yang Z. Phylogenetic inference using whole genomes. Annu Rev Genomics Hum Genet. 2008;9:217–231. doi: 10.1146/annurev.genom.9.081307.164407. [DOI] [PubMed] [Google Scholar]
- 16.Yang Z, Rannala B. Molecular phylogenetics: Principles and practice. Nat Rev Genet. 2012;13(5):303–314. doi: 10.1038/nrg3186. [DOI] [PubMed] [Google Scholar]
- 17.Telford MJ, Budd GE, Philippe H. Phylogenomic insights into animal evolution. Curr Biol. 2015;25(19):R876–R887. doi: 10.1016/j.cub.2015.07.060. [DOI] [PubMed] [Google Scholar]
- 18.Delsuc F, Tsagkogeorga G, Lartillot N, Philippe H. Additional molecular support for the new chordate phylogeny. Genesis. 2008;46(11):592–604. doi: 10.1002/dvg.20450. [DOI] [PubMed] [Google Scholar]
- 19.Singh TR, et al. Tunicate mitogenomics and phylogenetics: Peculiarities of the Herdmania momus mitochondrial genome and support for the new chordate phylogeny. BMC Genomics. 2009;10:534. doi: 10.1186/1471-2164-10-534. [DOI] [PMC free article] [PubMed] [Google Scholar]
- 20.Whelan S, Goldman N. A general empirical model of protein evolution derived from multiple protein families using a maximum-likelihood approach. Mol Biol Evol. 2001;18(5):691–699. doi: 10.1093/oxfordjournals.molbev.a003851. [DOI] [PubMed] [Google Scholar]
- 21.Lartillot N. Probabilistic models of eukaryotic evolution: Time for integration. Philos Trans R Soc Lond B Biol Sci. 2015;370(1678):20140338. doi: 10.1098/rstb.2014.0338. [DOI] [PMC free article] [PubMed] [Google Scholar]
- 22.Lartillot N, Philippe H. A Bayesian mixture model for across-site heterogeneities in the amino-acid replacement process. Mol Biol Evol. 2004;21(6):1095–1109. doi: 10.1093/molbev/msh112. [DOI] [PubMed] [Google Scholar]
- 23.Nosenko T, et al. Deep metazoan phylogeny: When different genes tell different stories. Mol Phylogenet Evol. 2013;67(1):223–233. doi: 10.1016/j.ympev.2013.01.010. [DOI] [PubMed] [Google Scholar]
- 24.Philippe H, et al. Acoelomorph flatworms are deuterostomes related to Xenoturbella. Nature. 2011;470(7333):255–258. doi: 10.1038/nature09676. [DOI] [PMC free article] [PubMed] [Google Scholar]
- 25.Bergsten J. A review of long-branch attraction. Cladistics. 2005;21(2):163–193. doi: 10.1111/j.1096-0031.2005.00059.x. [DOI] [PubMed] [Google Scholar]
- 26.Gouy R, Baurain D, Philippe H. Rooting the tree of life: The phylogenetic jury is still out. Philos Trans R Soc Lond B Biol Sci. 2015;370(1678):20140329. doi: 10.1098/rstb.2014.0329. [DOI] [PMC free article] [PubMed] [Google Scholar]
- 27.Philippe H, Laurent J. How good are deep phylogenetic trees? Curr Opin Genet Dev. 1998;8(6):616–623. doi: 10.1016/s0959-437x(98)80028-2. [DOI] [PubMed] [Google Scholar]
- 28.Philippe H, Germot A. Phylogeny of eukaryotes based on ribosomal RNA: Long-branch attraction and models of sequence evolution. Mol Biol Evol. 2000;17(5):830–834. doi: 10.1093/oxfordjournals.molbev.a026362. [DOI] [PubMed] [Google Scholar]
- 29.Brinkmann H, van der Giezen M, Zhou Y, Poncelin de Raucourt G, Philippe H. An empirical assessment of long-branch attraction artefacts in deep eukaryotic phylogenomics. Syst Biol. 2005;54(5):743–757. doi: 10.1080/10635150500234609. [DOI] [PubMed] [Google Scholar]
- 30.Dabert M, Witalinski W, Kazmierski A, Olszanowski Z, Dabert J. Molecular phylogeny of acariform mites (Acari, Arachnida): Strong conflict between phylogenetic signal and long-branch attraction artifacts. Mol Phylogenet Evol. 2010;56(1):222–241. doi: 10.1016/j.ympev.2009.12.020. [DOI] [PubMed] [Google Scholar]
- 31.Derelle R, et al. Bacterial proteins pinpoint a single eukaryotic root. Proc Natl Acad Sci USA. 2015;112(7):E693–E699. doi: 10.1073/pnas.1420657112. [DOI] [PMC free article] [PubMed] [Google Scholar]
- 32.Holton TA, Pisani D. Deep genomic-scale analyses of the metazoa reject Coelomata: Evidence from single- and multigene families analyzed under a supertree and supermatrix paradigm. Genome Biol Evol. 2010;2:310–324. doi: 10.1093/gbe/evq016. [DOI] [PMC free article] [PubMed] [Google Scholar]
- 33.Philippe H, et al. Phylogenomics revives traditional views on deep animal relationships. Curr Biol. 2009;19(8):706–712. doi: 10.1016/j.cub.2009.02.052. [DOI] [PubMed] [Google Scholar]
- 34.Felsenstein J. Phylogenies from restriction sites: A maximum-likelihood approach. Evolution. 1992;46(1):159–173. doi: 10.1111/j.1558-5646.1992.tb01991.x. [DOI] [PubMed] [Google Scholar]
- 35.Lewis PO. A likelihood approach to estimating phylogeny from discrete morphological character data. Syst Biol. 2001;50(6):913–925. doi: 10.1080/106351501753462876. [DOI] [PubMed] [Google Scholar]
- 36.Stone M. Cross-validatory choice and assessment of statistical predictions. J R Stat Soc Series B Stat Methodol. 1974;36(2):111–147. [Google Scholar]
- 37.Blanquart S, Lartillot N. A site- and time-heterogeneous model of amino acid replacement. Mol Biol Evol. 2008;25(5):842–858. doi: 10.1093/molbev/msn018. [DOI] [PubMed] [Google Scholar]
- 38.Li H, et al. Higher-level phylogeny of paraneopteran insects inferred from mitochondrial genome sequences. Sci Rep. 2015;5:8527. doi: 10.1038/srep08527. [DOI] [PMC free article] [PubMed] [Google Scholar]
- 39.Goremykin VV, et al. The evolutionary root of flowering plants. Syst Biol. 2013;62(1):50–61. doi: 10.1093/sysbio/sys070. [DOI] [PubMed] [Google Scholar]
- 40.Campbell LI, et al. MicroRNAs and phylogenomics resolve the relationships of Tardigrada and suggest that velvet worms are the sister group of Arthropoda. Proc Natl Acad Sci USA. 2011;108(38):15920–15924. doi: 10.1073/pnas.1105499108. [DOI] [PMC free article] [PubMed] [Google Scholar]
- 41.Struck TH, et al. Phylogenomic analyses unravel annelid evolution. Nature. 2011;471(7336):95–98. doi: 10.1038/nature09864. [DOI] [PubMed] [Google Scholar]
- 42.Tavaré S. Some probabilistic and statistical problems in the analysis of DNA sequences. Lect Math Life Sci. 1986;17:57–86. [Google Scholar]
- 43.Nakano H. What is Xenoturbella? Zoological Letters. 2015;1:22. doi: 10.1186/s40851-015-0018-z. [DOI] [PMC free article] [PubMed] [Google Scholar]
- 44.Le SQ, Gascuel O. An improved general amino acid replacement matrix. Mol Biol Evol. 2008;25(7):1307–1320. doi: 10.1093/molbev/msn067. [DOI] [PubMed] [Google Scholar]
- 45.Lartillot N, Lepage T, Blanquart S. PhyloBayes 3: A Bayesian software package for phylogenetic reconstruction and molecular dating. Bioinformatics. 2009;25(17):2286–2288. doi: 10.1093/bioinformatics/btp368. [DOI] [PubMed] [Google Scholar]
- 46.Borowiec ML, Lee EK, Chiu JC, Plachetzki DC. 2015. Dissecting phylogenetic signal and accounting for bias in whole-genome data sets: A case study of the Metazoa. bioRxiv:10.1101/013946. [DOI] [PMC free article] [PubMed]
- 47.Leys SP. Elements of a ‘nervous system’ in sponges. J Exp Biol. 2015;218(4):581–591. doi: 10.1242/jeb.110817. [DOI] [PubMed] [Google Scholar]
- 48.Scheel BM, Hausdorf B. Dynamic evolution of mitochondrial ribosomal proteins in Holozoa. Mol Phylogenet Evol. 2014;76:67–74. doi: 10.1016/j.ympev.2014.03.005. [DOI] [PubMed] [Google Scholar]
- 49.Bucher D, Anderson PAV. Evolution of the first nervous systems—What can we surmise? J Exp Biol. 2015;218:501–503. [Google Scholar]
- 50.Feuda R, Rota-Stabelli O, Oakley TH, Pisani D. The comb jelly opsins and the origins of animal phototransduction. Genome Biol Evol. 2014;6(8):1964–1971. doi: 10.1093/gbe/evu154. [DOI] [PMC free article] [PubMed] [Google Scholar]
- 51.Schüler A, et al. The rise and fall of TRP-N, an ancient family of mechanogated ion channels, in Metazoa. Genome Biol Evol. 2015;7(6):1713–1727. doi: 10.1093/gbe/evv091. [DOI] [PMC free article] [PubMed] [Google Scholar]
- 52.Wray GA, Abouheif E. When is homology not homology? Curr Opin Genet Dev. 1998;8(6):675–680. doi: 10.1016/s0959-437x(98)80036-1. [DOI] [PubMed] [Google Scholar]
- 53.Wagner GP. The developmental genetics of homology. Nat Rev Genet. 2007;8(6):473–479. doi: 10.1038/nrg2099. [DOI] [PubMed] [Google Scholar]
- 54.Sommer RJ. The future of evo-devo: Model systems and evolutionary theory. Nat Rev Genet. 2009;10(6):416–422. doi: 10.1038/nrg2567. [DOI] [PubMed] [Google Scholar]
- 55.Chang ES, et al. Genomic insights into the evolutionary origin of Myxozoa within Cnidaria. Proc Natl Acad Sci USA. 2015;112(48):14912–14917. doi: 10.1073/pnas.1511468112. [DOI] [PMC free article] [PubMed] [Google Scholar]
- 56.Liebeskind BJ, Hillis DM, Zakon HH. Convergence of ion channel genome content in early animal evolution. Proc Natl Acad Sci USA. 2015;112(8):E846–E851. doi: 10.1073/pnas.1501195112. [DOI] [PMC free article] [PubMed] [Google Scholar]
- 57.Dabe EC, Sanford RS, Kohn AB, Bobkova Y, Moroz LL. DNA methylation in basal metazoans: Insights from ctenophores. Integr Comp Biol. 2015 doi: 10.1093/icb/icv086. [DOI] [PMC free article] [PubMed] [Google Scholar]
- 58.Schnitzler CE, Simmons DK, Pang K, Martindale MQ, Baxevanis AD. Expression of multiple Sox genes through embryonic development in the ctenophore Mnemiopsis leidyi is spatially restricted to zones of cell proliferation. Evodevo. 2014;5:15. doi: 10.1186/2041-9139-5-15. [DOI] [PMC free article] [PubMed] [Google Scholar]
- 59.Lartillot N, Rodrigue N, Stubbs D, Richer J. PhyloBayes MPI: Phylogenetic reconstruction with infinite mixtures of profiles in a parallel environment. Syst Biol. 2013;62(4):611–615. doi: 10.1093/sysbio/syt022. [DOI] [PubMed] [Google Scholar]
- 60.Stamatakis A. RAxML version 8: A tool for phylogenetic analysis and post-analysis of large phylogenies. Bioinformatics. 2014;30(9):1312–1313. doi: 10.1093/bioinformatics/btu033. [DOI] [PMC free article] [PubMed] [Google Scholar]
- 61.Stamatakis A. 2006. Phylogenetic models of rate heterogeneity: A high performance computing perspective. Parallel and Distributed Processing (IPDPS), 2006 20th IEEE International Symposium. [DOI]
- 62.Ronquist F, et al. MrBayes 3.2: Efficient Bayesian phylogenetic inference and model choice across a large model space. Syst Biol. 2012;61(3):539–542. doi: 10.1093/sysbio/sys029. [DOI] [PMC free article] [PubMed] [Google Scholar]


