Significance
DNA helicases are essential enzymes that unwind dsDNA to ssDNA to access the information encoded within those strands. We describe a new single-molecule imaging procedure to follow DNA unwinding in real-time and apply it to Escherichia coli RecQ helicase. Using a fluorescent sensor to detect ssDNA and fluorescence microscopy, we observe that DNA unwinding occurs by initial nucleation of RecQ at random DNA sites and concomitant local melting of duplex DNA. Subsequently, RecQ assembles into a distribution of multimeric species that processively unwind DNA at rates proportional to their assembled state. Thus, RecQ helicase acts by a mechanism that is distinctive in that the active form is a variable and heterogeneous ensemble of loosely coupled monomeric entities.
Keywords: recombination, fluorescence, TIRF microscopy, DNA repair, BLM
Abstract
DNA helicases are motor proteins that unwind double-stranded DNA (dsDNA) to reveal single-stranded DNA (ssDNA) needed for many biological processes. The RecQ helicase is involved in repairing damage caused by DNA breaks and stalled replication forks via homologous recombination. Here, the helicase activity of RecQ was visualized on single molecules of DNA using a fluorescent sensor that directly detects ssDNA. By monitoring the formation and progression of individual unwinding forks, we observed that both the frequency of initiation and the rate of unwinding are highly dependent on RecQ concentration. We establish that unwinding forks can initiate internally by melting dsDNA and can proceed in both directions at up to 40–60 bp/s. The findings suggest that initiation requires a RecQ dimer, and that continued processive unwinding of several kilobases involves multiple monomers at the DNA unwinding fork. We propose a distinctive model wherein RecQ melts dsDNA internally to initiate unwinding and subsequently assembles at the fork into a distribution of multimeric species, each encompassing a broad distribution of rates, to unwind DNA. These studies define the species that promote resection of DNA, proofreading of homologous pairing, and migration of Holliday junctions, and they suggest that various functional forms of RecQ can be assembled that unwind at rates tailored to the diverse biological functions of RecQ helicase.
DNA helicases are ubiquitous enzymes involved in many aspects of DNA metabolism, including DNA replication, repair, and recombination. These enzymes work by coupling the hydrolysis of nucleoside triphosphates (NTPs) to unwinding of double-stranded DNA (dsDNA) to produce single-stranded DNA (ssDNA) (1). This activity allows the cell’s machinery to access the information stored within the bases of the double helix. RecQ helicase from Escherichia coli is the founding member of the RecQ family of helicases (2). These enzymes belong to the superfamily 2 (SF2) group of helicases, yet share greater sequence homology with their own family members, and they play important roles in the maintenance of genomic integrity by DNA recombination and repair (1, 3). Mutations in the human RecQ-like helicases, Bloom (BLM), Werner (WRN), and RecQ4 proteins, lead to Bloom’s, Werner’s, and Rothmund–Thomson syndromes, respectively. These genetic disorders are characterized by genomic instability and an increased incidence of cancers (4).
E. coli RecQ is a 3′ → 5′ helicase that functions in DNA-break repair by homologous recombination (2, 5, 6). RecQ and RecJ, a 5′ → 3′ exonuclease, process ssDNA gaps or dsDNA breaks into ssDNA for recombinational repair by RecA (7–10). In addition, RecQ ensures recombination fidelity in vivo by removing inappropriately paired joint molecules to prevent illegitimate recombination and also by disrupting joint molecule intermediates to facilitate repair by synthesis-dependent strand annealing, preventing chromosomal crossing over (7, 9, 11, 12). RecQ also functions with topoisomerase III (Topo III), a type I topoisomerase, to catenate and decatenate DNA molecules and to separate converged replication forks (13, 14). RecQ and Topo III provide an alternative to the RuvABC pathway for disengaging double Holliday junctions and do so without producing chromosomal crossovers (15).
In vitro, RecQ can unwind a multitude of DNA substrates and does not require a ssDNA tail, or even a dsDNA end, to initiate unwinding; consequently, it is distinctive in being able to unwind covalently closed circular plasmid DNA (16, 17). The winged-helix domain of RecQ is important for the recognition of this broad array of DNA substrates (18). This domain binds to dsDNA yet it adopts a flexible conformation that allows it to adapt to many DNA structures. A curious feature of RecQ is that maximal unwinding requires nearly stoichiometric amounts of protein relative to the DNA (one protein per ∼10 bp), which can be partially mitigated (one protein per ∼30 bp) by including the ssDNA binding protein, SSB (5, 6, 16, 19). This behavior is compatible with the low processivity of ssDNA translocation (∼30–100 nucleotides) by RecQ (20–22) and other RecQ members (23). Paradoxically, at limiting concentrations, most RecQ helicases nonetheless efficiently unwind several kilobases of dsDNA in the course of their normal functions (9, 16, 24–26), suggesting a dynamic unwinding process. Although RecQ can unwind DNA as a monomer, it also shows a functional cooperativity when unwinding DNA with an ssDNA tail (27–29). Thus, multiple monomers can bind to ssDNA to unwind long dsDNA regions.
Fluorescence techniques coupled with single-molecule microscopy have emerged as a powerful method for studying the unwinding mechanism of helicases (30–35). These assays measure individual enzymes directly or indirectly through their actions on individual DNA molecules, thus alleviating many of the drawbacks of ensemble experiments. In particular, total internal reflection fluorescence (TIRF) microscopy permits the detection of individual fluorophores with high sensitivity in the presence of a high background (30). To visualize the activity of DNA binding proteins and helicases, TIRF microscopy can be coupled with microfluidic techniques to facilitate visualization of molecules and exchange of solution components (36–39).
Ensemble assays have elucidated many features of DNA unwinding by the RecQ helicase family, but the need to average over a heterogeneous and unsynchronized population of enzymes has precluded a thorough understanding of this diverse and universally important helicase family. To permit a more insightful analysis, we directly visualized unwinding of individual molecules of DNA by RecQ helicase. Unwinding was monitored using fluorescent SSB to visualize generation of ssDNA. On single DNA molecules, we could see tracks of the fluorescent SSB binding to ssDNA produced by the helicase activity of RecQ. We show that RecQ initiates DNA unwinding via melting of duplex DNA at internal sites. Once initiated, DNA unwinding propagates either uni- or bidirectionally via the cooperative action of multiple RecQ molecules at the junction of ssDNA with dsDNA. Collectively, these observations define a stable oligomeric complex of subunits involved in processive helicase action, which is concordant with both biochemical and biological function of RecQ helicases and other helicases.
Results
Tethering DNA Molecules to a Glass Surface and Their Visualization by TIRF Microscopy.
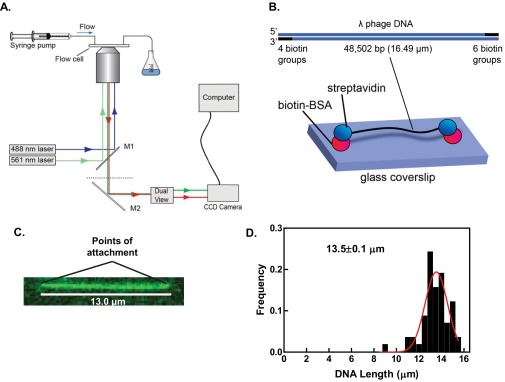
TIRF microscopy was used to minimize bulk fluorescence and enhance the signal from the fluorescent SSB. Fig. S1A shows a schematic of the instrumentation used for our experiments in which two excitation lasers, 488 or 561 nm, are reflected off of the surface of a flow cell through an oil-immersion TIRF objective lens. Single molecules of phage λ DNA were attached to the surface of the flow cell via biotin moieties incorporated onto both ends of the DNA and streptavidin–BSA bound to the surface of the flow cell (Fig. S1B). DNA was attached under flow; typically, one end attaches, then the DNA is flow extended to attach the other end. Fig. S1C shows an image of λ DNA stained with the fluorescent carbocyanine dye, YO-PRO-1, and attached to the surface at both ends in the absence of flow. A histogram of the distances measured between attachment points for 58 DNA molecules yields a mean of 13.5 ± 0.1 μm, which is equivalent to 82% of the full extension of B-form DNA (Fig. S1D).
Fig. S1.
TIRF microscopy is used to visualize unwinding of surface-tethered DNA molecules. (A) Schematic of the TIRF microscope system used to visualize DNA unwinding by RecQ. Flow cells were mounted on an oil-immersion 100x TIRF objective. Two lasers, 488 nm and 561 nm, were guided into the microscope objective using dichroic mirrors (M1 and M2). The fluorescence emission was filtered through the dual-view apparatus, which separates the red and green components of the emitted fluorescence. A CCD camera controlled by a computer was used to collect the fluorescence images. Laser shutters were coordinated with the iXon camera to illuminate the sample only during exposure times and reduce photobleaching of the fluorophores. (B, Top) Diagram of the phage λ DNA molecule with the indicated number of biotin groups incorporated within the 12-nt cos overhangs. (Bottom) Illustration of biotinylated λ DNA attached at both ends via biotin–streptavidin linkage. (C) Image of a λ DNA molecule attached to the glass surface, stained with YO-PRO-1 (100 nM), and illuminated with the 488-nm laser. The image is false colored in green and the attachment points to the glass surface are indicated. (D) Histogram of the lengths of 58 molecules of λ phage DNA doubly tethered to the glass surface. We fit the data to a Gaussian function and calculated a mean length of 13.5 ± 0.1 µm. This value is consistent with the observed relative extension of singly tethered λ phage DNA molecules under shear flow (72), indicating that for our doubly tethered DNA molecules, the flow-induced shear force, and not the density of streptavidin, limits dsDNA extension.
Fluorescent SSB Is Used to Track DNA Unwinding by RecQ.
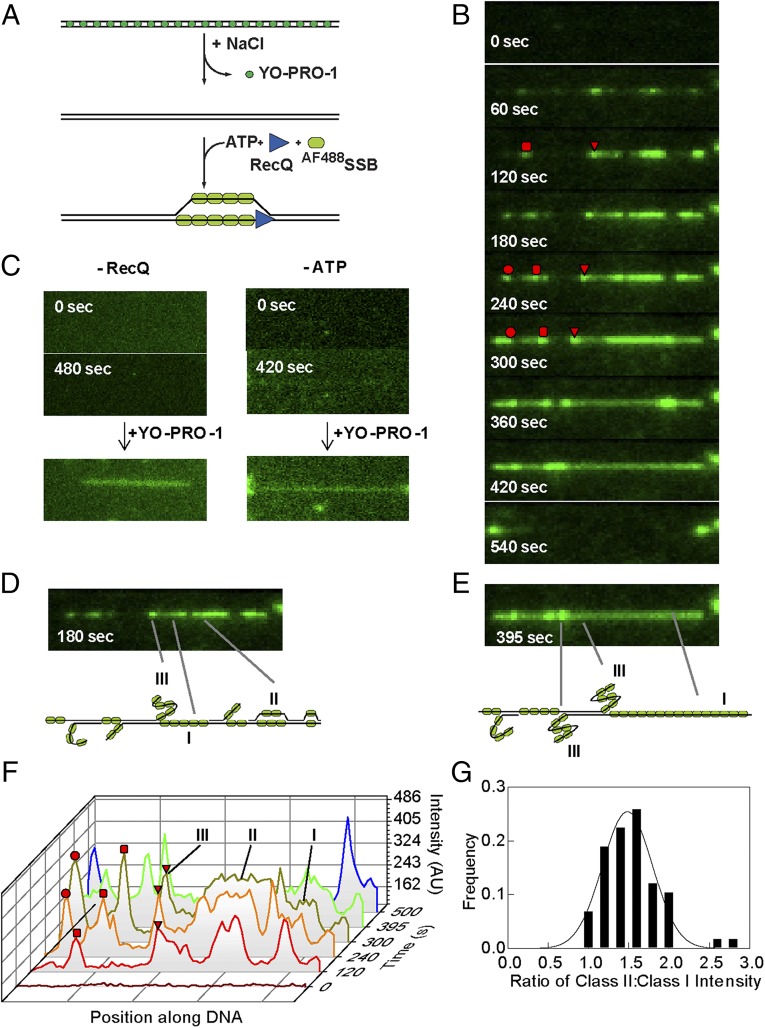
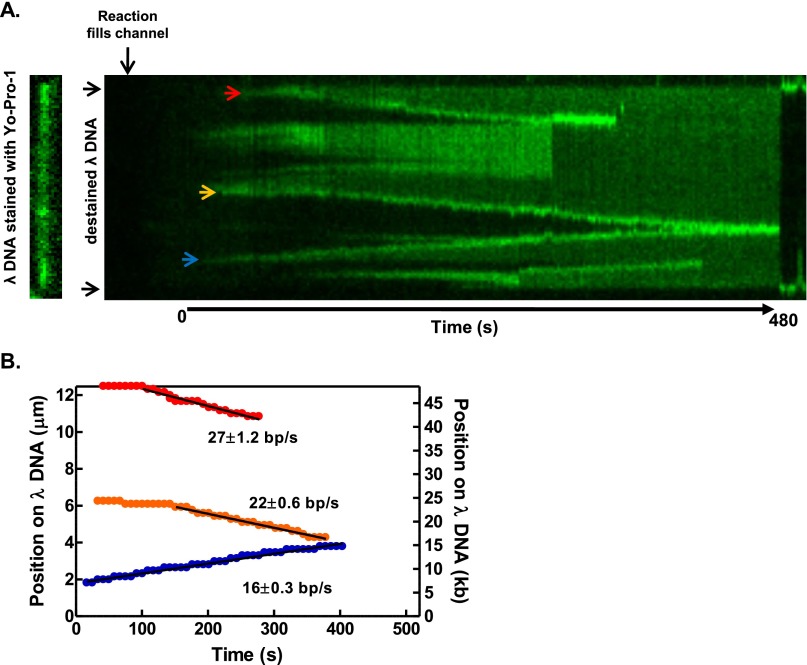
We used a fluorescent sensor for ssDNA to monitor unwinding of the doubly tethered DNA molecules by RecQ (Fig. 1A). A mutant of SSB with a unique cysteine was chemically modified with either Alexa Fluor 488 (AF488SSB) or 546 (AF546SSB) dye (40). After attaching λ DNA to the surface of the flow cell, the YO-PRO-1 that was required for visualization and measurement of the DNA molecules length, was removed by washing with buffer containing 200 mM NaCl (Movie S1). Subsequently, a solution containing RecQ, excess AF488SSB, and ATP was injected into the flow cell. Fig. 1B shows frames of a λ DNA molecule being unwound by RecQ; the resulting ssDNA is detected via the binding of AF488SSB (Movie S1). At 60 s following initiation, several fluorescent spots and tracks of AF488SSB are observed; as will be more fully developed below, these regions represent RecQ-dependent unwinding forks. After several minutes, these regions grow along the DNA molecule forming clearly visible tracks that begin to converge with one another; both prior and survey experiments showed that the rates of DNA unwinding were independent of SSB concentration when in excess over the ssDNA produced (16). At 360 and 420 s, two bright spots, representing two forks are converging; for such converging forks, their rate was linear and unchanged right up to the point of their collision (Fig. S2). When the two converging forks meet, the DNA molecule breaks, recoiling to the points of attachment (Fig. 1B, 540 s). Omitting either ATP or RecQ in the presence of AF488SSB does not result in any fluorescent SSB on the DNA, even after 7 min (Fig. 1C). These control experiments also show that AF488SSB does not spontaneously bind to or denature dsDNA.
Fig. 1.
RecQ helicase activity can be imaged on single DNA molecules using a fluorescent sensor of ssDNA, AF488SSB, to track DNA unwinding. (A) Schematic of single-molecule visualization of DNA unwinding by RecQ. Phage λ DNA, attached to the surface at each end, is initially imaged using YO-PRO-1. After destaining, RecQ, ATP, and AF488SSB are introduced to initiate unwinding. (B) Images of a DNA molecule being unwound by RecQ (80 nM) as a function of time. Red circle, square, and triangle highlight three unwinding forks tracked in F. (C) Reaction as in B but omitting either RecQ (Left) or ATP (Right); the DNA molecule is shown to be intact in each case by staining with YO-PRO-1 (100 nM) following the reaction (Below). (D and E, Top) Frame of the molecule in B after 180 and 395 s, respectively, showing regions with different fluorescence intensities on the same molecule. (Bottom) Interpretative diagrams showing different classes of unwound regions bound by AF488SSB: class I, one strand of ssDNA; class II, unwinding bubbles with two strands of ssDNA; and class III, nicked ssDNA condensed by AF488SSB. (F) Graph showing pixel intensities along the contour of the unwound molecule. Traces are shifted along the diagonal to indicate increasing time. Also shown is the intensity along the DNA path at 500 s (blue trace), after the molecule has broken. Red circle, square, and triangle highlight three unwinding forks in B; the triangle and square are converging. (G) Ratio of the intensity of class II sites relative to class I sites plotted as a distribution (N = 58). The distribution is fit to a Gaussian shown by the solid black line; the peak is 1.5 ± 0.3.
Fig. S2.
Converging unwinding forks show no change in rate. (A) Kymograph of the DNA molecule in Fig. 1 and Movie S1 being unwound in a reaction containing RecQ (80 nM), ATP (1 mM), and AF488SSB (60 nM). Three unwinding forks are observed (red, orange, and blue arrows). The orange and blue forks converge toward the end of the experiment, resulting in breakage of the molecule. (B) Plot of the position of each unwinding fork in A as a function of time (colored circles). The rate of each fork is determined by a fit to the linear portion of the position (black lines). The values of these rates are shown for each plot. At 380 s, the orange and blue forks merge and their positions are indistinguishable, given the microscope resolution. The progression of these two forks appears unchanged and linear as they converge.
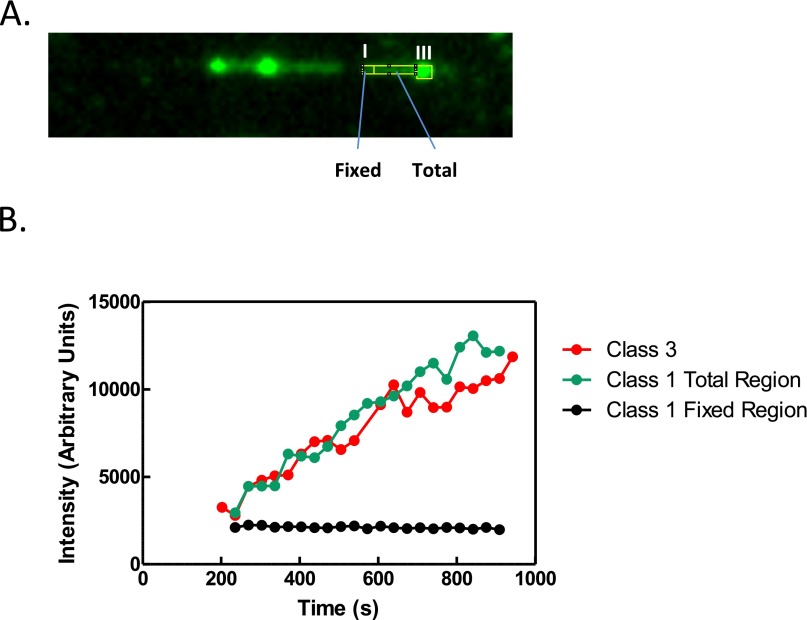
To determine the nature of the DNA intermediates, we analyzed the fluorescence intensity along the contour of the DNA molecule during unwinding (Fig. 1 D–F). DNA unwinding will produce two strands of ssDNA, but if a DNA strand is nicked or becomes nicked due to photo-induced cleavage, there will be one extended strand and one relaxed, coiled strand. A plot of the intensity along the length of these intermediates reveals three different intensity levels indicated by Roman numerals I, II, and III (Fig. 1F). Class I represents one strand of ssDNA coated with fluorescent SSB. Class II regions are two strands of ssDNA coated with fluorescent SSB and are differentiated from class I by their nearly twofold higher intensity. For 58 molecules with both types of regions, we find that the mean intensity of class II regions is 1.5 ± 0.3-fold higher than class I regions (Fig. 1G); this value is lower than 2, but this may reflect some unavoidable background fluorescence or perhaps some exclusion of SSB from the proximal unwound strands of DNA. In many instances, we observe a bright spot at an unwinding fork adjacent to an unwound single-strand of DNA (a class I region); this spot increases in intensity as the unwinding fork progresses (Fig. S3). A similar behavior, but using the fluorescent DNA-binding stain YOYO-1, had been seen for the unwinding products generated by RecBCD enzyme after its nuclease activity was attenuated by recognition of χ: this spot was ssDNA that grew in intensity as RecBCD continued to unwind the dsDNA (33). Likewise, as observed here, DNA unwinding by the AddAB helicase/nuclease produced complexes of fluorescent SSB and ssDNA whose intensity both increased with time and correlated with the amount of DNA unwound (39). Consequently, here we define such spots as class III, which are a nicked, unwound single-strand of DNA bound by AF488SSB (Fig. S3, Fig. 1 D and E, and the cartoons below). Due to the absence of flow, this complex adopts a condensed SSB–ssDNA structure as observed previously (41). Further evidence supporting our interpretations comes from the observation that during unwinding, class II regions (two strands of unwound DNA in an unwinding bubble) decrease to the fluorescence intensity of a class I region (one strand of DNA) when the bubble reaches a region of ssDNA (compare DNA molecule in Fig. 1 D and E, particularly the right side) and simultaneously, the other strand converts to a class III spot or is lost from the remaining DNA. In the latter case, one of the unwound strands dissociates from the incompletely unwound DNA molecule, which is still tethered to the surface. At the internal regions denoted as class III, RecQ initiated unwinding either from a nick or from an intact duplex region that subsequently became nicked. However, the presence of class II regions implies that the helicase can initiate from intact, internal dsDNA sites as well (given our diffraction-limited spatial resolution, DNA ends are defined to within ∼1,000 bp of the actual DNA end). Of the total number of unwinding forks observed (n = 340), at least 309 initiated away from an end, at an internal dsDNA site (defined as >1,000 bp away from an observed end), representing 81% of the total number of forks. Of the internal unwinding forks, 33% were class II species (n = 113), establishing that these RecQ unwinding forks initiated in a duplex region without a nick. In addition, as will be shown below, RecQ initiated unwinding randomly along the DNA molecule.
Fig. S3.
Class III region intensity increases with unwinding fork progression and correlates with the intensity of a class I region. (A) Image of a DNA molecule being unwound by RecQ (100 nM) from Fig. 2. The frame represents 538 seconds of elapsed time. The outlined regions show the selected area in which the integrated intensity was measured for class I and class III regions. The measured area of the class III region was increased as the region grew in size, while the class I region area was both measured in one region (Fixed) or as it grew in length along the molecule (Total). The frame image was scaled using interpolation for clarity. (B) Graph of the intensity measurements from class I and class III regions during unwinding fork progression. The integrated intensity of each class type was measured every 4 frames from the corresponding movie using increasing outlined regions and is shown as a function of elapsed time.
The Movement of Individual DNA Unwinding Bubbles Can Be Bidirectional and the Rate Is Unexpectedly Dependent on RecQ Concentration.
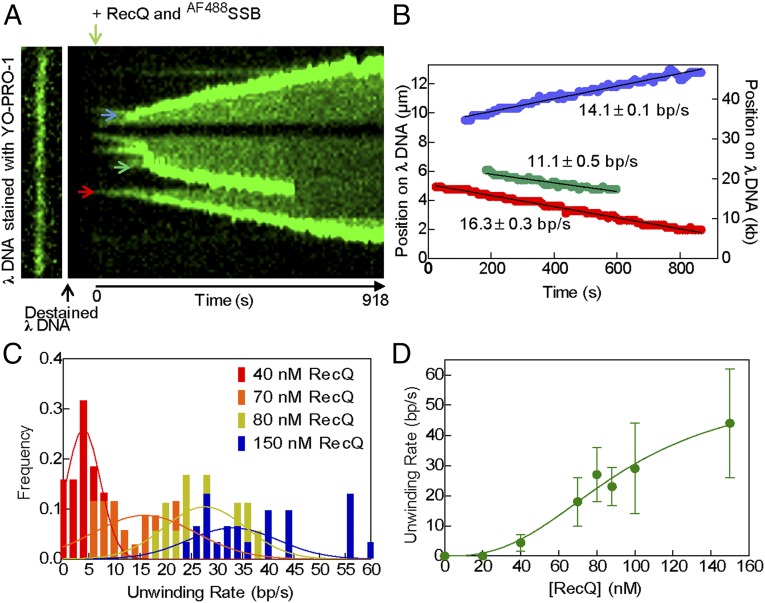
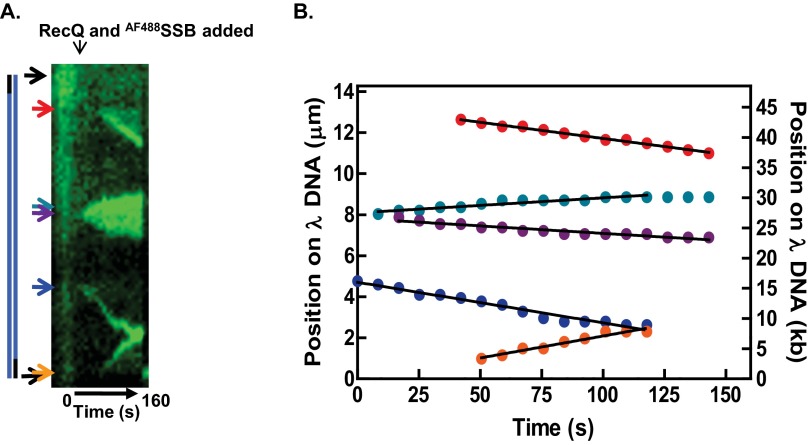
The appearance and subsequent growth of the fluorescence tracks allowed us to directly measure the unwinding rate at a single fork. Fig. 2A shows a kymograph of a DNA molecule being unwound by RecQ, and the progression of several unwinding forks (Fig. 2A; blue, green, and red arrows; Movie S2). The position of each unwinding fork relative to the top end of the DNA molecule was plotted as a function of time in Fig. 2B. These graphs show that unwinding initiated and the forks progressed in either direction for several kilobases. In some instances, an individual fork grew in both directions (Fig. S4 and Movie S3). Such bidirectional forks accounted for 21% of all internal unwinding events (n = 66).
Fig. 2.
The observed rate of DNA unwinding at individual forks increases with RecQ concentration. (A, Left) DNA molecule stained with YO-PRO-1 (13.3 µm). (Right) Kymograph of the same DNA molecule being unwound by RecQ (100 nM), imaged using AF488SSB. Vertical direction shows position along molecule, and horizontal direction is time. Arrows (blue, green, and red) indicate unwinding forks quantified in B. (B) Graph showing position of unwinding forks in A versus time; black line is a fit to a linear region to obtain the unwinding rate. (C) Histograms of unwinding rates at various RecQ concentrations, and fits to a Gaussian distribution. (D) Mean rates of unwinding plotted as a function of RecQ concentration. Data (n = 18–31 forks at each concentration, except four at 88 nM) were fit to the Hill equation (green curve) with parameters: Vmax = 56 ± 12 bp/s, Hill coefficient (nH) = 2.6 ± 0.7, and S0.5 = 93 ± 18 nM RecQ. Error bars represent SD.
Fig. S4.
Unwinding forks can proceed in a bidirectional fashion. (A) Kymograph of a molecule of DNA being unwound in a reaction containing RecQ (40 nM), ATP (1 mM), and AF488SSB (60 nM) at 37 °C. Three unwinding forks are observed to be class I or III (red, blue, and orange arrows), whereas another unwinding fork, class II, initiates in the DNA molecule and grows in a bidirectional fashion (teal and purple arrows). (B) Plot of the position of each unwinding fork in A as a function of time. At 125 s, the orange and blue forks are too close, given our resolution, to distinguish the position of either one. The pause in the blue fork appears to be more distinctive because a scaling function was used in ImageJ to smooth the visual display of the magnified image. However, the data points in B were taken directly from individual frames that were not subjected to smoothing and are, thus, experimentally accurate (Movie S3).
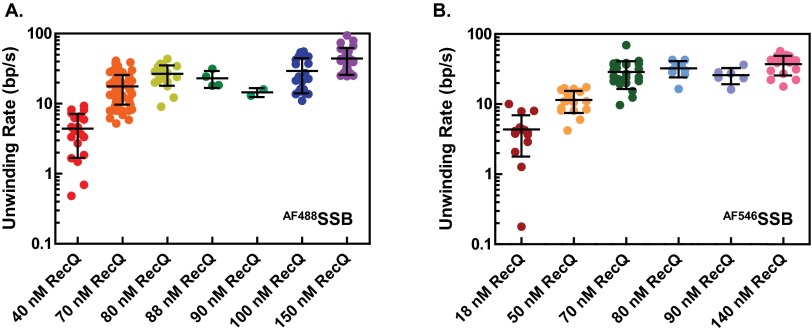
The rate of fork movement was determined from linear fitting to the traces, after any lag phases (Fig. 2B, black lines). The individual rates vary substantially (Fig. S5A) and can be represented by a Gaussian curve at any given concentration (Fig. 2C). If these rates represent the activity of a single helicase protomer, then the rates should be independent of RecQ concentration. Unexpectedly, when the rate of unwinding fork movement was measured at other RecQ concentrations, the unwinding rates increased with RecQ concentration (Fig. 2C and Fig. S5A). Plotting the mean rate of DNA unwinding, derived from Gaussian fitting, as a function of RecQ concentration shows that the values are sigmoidal with respect to the helicase concentration (Fig. 2D). Fitting the data in Fig. 2D to the Hill equation, we determine a Hill coefficient of 2.6 ± 0.7, a maximum velocity (Vmax) for DNA unwinding of 56 ± 12 bp/s, and a midpoint in the sigmoidal unwinding curve (S0.5) of 93 ± 18 nM RecQ monomer. The value of the Hill coefficient implies that multiple RecQ monomers (three or more) cooperate to unwind DNA at the fork.
Fig. S5.
Increasing RecQ concentration results in a distribution of increasing unwinding rates. (A) Distribution of the rates of unwinding by RecQ tracked by AF488SSB and (B) AF546SSB. Each circle represents a measured rate from an unwinding fork. The mean and SD at each concentration is shown by a horizontal line and error bar.
The Sigmoidal Unwinding Behavior Is Independent of the Fluorophore on SSB.
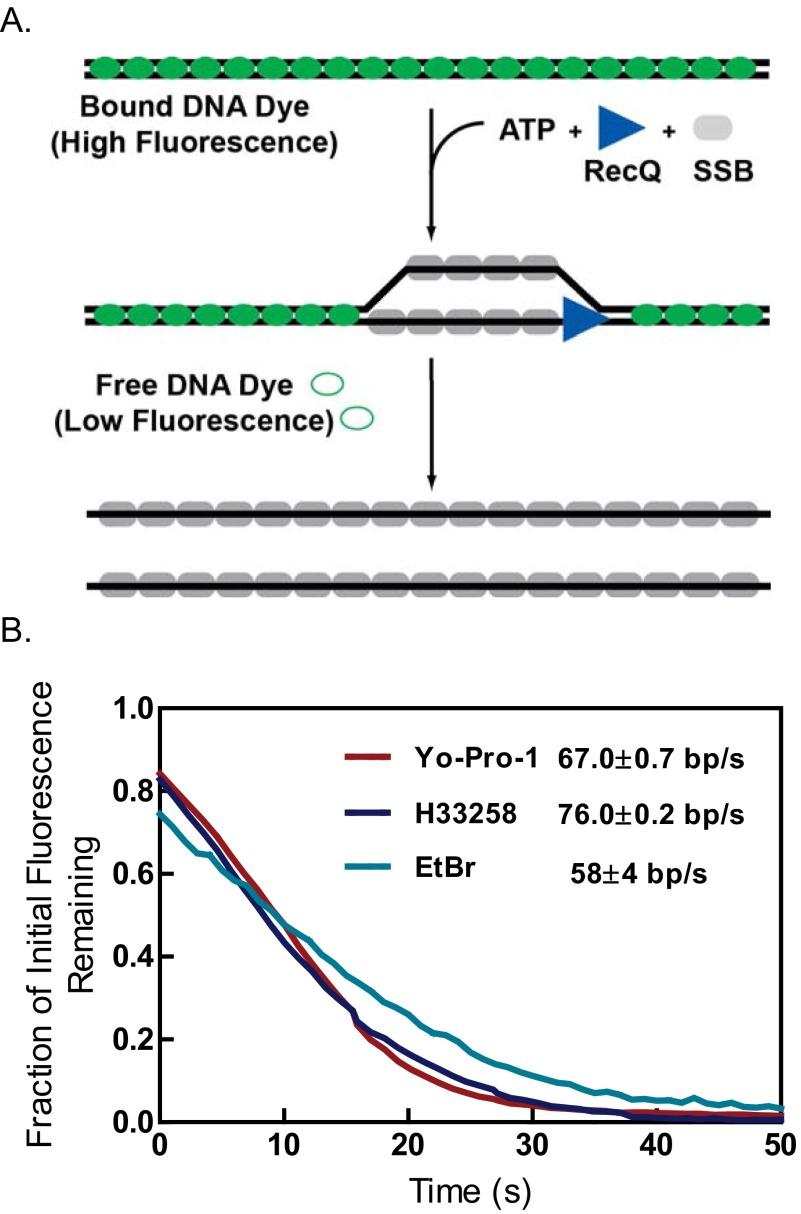
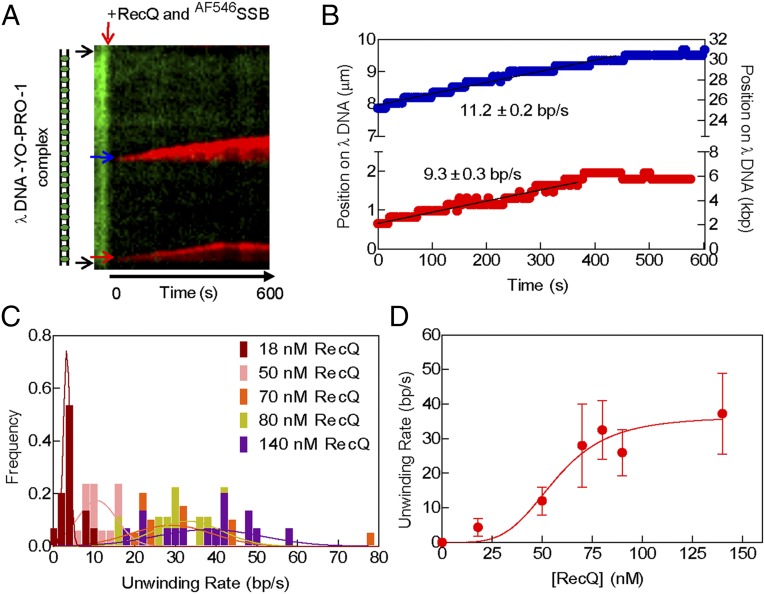
To verify that the sigmoidal dependence of unwinding fork movement on RecQ concentration was not dependent on the fluorescent SSB and reaction conditions used, a different fluorophore was substituted and reaction conditions were changed to higher ATP and Mg2+ ion concentrations (but keeping their ratio the same to maintain comparable free Mg2+ ion concentrations) (16). We used AF546SSB, which possesses a fluorescent dye with spectral properties different from YO-PRO-1–stained dsDNA, and which afforded the potential advantage of observing DNA unwinding without needing to wash out the fluorescent DNA-binding dye. To ascertain whether the YO-PRO-1 interferes with RecQ helicase activity, we used an ensemble dye-displacement assay for DNA unwinding (42). RecQ unwinds DNA stained with YO-PRO-1 at 90% of the rate observed with Hoechst 33258, a DNA-binding dye that does not interfere with RecQ unwinding activity (16), and it unwinds DNA stained with ethidium bromide at ∼76% of that rate (Fig. S6). The use of YO-PRO-1 in conjunction with AF546SSB permitted generation of two-color images of DNA unwinding by RecQ (Fig. 3A). The kymograph shows fluorescent dsDNA at the outset, but the fluorescence from YO-PRO-1 is reduced upon introduction of AF546SSB soon after the reactants enter the flowcell (Movie S4). At this lower concentration of RecQ (50 nM), two well separated unwinding forks move with a linear velocity (Fig. 3B, black lines). The unwinding velocities of the forks (n = 17) showed a broad distribution of rates that were randomly distributed (Fig. 3C and Fig. S5B), and the mean rates increased with RecQ concentration (compare Figs. 2C and 3C). As with AF488SSB, the average rates of DNA unwinding increased in a sigmoid fashion with RecQ concentration (Fig. 3D). Fitting the AF546SSB data to the Hill equation yields parameters of Vmax = 36 ± 5 bp/s, a Hill coefficient of 4 ± 2, and an S0.5 = 57 ± 7 nM RecQ, which are in good agreement with those obtained using AF488SSB (Fig. 2). Again, the value for the Hill coefficient suggests that multiple RecQ monomers cooperate during unwinding.
Fig. S6.
DNA unwinding by RecQ is not substantially affected by YO-PRO-1. (A) Illustration of the dye-displacement helicase assay. This assay uses the change in fluorescence of a DNA-binding dye to measure DNA unwinding (16, 42). For certain DNA-binding dyes, the quantum yield of the dye increases upon binding to dsDNA, resulting in higher fluorescence relative to free dye in solution or to dye bound to ssDNA. Upon unwinding dsDNA to ssDNA, the dye is displaced, resulting in a decrease in fluorescence. (B) Traces from the dye-displacement assay measuring RecQ (100 nM) mediated unwinding of plasmid DNA (1 µM, in base pairs) as a function of time. Red, blue, and green traces depict displacement of YO-PRO-1, H33258, and ethidium bromide (EtBr), respectively. The unwinding rates reported are from the steady-state linear phase.
Fig. 3.
Real-time imaging of both dsDNA and the ssDNA produced by RecQ. (A) Kymograph of a DNA molecule (15.1 µm) being unwound by RecQ (50 nM), in the presence of YO-PRO-1 (100 nM) and AF546SSB (60 nM); unwinding forks are indicated by blue and red arrows. (B) The positions of two unwinding forks (blue and red arrows in A) along the DNA molecule are plotted versus time. (C) Histogram of unwinding rates at various RecQ concentrations and fits to a Gaussian distribution (curves). (D) The mean rates of unwinding plotted as function of RecQ concentration. The data (n = 15–20 forks at each concentration, except 9 and 6 at 80 and 90 nM, respectively) were fit to the Hill equation (red curve) with parameters: Vmax = 36 ± 5 bp/s, Hill coefficient (nH) = 4 ± 2, and S0.5 = 57 ± 7 nM RecQ. Error bars represent SD.
Assemblies of RecQ Are Stable and Can Processively Unwind dsDNA.
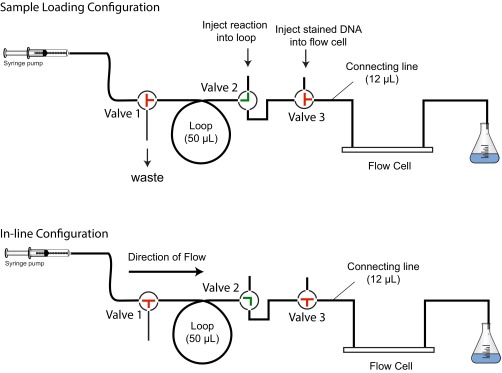
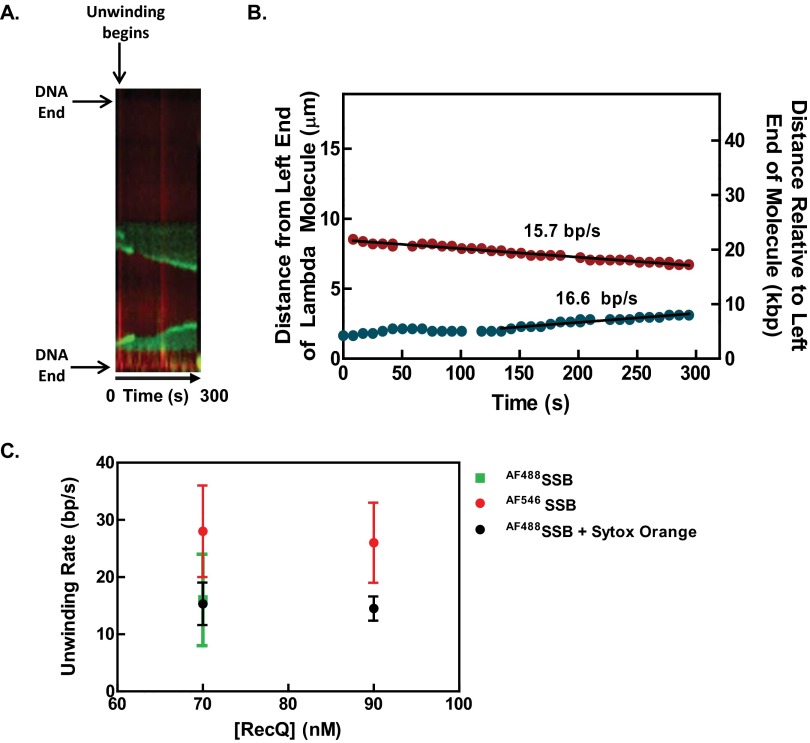
Although our data suggested that multiple RecQ monomers cooperated during unwinding, we could ascertain neither the stability nor the processivity of these complexes while free RecQ was present in the solution. Consequently, to measure these properties, we designed a single-turnover experiment wherein DNA unwinding by RecQ was initiated, and then the free RecQ was rapidly removed while maintaining the same concentration of ATP and fluorescent SSB in the solution flow. To achieve this exchange, we installed a system of valves and an in-line sample loop between the syringe pump and the flow cell, as shown and described in Fig. S7. By loading the sample loop with a solution containing RecQ that was then injected into the flow cell by the syringe pump, these modifications allowed conventional initiation of DNA unwinding; subsequently, continued flow from the pump was used to flush out the free RecQ by delivering a solution lacking RecQ but containing ATP and fluorescent SSB into the flow cell. If free RecQ was essential for ongoing unwinding, then the actively engaged unwinding forks should stop once the RecQ has been removed from the flow cell; if the active forms of RecQ were stable and capable of processive unwinding, then they should continue for some distance after removal of the free RecQ. For these experiments, Sytox Orange was used when we discovered that it had superior fluorescent properties: DNA stained with Sytox Orange produced a high signal and did not inhibit the rate of unwinding as observed in single-molecule experiments (Fig. S8). In addition, this dye also permitted two-color imaging of DNA unwinding by RecQ when used with AF488SSB (Movie S5). Furthermore, the use of this injection loop system permitted a facile demonstration that individual forks that had stopped unwinding by RecQ depletion could be reinitiated by reintroduction of free RecQ (Movie S5).
Fig. S7.
A microfluidic injection system to rapidly exchange components in a single-channel TIRF flow cell. A schematic of the system of PEEK tubing connected by PEEK switching valves that was used to remove free RecQ from the flow channel is shown. This system is connected upstream of the flow cell and downstream of the syringe pump. In this system PEEK tubing connects two 3-port “T” valves (valve 1 and valve 3), a 3-port “90°” valve (valve 2), and a 50-µL loop. The syringe is initially filled with SM buffer with 75 nM Sytox Orange. Using the sample loading configuration (Top), DNA stained with Sytox Orange is injected into the flow cell with valve 3 in the indicated position, allowing DNA to attach to the surface of the flow cell. The system is then set to the in-line configuration (Bottom), and the syringe pump is turned on. The resulting flow of SM buffer into the flow cell extends the attached DNA and allows attachment of the other end. After locating doubly tethered DNA, the system is put back into the sample loading configuration. A reaction solution containing RecQ, ATP, Sytox Orange, and AF488SSB is injected into the 50-µL loop, whereas the syringe is filled with a solution of ATP, Sytox Orange, and AF488SSB that lacks RecQ. The valves are set to the in line configuration and the syringe pump is turned on to push the 50-µL reaction solution within the loop into the flow cell to initiate unwinding by RecQ. Another 50 µL of the solution lacking free RecQ flushes the flow cell, thereby removing free RecQ protein.
Fig. S8.
Sytox Orange can be used to track dsDNA during unwinding. (A) Kymograph of a DNA molecule stained with Sytox Orange while being unwound by RecQ (90 nM) in the presence of AF488SSB. (B) The unwinding rate was measured by tracking the fluorescence of AF488SSB and fitting the linear portion of the traces. (C) The rates of the unwinding forks in the presence of Sytox Orange are within the range of rates measured using AF488SSB or AF546SSB.
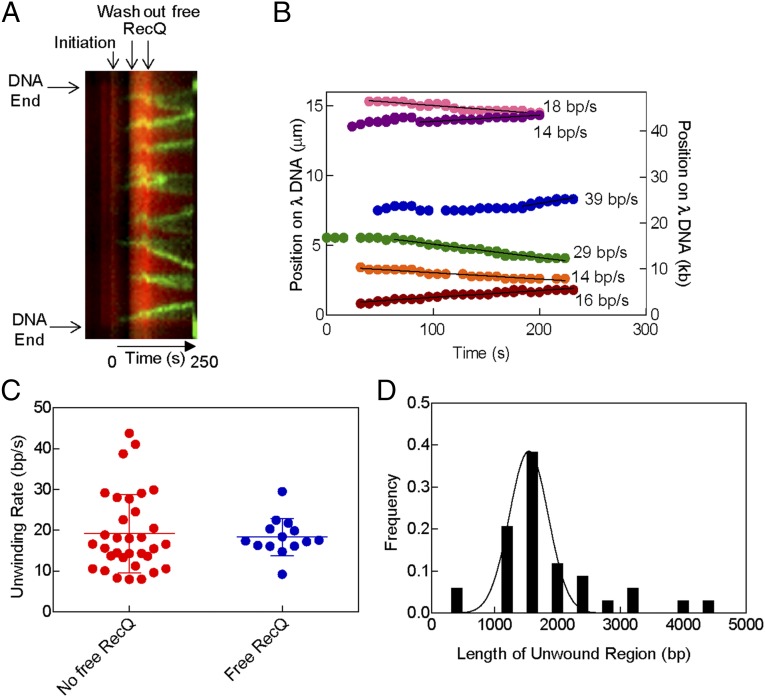
To determine whether unwinding by RecQ was processive, the free RecQ was washed out of an ongoing reaction. Movie S6 shows a molecule of λ DNA stained with Sytox Orange being unwound by RecQ in the presence of AF488SSB; the free RecQ was then removed, starting at time 1:03 (min:sec) and ending at ∼1:27 into the movie (an increase in fluorescence is observed during this wash period because fresh (unbleached) Sytox Orange is added as part of the washing buffer). Fig. 4A shows a kymograph of the DNA molecule from Movie S6 and it indicates the time interval during which the free RecQ was removed from the flow cell. Unexpectedly, despite their apparently variable and dynamic composition, we observed that after removing free RecQ protein, the unwinding forks continued to unwind at a constant rate for at least 1–2 kbp, until the molecule broke (Fig. 4B). The rates of DNA unwinding for 33 forks measured in the absence of free RecQ (19 ± 10 bp/s) were comparable to the rates of unwinding in the presence of free RecQ (18 ± 5 bp/s; 13 forks) at the same concentration (Fig. 4 B and C). These data suggest that stable oligomers of RecQ form at unwinding forks and they show that these complexes can proceed for long distances before stopping. A histogram of the measured lengths of unwound ssDNA, and a fit to a Gaussian distribution (Fig. 4D) reveal that these RecQ complexes unwind an average of 1.5 ± 0.3 kbp before the molecule broke or two unwinding forks collided into one another. Collectively, these data show that RecQ rapidly produces stable oligomeric forms at unwinding forks that processively unwind for a distance of 1.5 kbp.
Fig. 4.
RecQ forms stable assemblies during unwinding. (A) Kymograph of a DNA molecule stained with Sytox Orange on which unwinding was initiated and then free RecQ was removed. The position of the DNA and select points during the reaction are shown by arrows. (B) Unwinding traces of the forks observed in A. The colored circles are the positions and the solid lines are linear fits to the data. (C) The unwinding rates for 70 nM RecQ are shown in the presence and absence of free RecQ in solution. The colored circles are the measured rates of each unwinding fork. The mean of the values is shown by horizontal lines and the SD is shown by error bars. (D) The distribution of lengths of the region unwound by each fork in the absence of free RecQ is shown. The distribution is fit to a Gaussian shown by the solid black line.
Initiation of Duplex DNA Unwinding Occurs Randomly on dsDNA and Requires a RecQ Dimer.
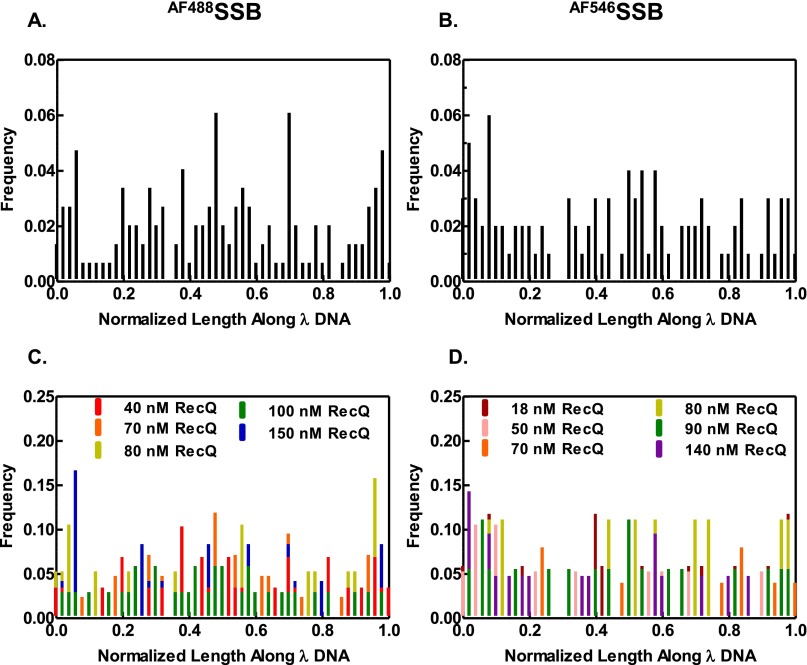
Previous unwinding experiments using covalently closed circular DNA demonstrated that RecQ does not require a DNA end to initiate unwinding (17). To verify this ensemble observation, we plotted the distribution of initiation events along λ DNA to see if RecQ showed a preference for DNA ends versus internal sites (Fig. S9). The position of each initiation event along λ DNA was normalized to the end-to-end length of each individual DNA molecule for comparison. We find that RecQ does not show a preference for DNA ends (Fig. S9 A and B). Rather, RecQ initiated randomly along the DNA molecule at all concentrations assayed (Fig. S9 C and D).
Fig. S9.
RecQ initiates unwinding randomly along dsDNA. (A) Cumulative distribution of the unwinding initiation positions along λ DNA plotted as a histogram for experiments using AF488SSB (n = 148) and (B) AF546SSB (n = 109). The position of each event was measured relative to one end of the DNA and was normalized to the end-to-end length of each molecule for comparison between molecules. (C) Distribution in A shown for each RecQ concentration (40 nM RecQ, n = 29; 70 nM RecQ, n = 42; 80 nM RecQ, n = 19; 100 nM RecQ, n = 34; and 150 nM RecQ, n = 24). (D) Distribution in B shown for each RecQ concentration (18 nM RecQ, n = 17; 50 nM RecQ, n = 19; 70 nM RecQ, n = 25; 80 nM RecQ, n = 9; 90 nM RecQ, n = 18; and 140 nM, n = 21).
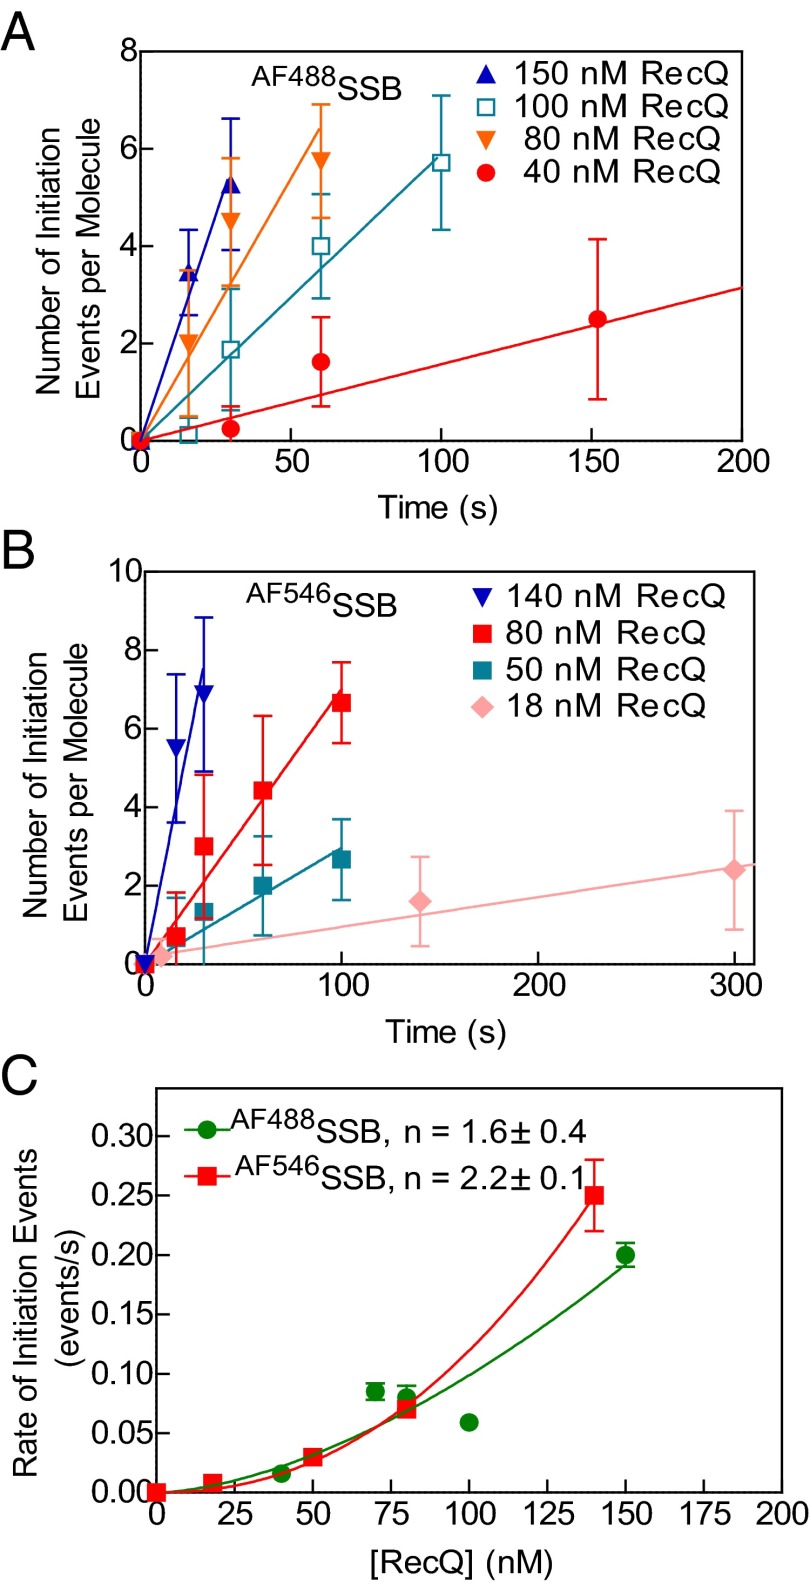
For those events occurring at internal sites, DNA unwinding must involve de novo opening of duplex DNA. To investigate the mechanism of initiation by RecQ, we measured the number of initiation events on each molecule of DNA as a function of time and RecQ concentration [Fig. 5A (AF488SSB) and B (AF546SSB)]. In each case, at early times, the number of unwinding initiation sites increased linearly with time, defining a rate of initiation. When plotted as a function of RecQ concentration, the rate of initiation per DNA molecule increased nonlinearly with RecQ concentration (Fig. 5C). These data could be fit to a power function, kobs = c[RecQ]n, where kobs is the observed rate of initiation, c is a constant, and n is the number of cooperating RecQ proteins (Fig. 5C). The values of the exponent, n, are 1.6 ± 0.4 and 2.2 ± 0.1 for experiments using AF488SSB and AF546SSB, respectively. In the case of self-assembling systems, the power dependence of a rate-limiting initiation step defines the number of monomers required for the initiation event (43–45). Our analysis implies that two monomers of RecQ are required to initiate unwinding from an internal site on dsDNA.
Fig. 5.
The frequency of unwinding initiation by RecQ increases with higher protein concentration. The number of initiation events per molecule versus time monitored by AF488SSB (A) or AF546SSB (B). The initial linear segments were fit to a line to obtain a rate of initiation (n = 7–13 DNA molecules at each concentration for AF488SSB and 5–18 for AF546SSB). (C) Rate of initiation from experiments using AF488SSB (green circles) or AF546SSB (red squares). Data were fit to kobs = c[RecQ]n; values for n are 1.6 ± 0.4 and 2.2 ± 0.1 for AF488SSB (green curve) and AF546SSB (red curve), respectively. Error bars represent SD.
RecQ Melts dsDNA Locally to Initiate Unwinding.
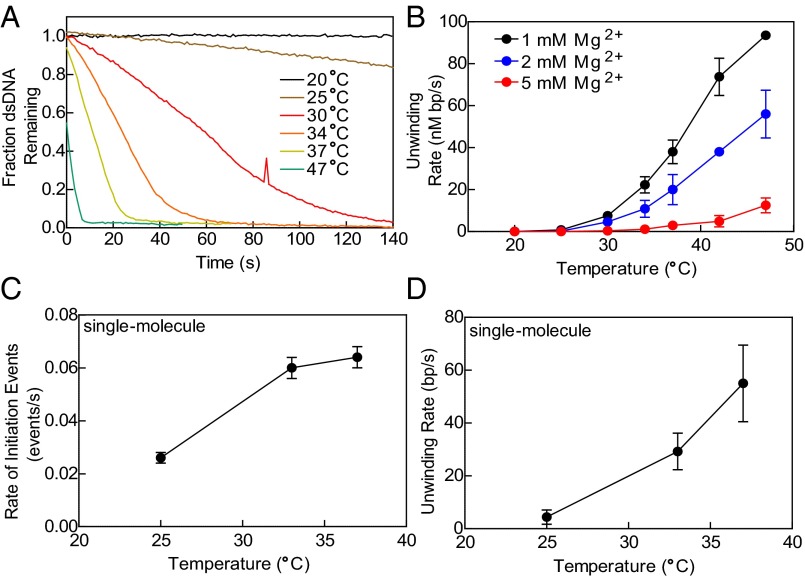
To further test the hypothesis that RecQ initiates DNA unwinding by melting into duplex DNA at internal sites, we examined the rate of helicase activity under conditions that affect DNA stability. We first measured the rate of DNA unwinding as a function of temperature (Fig. 6A) using the ensemble assay (Fig. S6) (16, 42). At the lowest temperature tested (20 °C), we did not observe any unwinding (Fig. 6A, black trace). An increase of temperature from 25 °C to 47 °C increased the rate of DNA unwinding (Fig. 6A). The steady-state rate for each unwinding reaction was plotted as a function of the temperature (Fig. 6B, black circles) and shows a 100-fold increase from 25 °C to 47 °C. Although the rate of all enzymatic reactions increases with temperature, we examined further whether the helicase activity of RecQ was adversely affected by conditions that stabilize dsDNA. Consequently, we increased the Mg(OAc)2 concentration to 2 mM, which will increase the melting temperature of the DNA duplex and should slow initiation by RecQ. As expected, the rate of unwinding by RecQ decreased at all temperatures when the concentration of Mg(OAc)2 was doubled (Fig. 6B, blue circles). When the concentration of Mg(OAc)2 was further increased to 5 mM (Fig. 6B, red circles), RecQ showed little or no unwinding at temperatures below 37 °C and substantially reduced rates at the higher temperatures. These observations explain the inhibitory effect of excess Mg2+ ion on RecQ seen previously (10, 16). The temperature dependence of the unwinding rate at 2 mM Mg(OAc)2 shows a profile similar to the experiments at 1 mM Mg(OAc)2, but it is offset to higher temperatures. This is a classical hallmark of a transition that depends on DNA duplex opening (46), consistent with our proposal that RecQ initiates unwinding by melting internal pairing of dsDNA.
Fig. 6.
Both the frequency of initiation and rate of DNA unwinding by RecQ increase with decreased dsDNA stability. (A) Helicase activity of RecQ (100 nM) as a function of temperature (20 °C to 47 °C) as measured by the dye-displacement assay (see Fig. S6 and SI Materials and Methods). (B) Steady-state ensemble rate of unwinding as function of temperature at: 1 mM (black circles), 2 mM (blue circles), and 5 mM (red circles) Mg(OAc)2. Single-molecule experiments: (C) rate of initiation and (D) rate of unwinding as function of temperature for RecQ (40 nM), with AF488SSB (60 nM); n = 5–14 forks at each temperature. Error bars represent SD.
To further analyze the molecular basis of this effect of temperature on the helicase activity, we examined dsDNA unwinding using the single-molecule assay at increasing temperatures (Movie S3). As the temperature was increased from 25 °C to 37 °C, there was an increase in the number of initiation events per molecule (Fig. 6C); due to limitations of the instrument, it was not possible to examine higher temperatures. The increase in the number of initiation events with temperature indicates that RecQ can initiate unwinding, i.e., nucleate, more easily when the stability of dsDNA is lower and the rate of base pair opening is greater. Not unexpectedly, the unwinding rate measured for individual forks also increased (Fig. 6D). In the ensemble experiments, the rate increased by ∼50-fold from 25 °C to 37 °C (at 1 mM Mg2+) but it was not possible to parse the contributions into effects on initiation versus elongation. However, our single-molecule measurements separate the contributions into a ∼11-fold increase in the mean rate of individual forks movement and a ∼4-fold increase in the initiation frequency.
Discussion
The helicase activity of RecQ is distinctive in that it requires neither a DNA end nor ssDNA to initiate unwinding. Ensemble assays, therefore, do not afford transparent analysis of this important DNA helicase. In this study, we developed a single-molecule methodology that enabled us to visualize and characterize the unwinding of single molecules of DNA by RecQ using fluorescent SSB to track the production of ssDNA. We directly visualized the movement of unwinding forks by RecQ and were able to parse out and measure both the frequencies of initiation and the rates of individual fork unwinding, which is not possible with ensemble fluorescence measurements. We observed that the number of initiation events increased with the second power of RecQ concentration, suggesting nucleation by a dimer of RecQ as a rate-limiting step in DNA unwinding. The number of initiation events per DNA molecule, as well as the rate of fork unwinding, increased with temperature and decreased with the free Mg2+ concentration, consistent with the proposal that RecQ binds to and melts dsDNA to initiate unwinding de novo, without the need for preexisting ssDNA. Unexpectedly, the observed rate of any single unwinding fork was strongly dependent on RecQ concentration, which indicated that the individual unwinding event was being driven by a complex of RecQ at higher concentrations. Had the unwinding species been either single or multiple kinetically stable assemblies of RecQ monomers, then the unwinding rates would comprise either single- or multiple-Gaussian distributions of fixed mean velocity, and each would change in amplitude with changing RecQ concentration rather than change the mean velocity. Instead, our results suggest a concentration-dependent formation of an assembly with four (or more) monomers at saturation that can processively unwind several kilobase pairs of DNA.
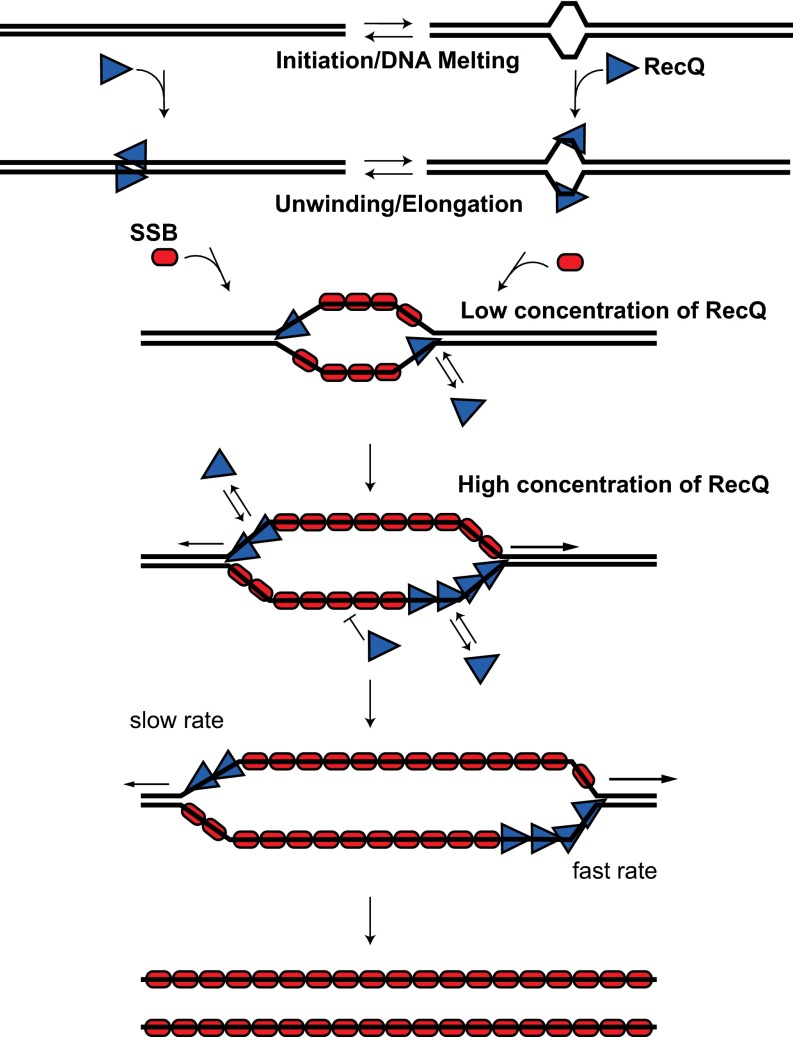
Based on the single-molecule and ensemble unwinding data, we propose a model for the mechanism of RecQ helicase action in Fig. 7. In the first step, two RecQ monomers in concert initiate DNA unwinding by locally melting several internal base pairs of dsDNA. The exact kinetic pathway for initiation could involve either of two nonexclusive alternatives. In one, the monomers of RecQ can bind to DNA that has momentarily melted via thermal “breathing” to open a few base pairs (46), to trap the transiently formed ssDNA (Fig. 7, right side). Alternatively, because RecQ can bind dsDNA, albeit with lower affinity than ssDNA (7), two RecQ monomers might bind dsDNA, and induce an open melted conformation of the DNA. The energetic aspects of this model are supported by a recent crystal structure of Cronobacter sakazakii RecQ (CsRecQ), which is 86% identical to E. coli RecQ (18). In a cocomplex with DNA, CsRecQ is observed to separate 2 bp of DNA at the ssDNA/dsDNA junction in the absence of ATP, showing that the binding energy of one RecQ monomer is sufficient to melt dsDNA. Thus, the size of the region opened by RecQ to initiate unwinding likely is small, and excludes the possibility of SSB binding cooperatively. We had estimated a site size for RecQ of only 6 nt (16), and the structural work shows less than 10 nt. Furthermore, we recently have shown that initiation of unwinding on fully duplex DNA is not stimulated by SSB (10). Moreover, a DNA-dependent dimer of RecQ was identified that was essential in stabilizing CsRecQ for crystallization. Consequently, we conclude that one molecule of RecQ may be marginally sufficient energetically for initiation, but our nucleation data indicate that two molecules of RecQ are optimal for initiation; two molecules of RecQ are likely to be more efficient in stabilizing the denatured conformation of dsDNA, because the energetic cost of opening several base pairs of DNA by a RecQ monomer on one strand is offset by the binding of a second RecQ monomer to the other strand. Initiation by dimers also rationalizes the observation that about one-quarter of the initiation events are bidirectional; it remains unknown whether the unidirectional forks are from initiation by monomers or from bidirectional nucleation events where one of the forks either failed to propagate or dissociated because it encounter a nick on the translocating strand.
Fig. 7.
An oligomer of RecQ processively unwinds dsDNA. At the initiation step, RecQ monomers (blue triangles) bind to dsDNA as a dimer, melt several base pairs of DNA to expose ssDNA, and initiate unwinding. Alternatively, the dsDNA may transiently breathe, allowing two RecQ monomers to bind ssDNA and trap the open conformation. During the elongation step, the lead protomer unwinds in the 3′ → 5′ direction. At low concentrations, the unwinding forks can be slowly propagated by a RecQ monomer; at high concentrations, RecQ monomers form an assembly of minimally four subunits that enhances the rate of unwinding. SSB (red ovals) binds to the displaced ssDNA preventing formation of nonproductive RecQ–ssDNA complexes as well as reannealing of the ssDNA products.
This model, wherein initiation of unwinding occurs via nucleation of a RecQ–ssDNA complex by local denaturation of dsDNA, is consistent with other observations. For example, we observed an increase in the number of initiation events per DNA molecule as the temperature was increased in the single-molecule assays, supporting our hypothesis that RecQ binds to melted dsDNA. In the ensemble assays, not only does increasing the temperature increase the rate of unwinding, but also increasing the free Mg2+ ion concentration, a variable known to stabilize dsDNA base pairing, substantially decreases the rate (10, 16). Our single-molecule measurements permit separation of nucleation from elongation and reveal that both nucleation and unwinding rate are affected by a parameter that alters DNA stability, namely temperature. The dependence of RecQ activity on DNA stability is characteristic of DNA “melting” proteins (46, 47). DNA binding proteins that bind ssDNA with greater affinity than dsDNA, such as bacteriophage T4 gene 32 protein, are defined as melting proteins because they shift the melting temperature (i.e., equilibrium) of duplex DNA to lower temperature (46, 47). Similar to such DNA binding proteins, RecQ binds ssDNA with a 10-fold greater affinity than dsDNA (16). Moreover, a dimer of human RecQ1 is thought to stabilize the protein–DNA complex and result in increased efficiency of helicase activity (48). Collectively, these observations support the idea that RecQ destabilizes the DNA duplex to initiate unwinding.
During the elongation stage of the helicase mechanism, we propose that an average of four or more monomers of RecQ assemble to unwind dsDNA (Fig. 6, fast unwinding). But rather than suggesting that a discrete multimeric form of RecQ (e.g., tetramer or hexamer) is responsible for elongation of unwinding, we propose a model wherein a variable number of monomers assemble at the nascent DNA fork during the initiation step to form random multimeric states with unique unwinding rates that increase with assembly state. Elongation of this array of RecQ monomers is biased for several reasons: (i) RecQ binds most tightly to structures comprising 3′ ssDNA-tailed duplexes and ssDNA-forked duplexes (7, 49); (ii) RecQ unwinds the forked dsDNA structure with highest activity (7, 49), resulting in net advancement; and (iii) monomers behind the lead helicase can rapidly translocate independently in the 3′→ 5′ direction (21, 22), because no DNA unwinding is necessary. Based on ensemble data, related models were proposed for the bacteriophage T4 Dda, hepatitis C virus NS3 helicases (NS3h) and RecQ (27, 50, 51). In the case of RecQ, three to six monomers could functionally interact to unwind DNA with ssDNA extensions (27). Similar to RecQ, even though monomers of Dda and NS3h can unwind appropriate dsDNA substrates, linear arrays of several monomers of Dda and NS3h are inferred to cooperate to enhance the rate and effectiveness of DNA unwinding. For these two helicases, the oligomeric species is not a stable entity (52, 53). In fact, for Dda, the observed Hill parameter, n, for DNA unwinding is ∼6, and biochemical analyses suggest that number of “cooperating monomers” can be as large as approximately seven to eight monomers (50). The Hill coefficient for unwinding from our single-molecule analysis suggests that this multimer is four or more monomers; however, because the unwinding rates are so broadly distributed in a Gaussian manner at any one RecQ concentration, this assembly can clearly be smaller (e.g., a monomer) or larger. For both Dda and NS3h, as for RecQ, the observed rate of DNA unwinding increases progressively as more monomers are accommodated in the assembly at the fork, up to a limiting value for each helicase (50, 51).
Previous biochemical evidence is also consistent with our model that multiple RecQ proteins cooperate at the unwinding fork. RecQ binds DNA with Hill coefficients that vary between 1 and 2, depending on the number and length of ssDNA tails attached to the duplex DNA, indicating that a dimer is formed upon binding to DNA (27). Additionally, RecQ binds ssDNA in a cooperative fashion (ω = 25), establishing that the monomers interact with a 25-fold higher affinity to each other when bound to DNA (54), and minimizing (by a factor of 25-fold) the probability of dissociation by an internal RecQ monomer from the assembly, relative to one dissociating at an end of the protein cluster (55). Moreover, the value of 4 for the Hill coefficient from single-molecule elongation assays is in agreement with the Hill coefficients measured from ensemble assays of both helicase activity (16, 27) and ATP hydrolysis activity (i.e., inferred translocation) on ssDNA (21, 22). Similarly, presteady-state translocation experiments suggest that at least three monomers of RecQ are needed for translocation on ssDNA (21, 22). Thus, in ensemble and single-molecule experiments, three to four RecQ monomers comprise the average size for the dynamic, functional unit in ATP hydrolysis, ssDNA translocation, and DNA unwinding.
SSB functions in the advancement of the unwinding fork by RecQ. In ensemble unwinding experiments, excess ssDNA inhibits the activity of RecQ, but SSB alleviates this inhibition by sequestering ssDNA and preventing the formation of nonproductive complexes of RecQ–ssDNA (16). Thus, not only is forked duplex DNA the preferred substrate for RecQ binding (7), but also because SSB blocks binding to the increasing amount of ssDNA formed, RecQ is consequently directed toward the unwinding fork in the presence of SSB, which blocks binding to the competitive ssDNA product.
The mechanism wherein RecQ initiates DNA unwinding by melting duplex DNA at internal sites to create the ssDNA needed for translocation is unique among helicases in that neither accessory factors nor a specific DNA sequence is required. During replication initiation, where DNA melting at the origin is required and is followed by unwinding, multiple proteins are involved. In E. coli, DnaA binds to the origin of replication, melts dsDNA to reveal ssDNA, and then recruits the replicative helicase, DnaB, onto both strands to initiate directional unwinding and replication (56). Similarly, in archaea and eukaryotes, the initiation protein, Orc1, is thought to bind to duplex DNA unwinding elements, melt the dsDNA, and load the replicative helicase through the recruitment of additional factors (57, 58). Crystal structures of Orc1 complexed with dsDNA suggest that a dimer binds dsDNA through the winged-helix domain of the protein in an ATP-dependent fashion; this complex distorts DNA base pairing, which facilitates the recruitment and loading of the MCM complex (57). Unlike DnaB, which requires accessory factors, the simian virus 40 (SV40) and T4 phage Dda helicase can initiate DNA unwinding from an origin sequence (59–62). Specifically, SV40 has been shown to initiate unwinding and proceed bidirectionally to unwind plasmid length DNA (59). Unlike helicases in replication, RecQ requires neither initiation factors nor a specific sequence to melt DNA. Similar to Orc1, however, RecQ has a winged-helix domain that is thought to recognize specific DNA structures (18, 63). Because we observe a dimer of RecQ initiating unwinding, it is possible that, again similar to Orc1, the winged-helix domain of two monomers of RecQ may bind to and distort dsDNA to initiate unwinding.
The mechanism of DNA unwinding might be conserved among the eukaryotic RecQ-like helicases. Several eukaryotic homologs of RecQ, e.g., S. cerevisiae Sgs1 and human BLM, are similar with regard to their helicase activity as well as their cellular functions. Both eukaryotic helicases, in combination with nucleases, DNA2 and EXO1, process dsDNA ends to create 3′-terminated ssDNA for the repair of double-strand breaks, similar to roles of RecQ and RecJ in E. coli (9, 24, 25, 64, 65). Both Sgs1 and BLM also function with a type 1 topoisomerase (Top3 and TOPIIIα, respectively) to dissolve double Holliday junctions (66, 67). Biochemically, BLM and Sgs1 unwind a myriad of DNA substrates, and Sgs1 can also unwind covalently closed dsDNA. In particular, unwinding of blunt dsDNA by Sgs1 and BLM shows a high sensitivity to the concentration of Mg2+ ion, whereas unwinding of a forked structure does not (24, 68). This dependence implies that under conditions of higher DNA stability, the eukaryotic RecQ helicases are unable to initiate dsDNA unwinding for the same reasons that RecQ is limited. The similarity of RecQ to BLM and Sgs1 suggests elements in common reflect conserved features of the DNA unwinding mechanism proposed here. We anticipate that our findings will inform and facilitate future analyses of other RecQ homologs. An investigation of the mechanism of DNA unwinding and function by Sgs1 and BLM at the single-molecule level is now possible.
Materials and Methods
Single-Molecule DNA Unwinding Experiments.
Unless stated otherwise, solutions were made using single-molecule (SM) buffer [20 mM TrisOAc (pH 7.5), 20% (wt/vol) sucrose, and 50 mM DTT]. Bacteriophage λ DNA (2 pM molecules), biotinylated at each end, was flowed into the cell and incubated for 2 min to allow the biotin group on one end to bind to streptavidin–BSA on the surface. Afterward, flow was applied to extend and tether the other end of the DNA to the surface. The doubly attached DNA molecules were identified by staining with 100 nM YO-PRO-1 (Molecular Probes). The DNA molecules were destained (SM buffer + 200 mM NaCl), followed by equilibration in SM buffer. The reaction was initiated by filling the channel with a mixture containing the indicated concentration of RecQ, 60 nM (monomer) AF488SSB, 1 mM ATP, and 1 mM Mg(OAc)2 at a flow rate of 8,000 μL/h. For experiments using AF546SSB (60 nM monomer), 3 mM ATP and 3 mM Mg(OAc)2 were used, and YO-PRO-1 (100 nM) was included in the reaction solution. The point at which the channel was filled with the reaction and the flow stopped was designated as the starting time; the dead time was ∼30-s. Reactions were maintained at 25 ± 1 °C, unless noted (37, 38).
Experiments that removed free RecQ from the flow cell used the microfluidic injection system shown in Fig. S7. The system was first set to the “sample loading” configuration, which allowed λ DNA in SM buffer and stained with 75 nM Sytox Orange to be injected into the flow cell, permitting attachment of one end of the DNA to the surface. The system was then set into the “in-line” configuration and a solution of SM buffer containing 75 nM Sytox Orange was pumped into the flow cell, extending the DNA and permitting attachment of the other end of DNA to the surface. After several DNA molecules were located, the system was set back to the sample loading configuration, a syringe with 1 mL of a solution containing 75 nM Sytox Orange, 60 nM (monomer) AF488SSB, 1 mM ATP, and 1 mM Mg(OAc)2 in SM buffer was loaded into the syringe pump, and the loop was filled with a solution containing RecQ at the indicated concentration, 75 nM Sytox Orange, 60 nM (monomer) AF488SSB, 1 mM ATP, and 1 mM Mg(OAc)2 in SM buffer. (Fig. S7). The system was set back into the in-line configuration and 50 µL of solution was pumped through the system using the syringe pump, thus pushing the 50 µL of reaction solution in the loop containing RecQ into the flow cell. After initiation of unwinding was observed on the DNA molecules, the syringe pump was turned on to subsequently deliver 50 μL of the solution lacking RecQ, thereby removing free RecQ from the flow cell.
Single-Molecule Data Analysis.
Analysis was done using Andor iQ software v. 2.4. Tiff image stacks from each experiment were processed using the lumped average algorithm, which averaged every four frames. To convert positional information into rates of unwinding, a kymograph of the molecule was first created in ImageJ using a line width of 1 pixel; examples are shown in Figs. 2, 3, and 4. The kymograph was then used to track the edge of the unwinding forks. Kymographs were exported to ImageJ v. 1.44c (69), and the position of each unwinding fork, as defined by the signal from the fluorescent SSB, was tracked and marked manually using the Point Picker plug-in. Kymographs shown in the figures were scaled fourfold using bilinear interpolation in ImageJ and thus appear smoother for better image quality. The measurements in pixels were converted into distance (in nanometers) using the calibrated camera resolution (163.9 nm/pixel). The observed distances were then converted to base pairs by multiplying the distance by the ratio of the measured end-to-end distance of each individual doubly attached molecule and the size of λ DNA in base pairs (48,502). The rate of unwinding was obtained from fitting to the linear region of distance versus time trace; histograms were generated and fit to a Gaussian distribution using GraphPad Prism (v.5.0); plots of the intensity along a DNA molecule were generated in Origin v7.5. The unwinding rates are reported as the mean and SD from the indicated number of events. Initiation events were scored using Andor iQ by counting the number of fluorescent SSB foci on each DNA molecule as a function of time.
Details are in SI Materials and Methods.
SI Materials and Methods
Reagents.
The DNA binding dyes, Sytox Orange, Hoechst 33258 (H33258), and YO-PRO-1, and the labeling dyes, Alexa Fluor 546 and Alexa Fluor 488 maleimide, were purchased from Invitrogen. YO-PRO-1, Sytox Orange, and the Alexa Fluor dyes were dissolved in dimethyl sulfoxide (DMSO) and kept at −20 °C. H33258 was dissolved in Nanopure water and stored at −20 °C.
Proteins and DNA.
RecQ and SSB proteins were purified as described (7). The G26C SSB mutant was purified as described (40). The concentrations of RecQ and both wild-type and mutant SSB were determined by measuring the absorbance at 280 nm and using molar extinction coefficients of 14,800 M−1⋅cm−1 and 27,880 M−1⋅cm−1, respectively. Biotinylated BSA (Pierce) and streptavidin (Promega) were resuspended in 20 mM TrisOAc (pH 7.5) and stored at −20 °C. Phage λ DNA was purchased from New England Biolabs (NEB) and stored at 4 °C. Plasmid DNA (pUC19) was purified by alkaline lysis followed by equilibrium ultracentrifugation in a CsCl-ethidium bromide gradient (70). Purified pUC19 was linearized with HindIII (NEB). The DNA concentration was determined using a molar extinction coefficient of 6,600 M−1⋅cm−1 at 260 nm.
Labeling of the G26C SSB Mutant.
SSB with the glycine at position 26 mutated to a cysteine residue was labeled with the indicated Alexa Fluor maleimide dye as described (40). Briefly, mutant protein was dialyzed into labeling buffer [20 mM TrisOAc (pH 8.0), 0.5 M NaCl, 1 mM EDTA, and 20% (vol/vol) glycerol] to remove DTT from the storage buffer. The maleimide dye was added at a 10-fold molar excess relative to SSB monomer concentration, and the final volume of DMSO in the reaction was kept below 5% (vol/vol). Labeling was performed at 4 °C for 4 h. The reaction was then loaded onto a 20 mL, P-10 size exclusion column preequilibrated with labeling buffer (Bio-Rad). The labeled SSB, which eluted first, was collected and subsequently dialyzed into storage buffer [25 mM TrisOAc (pH 8.0), 0.5 M NaCl, 1 mM EDTA, 1 mM DTT, and 50% (vol/vol) glycerol]. Protein concentration was determined from the absorbance (A) at 280 nm after correcting for the contribution of the dye to the absorbance at 280 nm by using a correction factor (Cf) of 0.22 for both dyes as provided by the manufacturer: Aprotein = Ameasured − 0.22 × Adye@max. A molar extinction coefficient of 72,000 M−1⋅cm−1 was used for the Alexa Fluor 488 dye to determine its concentration from the absorbance at 493 nm. A molar extinction coefficient of 112,000 M−1⋅cm−1 was used for the Alexa Fluor 546 dye to determine its concentration from the absorbance at 556 nm. For both labeled SSB preparations, the degree of labeling indicated that one monomer of SSB was labeled with one dye molecule.
Dye-Displacement Helicase Assays.
Ensemble helicase activity was measured using dye-displacement assays as previously described (16, 42), in a reaction solution containing 25 mM TrisOAc (pH 7.5), 1 mM Mg(OAc)2, 1 mM ATP, 1 mM DTT, 1 mM phosphoenol pyruvate (PEP), dye, and 25 units/mL pyruvate kinase unless noted. Spectra were collected on a SLM fluorimeter controlled by Vinci Software (ISS). Slit widths were set to 8 mm for both excitation and emission. The reaction solution (350 µL) was added to a quartz cuvette (700 µL total volume; Starna Cells), and wild-type SSB was added at a final concentration of 1 μM of tetramer. Reactions were performed at 37 °C. Hoechst 33258 (300 nM) was excited at 355 nm and emission was monitored at 465 nm. To measure the displacement of YO-PRO-1 (50 nM), the solution was excited at 490 nm and emission was monitored at 520 nm; for ethidium bromide (1 µM), excitation was at 546 nm and emission was monitored at 595 nm. The fluorescence of free dye was observed before dsDNA was added at a final concentration of 1.0 µM (base pairs). The fluorescence of DNA-bound dye was then observed and recorded, followed by addition of RecQ (100 nM) to initiate the reaction unless noted. Helicase rates were determined as described (16). Briefly, the slope of the steady-state, linear portion of the unwinding curve was measured and divided by the difference in free and bound dye fluorescence (ΔFmax) and then multiplied by the total DNA concentration. The extent of unwinding was determined by taking the fluorescence end point of the reaction, subtracting from the DNA-bound fluorescence, and dividing by the difference of the bound and free dye fluorescence. This fraction was assumed to reflect the total amount of DNA unwound because the fluorescence of the free dye is equal to that of Hoechst 33258 (H33258) or YO-PRO-1 in the presence of SSB-bound ssDNA.
Flow Cell Construction and Surface Modification of Glass Coverslips.
Glass coverslips were cleaned by submerging them in a solution of 95% ethanol, saturated with KOH, for 1 h, followed by sequential rinsing with Nanopure water and methanol. Channels and holes were etched into glass slides using a 30-W Epilog mini laser engraver (37, 38, 71). A coverslip spanning the etched surface on the glass was glued on using UV Optical adhesive no. 74 (Norland Products). The glue was cured by placing the flow cell a distance of 30 cm from a 100-Watt high-pressure mercury plasma arc-discharge lamp (Zeiss 100 W HBO lamp) for 20 min. Each flow channel measured 3 × 13 mm in width and length, respectively, and 100 µm deep. PEEK tubing with a 0.5-mm inner diameter (Upchurch Scientific) was attached to each of the etched holes using a 5-min epoxy (Devcon) to create ports. Before use, each channel was cleaned with 1 M NaOH for 30 min, rinsed with water, and finally filled with SM buffer, which consisted of 20 mM TrisOAc (pH 7.5), 20% (wt/vol) sucrose, and 50 mM DTT. Next, a solution of 1 mg/mL biotin–BSA in SM buffer was flowed in and incubated in each channel for 10 min at room temperature. Free biotin–BSA was washed with SM buffer, and then the channel was filled with 0.1 mg/mL streptavidin in SM buffer and incubated for 10 min at room temperature. Free streptavidin was removed by rinsing the flow cells with SM buffer. The flow cell was then filled with a solution of 1 mg/mL Roche Blocking Reagent in SM buffer. The flow cell was connected to a syringe pump and washed with SM buffer before conducting the helicase reactions.
Incorporating Biotin Groups into λ Phage DNA.
The cos sites of λ phage DNA were filled in using a reaction (30 µL) containing 5 units Klenow fragment (3′ → 5′ exo−; NEB), λ phage DNA (80 ng/µL), and 33 µM each of dATP, dCTP, dTTP, and 33 µM biotin-11-dGTP (Perkin-Elmer) (38, 71). The reaction solution was incubated at 37 °C for 15 min before EDTA was added at a final concentration of 10 mM to stop the reaction. The polymerase was inactivated by incubation at 75 °C for 20 min. The reaction was diluted to a final volume of 100 µL by adding Nanopure water. Free nucleotides were removed from the solution using a MicroSpin S-200 HR column (GE Healthcare), equilibrated in buffer containing 10 mM Tris HCl (pH 8.0), and 1 mM EDTA. The DNA concentration was determined by measuring the absorbance at 260 nm using a molar extinction coefficient of 6,600 M−1⋅cm−1 (70).
Single-Molecule TIRF Measurements.
Unwinding of λ DNA molecules was observed on an Eclipse TE2000-U inverted microscope with a TIRF attachment (Nikon), using a CFI Plan Apo TIRF 100×, 1.49 N.A., oil-immersion objective (37). Excitation was by 488-nm (Picarro) or 561-nm (Cobolt) lasers. Fluorescence emission was detected and separated into 515 nm (30-nm bandpass) and 600 nm (40-nm bandpass) components (Optical Insights), imaged on an iXon CCD camera (Andor), and processed using Andor imaging software. Images were collected by averaging four 50-ms exposures, every 2 s.
Supplementary Material
Acknowledgments
We thank Kevin Raney for helpful discussions and members of the S.C.K. laboratory for useful comments. This work was supported by NIH Grants GM41347 and GM64745 (to S.C.K.); B.R. was supported in part by NIH Training Grant T32-GM007377; A.L.F. was funded by an American Cancer Society Postdoctoral Fellowship PF-08–046–01-GMC.
Footnotes
The authors declare no conflict of interest.
See Commentary on page 15263.
This article contains supporting information online at www.pnas.org/lookup/suppl/doi:10.1073/pnas.1518028112/-/DCSupplemental.
References
- 1.Singleton MR, Dillingham MS, Wigley DB. Structure and mechanism of helicases and nucleic acid translocases. Annu Rev Biochem. 2007;76:23–50. doi: 10.1146/annurev.biochem.76.052305.115300. [DOI] [PubMed] [Google Scholar]
- 2.Nakayama H, et al. Isolation and genetic characterization of a thymineless death-resistant mutant of Escherichia coli K12: Identification of a new mutation (recQ1) that blocks the RecF recombination pathway. Mol Gen Genet. 1984;195(3):474–480. doi: 10.1007/BF00341449. [DOI] [PubMed] [Google Scholar]
- 3.Bennett RJ, Keck JL. Structure and function of RecQ DNA helicases. Crit Rev Biochem Mol Biol. 2004;39(2):79–97. doi: 10.1080/10409230490460756. [DOI] [PubMed] [Google Scholar]
- 4.Brosh RM, Jr, Bohr VA. Human premature aging, DNA repair and RecQ helicases. Nucleic Acids Res. 2007;35(22):7527–7544. doi: 10.1093/nar/gkm1008. [DOI] [PMC free article] [PubMed] [Google Scholar]
- 5.Umezu K, Nakayama H. RecQ DNA helicase of Escherichia coli. Characterization of the helix-unwinding activity with emphasis on the effect of single-stranded DNA-binding protein. J Mol Biol. 1993;230(4):1145–1150. doi: 10.1006/jmbi.1993.1231. [DOI] [PubMed] [Google Scholar]
- 6.Umezu K, Nakayama K, Nakayama H. Escherichia coli RecQ protein is a DNA helicase. Proc Natl Acad Sci USA. 1990;87(14):5363–5367. doi: 10.1073/pnas.87.14.5363. [DOI] [PMC free article] [PubMed] [Google Scholar]
- 7.Harmon FG, Kowalczykowski SC. RecQ helicase, in concert with RecA and SSB proteins, initiates and disrupts DNA recombination. Genes Dev. 1998;12(8):1134–1144. doi: 10.1101/gad.12.8.1134. [DOI] [PMC free article] [PubMed] [Google Scholar]
- 8.Courcelle J, Hanawalt PC. RecQ and RecJ process blocked replication forks prior to the resumption of replication in UV-irradiated Escherichia coli. Mol Gen Genet. 1999;262(3):543–551. doi: 10.1007/s004380051116. [DOI] [PubMed] [Google Scholar]
- 9.Handa N, Morimatsu K, Lovett ST, Kowalczykowski SC. Reconstitution of initial steps of dsDNA break repair by the RecF pathway of E. coli. Genes Dev. 2009;23(10):1234–1245. doi: 10.1101/gad.1780709. [DOI] [PMC free article] [PubMed] [Google Scholar]
- 10.Morimatsu K, Kowalczykowski SC. RecQ helicase and RecJ nuclease provide complementary functions to resect DNA for homologous recombination. Proc Natl Acad Sci USA. 2014;111(48):E5133–E5142. doi: 10.1073/pnas.1420009111. [DOI] [PMC free article] [PubMed] [Google Scholar]
- 11.Adams MD, McVey M, Sekelsky JJ. Drosophila BLM in double-strand break repair by synthesis-dependent strand annealing. Science. 2003;299(5604):265–267. doi: 10.1126/science.1077198. [DOI] [PubMed] [Google Scholar]
- 12.Hanada K, et al. RecQ DNA helicase is a suppressor of illegitimate recombination in Escherichia coli. Proc Natl Acad Sci USA. 1997;94(8):3860–3865. doi: 10.1073/pnas.94.8.3860. [DOI] [PMC free article] [PubMed] [Google Scholar]
- 13.Harmon FG, DiGate RJ, Kowalczykowski SC. RecQ helicase and topoisomerase III comprise a novel DNA strand passage function: A conserved mechanism for control of DNA recombination. Mol Cell. 1999;3(5):611–620. doi: 10.1016/s1097-2765(00)80354-8. [DOI] [PubMed] [Google Scholar]
- 14.Suski C, Marians KJ. Resolution of converging replication forks by RecQ and topoisomerase III. Mol Cell. 2008;30(6):779–789. doi: 10.1016/j.molcel.2008.04.020. [DOI] [PMC free article] [PubMed] [Google Scholar]
- 15.Lopez CR, et al. A role for topoisomerase III in a recombination pathway alternative to RuvABC. Mol Microbiol. 2005;58(1):80–101. doi: 10.1111/j.1365-2958.2005.04812.x. [DOI] [PubMed] [Google Scholar]
- 16.Harmon FG, Kowalczykowski SC. Biochemical characterization of the DNA helicase activity of the escherichia coli RecQ helicase. J Biol Chem. 2001;276(1):232–243. doi: 10.1074/jbc.M006555200. [DOI] [PubMed] [Google Scholar]
- 17.Harmon FG, Brockman JP, Kowalczykowski SC. RecQ helicase stimulates both DNA catenation and changes in DNA topology by topoisomerase III. J Biol Chem. 2003;278(43):42668–42678. doi: 10.1074/jbc.M302994200. [DOI] [PubMed] [Google Scholar]
- 18.Manthei KA, Hill MC, Burke JE, Butcher SE, Keck JL. Structural mechanisms of DNA binding and unwinding in bacterial RecQ helicases. Proc Natl Acad Sci USA. 2015;112(14):4292–4297. doi: 10.1073/pnas.1416746112. [DOI] [PMC free article] [PubMed] [Google Scholar]
- 19.Shereda RD, Bernstein DA, Keck JL. A central role for SSB in Escherichia coli RecQ DNA helicase function. J Biol Chem. 2007;282(26):19247–19258. doi: 10.1074/jbc.M608011200. [DOI] [PubMed] [Google Scholar]
- 20.Rad B, Kowalczykowski SC. Efficient coupling of ATP hydrolysis to translocation by RecQ helicase. Proc Natl Acad Sci USA. 2012;109(5):1443–1448. doi: 10.1073/pnas.1119952109. [DOI] [PMC free article] [PubMed] [Google Scholar]
- 21.Rad B, Kowalczykowski SC. Translocation of E. coli RecQ helicase on single-stranded DNA. Biochemistry. 2012;51(13):2921–2929. doi: 10.1021/bi3000676. [DOI] [PMC free article] [PubMed] [Google Scholar]
- 22.Sarlós K, Gyimesi M, Kovács M. RecQ helicase translocates along single-stranded DNA with a moderate processivity and tight mechanochemical coupling. Proc Natl Acad Sci USA. 2012;109(25):9804–9809. doi: 10.1073/pnas.1114468109. [DOI] [PMC free article] [PubMed] [Google Scholar]
- 23.Gyimesi M, et al. Complex activities of the human Bloom’s syndrome helicase are encoded in a core region comprising the RecA and Zn-binding domains. Nucleic Acids Res. 2012;40(9):3952–3963. doi: 10.1093/nar/gks008. [DOI] [PMC free article] [PubMed] [Google Scholar]
- 24.Nimonkar AV, et al. BLM-DNA2-RPA-MRN and EXO1-BLM-RPA-MRN constitute two DNA end resection machineries for human DNA break repair. Genes Dev. 2011;25(4):350–362. doi: 10.1101/gad.2003811. [DOI] [PMC free article] [PubMed] [Google Scholar]
- 25.Cejka P, et al. DNA end resection by Dna2-Sgs1-RPA and its stimulation by Top3-Rmi1 and Mre11-Rad50-Xrs2. Nature. 2010;467(7311):112–116. doi: 10.1038/nature09355. [DOI] [PMC free article] [PubMed] [Google Scholar]
- 26.Niu H, et al. Mechanism of the ATP-dependent DNA end-resection machinery from Saccharomyces cerevisiae. Nature. 2010;467(7311):108–111. doi: 10.1038/nature09318. [DOI] [PMC free article] [PubMed] [Google Scholar]
- 27.Li N, et al. Multiple Escherichia coli RecQ helicase monomers cooperate to unwind long DNA substrates: A fluorescence cross-correlation spectroscopy study. J Biol Chem. 2010;285(10):6922–6936. doi: 10.1074/jbc.M109.069286. [DOI] [PMC free article] [PubMed] [Google Scholar]
- 28.Xu HQ, et al. The Escherichia coli RecQ helicase functions as a monomer. J Biol Chem. 2003;278(37):34925–34933. doi: 10.1074/jbc.M303581200. [DOI] [PubMed] [Google Scholar]
- 29.Zhang XD, et al. Escherichia coli RecQ is a rapid, efficient, and monomeric helicase. J Biol Chem. 2006;281(18):12655–12663. doi: 10.1074/jbc.M513089200. [DOI] [PubMed] [Google Scholar]
- 30.Joo C, Balci H, Ishitsuka Y, Buranachai C, Ha T. Advances in single-molecule fluorescence methods for molecular biology. Annu Rev Biochem. 2008;77:51–76. doi: 10.1146/annurev.biochem.77.070606.101543. [DOI] [PubMed] [Google Scholar]
- 31.Bianco PR, et al. Processive translocation and DNA unwinding by individual RecBCD enzyme molecules. Nature. 2001;409(6818):374–378. doi: 10.1038/35053131. [DOI] [PubMed] [Google Scholar]
- 32.Spies M, Amitani I, Baskin RJ, Kowalczykowski SC. RecBCD enzyme switches lead motor subunits in response to chi recognition. Cell. 2007;131(4):694–705. doi: 10.1016/j.cell.2007.09.023. [DOI] [PMC free article] [PubMed] [Google Scholar]
- 33.Spies M, et al. A molecular throttle: The recombination hotspot chi controls DNA translocation by the RecBCD helicase. Cell. 2003;114(5):647–654. doi: 10.1016/s0092-8674(03)00681-0. [DOI] [PubMed] [Google Scholar]
- 34.Fili N, et al. Visualizing helicases unwinding DNA at the single molecule level. Nucleic Acids Res. 2010;38(13):4448–4457. doi: 10.1093/nar/gkq173. [DOI] [PMC free article] [PubMed] [Google Scholar]
- 35.Handa N, Bianco PR, Baskin RJ, Kowalczykowski SC. Direct visualization of RecBCD movement reveals cotranslocation of the RecD motor after chi recognition. Mol Cell. 2005;17(5):745–750. doi: 10.1016/j.molcel.2005.02.011. [DOI] [PubMed] [Google Scholar]
- 36.Greene EC, Mizuuchi K. Direct observation of single MuB polymers: Evidence for a DNA-dependent conformational change for generating an active target complex. Mol Cell. 2002;9(5):1079–1089. doi: 10.1016/s1097-2765(02)00514-2. [DOI] [PubMed] [Google Scholar]
- 37.Amitani I, Liu B, Dombrowski CC, Baskin RJ, Kowalczykowski SC. Watching individual proteins acting on single molecules of DNA. Methods Enzymol. 2010;472:261–291. doi: 10.1016/S0076-6879(10)72007-3. [DOI] [PMC free article] [PubMed] [Google Scholar]
- 38.Forget AL, Dombrowski CC, Amitani I, Kowalczykowski SC. Exploring protein-DNA interactions in 3D using in situ construction, manipulation and visualization of individual DNA dumbbells with optical traps, microfluidics and fluorescence microscopy. Nat Protoc. 2013;8(3):525–538. doi: 10.1038/nprot.2013.016. [DOI] [PMC free article] [PubMed] [Google Scholar]
- 39.Fili N, Toseland CP, Dillingham MS, Webb MR, Molloy JE. A single-molecule approach to visualize the unwinding activity of DNA helicases. Methods Mol Biol. 2011;778:193–214. doi: 10.1007/978-1-61779-261-8_13. [DOI] [PubMed] [Google Scholar]
- 40.Dillingham MS, et al. Fluorescent single-stranded DNA binding protein as a probe for sensitive, real-time assays of helicase activity. Biophys J. 2008;95(7):3330–3339. doi: 10.1529/biophysj.108.133512. [DOI] [PMC free article] [PubMed] [Google Scholar]
- 41.Bell JC, Plank JL, Dombrowski CC, Kowalczykowski SC. Direct imaging of RecA nucleation and growth on single molecules of SSB-coated ssDNA. Nature. 2012;491(7423):274–278. doi: 10.1038/nature11598. [DOI] [PMC free article] [PubMed] [Google Scholar]
- 42.Eggleston AK, Rahim NA, Kowalczykowski SC. A helicase assay based on the displacement of fluorescent, nucleic acid-binding ligands. Nucleic Acids Res. 1996;24(7):1179–1186. doi: 10.1093/nar/24.7.1179. [DOI] [PMC free article] [PubMed] [Google Scholar]
- 43.Kowalczykowski S, Steinhardt J. Kinetics of hemoglobin S gelation followed by continuously sensitive low-shear viscosity. J Mol Biol. 1977;115(2):201–213. doi: 10.1016/0022-2836(77)90097-3. [DOI] [PubMed] [Google Scholar]
- 44.Nielsen AE. Kinetics of Precipitation. MacMillan; New York: 1964. p. 153. [Google Scholar]
- 45.Oosawa F, Asakura S. 1975. Thermodynamics of the Polymerization of Protein (Academic, NewYork) p 204.
- 46.Jensen DE, von Hippel PH. DNA “melting” proteins. I. Effects of bovine pancreatic ribonuclease binding on the conformation and stability of DNA. J Biol Chem. 1976;251(22):7198–7214. [PubMed] [Google Scholar]
- 47.Jensen DE, Kelly RC, von Hippel PH. DNA “melting” proteins. II. Effects of bacteriophage T4 gene 32-protein binding on the conformation and stability of nucleic acid structures. J Biol Chem. 1976;251(22):7215–7228. [PubMed] [Google Scholar]
- 48.Lucic B, et al. A prominent β-hairpin structure in the winged-helix domain of RECQ1 is required for DNA unwinding and oligomer formation. Nucleic Acids Res. 2011;39(5):1703–1717. doi: 10.1093/nar/gkq1031. [DOI] [PMC free article] [PubMed] [Google Scholar]
- 49.Hishida T, et al. Role of the Escherichia coli RecQ DNA helicase in SOS signaling and genome stabilization at stalled replication forks. Genes Dev. 2004;18(15):1886–1897. doi: 10.1101/gad.1223804. [DOI] [PMC free article] [PubMed] [Google Scholar]
- 50.Byrd AK, Raney KD. Protein displacement by an assembly of helicase molecules aligned along single-stranded DNA. Nat Struct Mol Biol. 2004;11(6):531–538. doi: 10.1038/nsmb774. [DOI] [PubMed] [Google Scholar]
- 51.Levin MK, Wang YH, Patel SS. The functional interaction of the hepatitis C virus helicase molecules is responsible for unwinding processivity. J Biol Chem. 2004;279(25):26005–26012. doi: 10.1074/jbc.M403257200. [DOI] [PubMed] [Google Scholar]
- 52.Byrd AK, Raney KD. Increasing the length of the single-stranded overhang enhances unwinding of duplex DNA by bacteriophage T4 Dda helicase. Biochemistry. 2005;44(39):12990–12997. doi: 10.1021/bi050703z. [DOI] [PubMed] [Google Scholar]
- 53.Levin MK, Patel SS. The helicase from hepatitis C virus is active as an oligomer. J Biol Chem. 1999;274(45):31839–31846. doi: 10.1074/jbc.274.45.31839. [DOI] [PubMed] [Google Scholar]
- 54.Dou SX, Wang PY, Xu HQ, Xi XG. The DNA binding properties of the Escherichia coli RecQ helicase. J Biol Chem. 2004;279(8):6354–6363. doi: 10.1074/jbc.M311272200. [DOI] [PubMed] [Google Scholar]
- 55.Kowalczykowski SC, Lonberg N, Newport JW, Paul LS, von Hippel PH. On the thermodynamics and kinetics of the cooperative binding of bacteriophage T4-coded gene 32 (helix destabilizing) protein to nucleic acid lattices. Biophys J. 1980;32(1):403–418. doi: 10.1016/S0006-3495(80)84964-2. [DOI] [PMC free article] [PubMed] [Google Scholar]
- 56.Duderstadt KE, Chuang K, Berger JM. DNA stretching by bacterial initiators promotes replication origin opening. Nature. 2011;478(7368):209–213. doi: 10.1038/nature10455. [DOI] [PMC free article] [PubMed] [Google Scholar]
- 57.Dueber EL, Corn JE, Bell SD, Berger JM. Replication origin recognition and deformation by a heterodimeric archaeal Orc1 complex. Science. 2007;317(5842):1210–1213. doi: 10.1126/science.1143690. [DOI] [PubMed] [Google Scholar]
- 58.Gaudier M, Schuwirth BS, Westcott SL, Wigley DB. Structural basis of DNA replication origin recognition by an ORC protein. Science. 2007;317(5842):1213–1216. doi: 10.1126/science.1143664. [DOI] [PubMed] [Google Scholar]
- 59.Dodson M, Dean FB, Bullock P, Echols H, Hurwitz J. Unwinding of duplex DNA from the SV40 origin of replication by T antigen. Science. 1987;238(4829):964–967. doi: 10.1126/science.2823389. [DOI] [PubMed] [Google Scholar]
- 60.Dean FB, et al. Simian virus 40 (SV40) DNA replication: SV40 large T antigen unwinds DNA containing the SV40 origin of replication. Proc Natl Acad Sci USA. 1987;84(1):16–20. doi: 10.1073/pnas.84.1.16. [DOI] [PMC free article] [PubMed] [Google Scholar]
- 61.Gauss P, Park K, Spencer TE, Hacker KJ. DNA helicase requirements for DNA replication during bacteriophage T4 infection. J Bacteriol. 1994;176(6):1667–1672. doi: 10.1128/jb.176.6.1667-1672.1994. [DOI] [PMC free article] [PubMed] [Google Scholar]
- 62.Barry J, Alberts B. Purification and characterization of bacteriophage T4 gene 59 protein. A DNA helicase assembly protein involved in DNA replication. J Biol Chem. 1994;269(52):33049–33062. [PubMed] [Google Scholar]
- 63.Bernstein DA, Zittel MC, Keck JL. High-resolution structure of the E. coli RecQ helicase catalytic core. EMBO J. 2003;22(19):4910–4921. doi: 10.1093/emboj/cdg500. [DOI] [PMC free article] [PubMed] [Google Scholar]
- 64.Zhu Z, Chung WH, Shim EY, Lee SE, Ira G. Sgs1 helicase and two nucleases Dna2 and Exo1 resect DNA double-strand break ends. Cell. 2008;134(6):981–994. doi: 10.1016/j.cell.2008.08.037. [DOI] [PMC free article] [PubMed] [Google Scholar]
- 65.Nimonkar AV, Ozsoy AZ, Genschel J, Modrich P, Kowalczykowski SC. Human exonuclease 1 and BLM helicase interact to resect DNA and initiate DNA repair. Proc Natl Acad Sci USA. 2008;105(44):16906–16911. doi: 10.1073/pnas.0809380105. [DOI] [PMC free article] [PubMed] [Google Scholar]
- 66.Wu L, Hickson ID. The Bloom’s syndrome helicase suppresses crossing over during homologous recombination. Nature. 2003;426(6968):870–874. doi: 10.1038/nature02253. [DOI] [PubMed] [Google Scholar]
- 67.Cejka P, Plank JL, Bachrati CZ, Hickson ID, Kowalczykowski SC. Rmi1 stimulates decatenation of double Holliday junctions during dissolution by Sgs1-Top3. Nat Struct Mol Biol. 2010;17(11):1377–1382. doi: 10.1038/nsmb.1919. [DOI] [PMC free article] [PubMed] [Google Scholar]
- 68.Cejka P, Kowalczykowski SC. The full-length Saccharomyces cerevisiae Sgs1 protein is a vigorous DNA helicase that preferentially unwinds holliday junctions. J Biol Chem. 2010;285(11):8290–8301. doi: 10.1074/jbc.M109.083196. [DOI] [PMC free article] [PubMed] [Google Scholar]
- 69.Schneider CA, Rasband WS, Eliceiri KW. NIH Image to ImageJ: 25 years of image analysis. Nat Methods. 2012;9(7):671–675. doi: 10.1038/nmeth.2089. [DOI] [PMC free article] [PubMed] [Google Scholar]
- 70.Sambrook J, Fritsch EF, Maniatis T. Molecular Cloning: A Laboratory Manual. 2nd Ed Cold Spring Harbor Lab Press; Cold Spring Harbor, NY: 1989. [Google Scholar]
- 71.Forget AL, Kowalczykowski SC. Single-molecule imaging of DNA pairing by RecA reveals a three-dimensional homology search. Nature. 2012;482(7385):423–427. doi: 10.1038/nature10782. [DOI] [PMC free article] [PubMed] [Google Scholar]
- 72.Doyle PS, Ladoux B, Viovy JL. Dynamics of a tethered polymer in shear flow. Phys Rev Lett. 2000;84(20):4769–4772. doi: 10.1103/PhysRevLett.84.4769. [DOI] [PubMed] [Google Scholar]
Associated Data
This section collects any data citations, data availability statements, or supplementary materials included in this article.


