

Abstract
Using next-generation, transcriptome-wide RNA sequencing (RNA-Seq) technology we assessed the effects of exercise training on transcriptional profiles in skeletal muscle arterioles isolated from the soleus and gastrocnemius muscles of Otsuka Long Evans Tokushima Fatty (OLETF) rats that underwent an endurance exercise training program (EX; n = 13), interval sprint training program (SPRINT; n = 14), or remained sedentary (Sed; n = 12). We hypothesized that the greatest effects of exercise would be in the gastrocnemius arterioles. Results show that EX caused the largest number of changes in gene expression in the soleus and white gastrocnemius 2a arterioles with little to no changes in the feed arteries. In contrast, SPRINT caused substantial changes in gene expression in the feed arteries. IPA canonical pathway analysis revealed 18 pathways with significant changes in gene expression when analyzed across vessels and revealed that EX induces increased expression of the following genes in all arterioles examined: Shc1, desert hedgehog protein (Dhh), adenylate cyclase 4 (Adcy4), G protein binding protein, alpha (Gnat1), and Bcl2l1 and decreased expression of ubiquitin D (Ubd) and cAMP response element modulator (Crem). EX increased expression of endothelin converting enzyme (Ece1), Hsp90b, Fkbp5, and Cdcl4b in four of five arterioles. SPRINT had effects on expression of Crem, Dhh, Bcl2l1, and Ubd that were similar to EX. SPRINT also increased expression of Nfkbia, Hspa5, Tubb 2a and Tubb 2b, and Fkbp5 in all five arterioles and increased expression of Gnat1 in all but the soleus second-order arterioles. Many contractile and/or structural protein genes were increased by SPRINT in the gastrocnemius feed artery, but the same genes exhibited decreased expression in red gastrocnemius arterioles. We conclude that training-induced changes in arteriolar gene expression patterns differ by muscle fiber type composition and along the arteriolar tree.
Keywords: interval sprint training, endurance exercise, blood flow, next-generation sequencing, gene expression, resistance arteries
when a rat is simply maintaining posture on the treadmill, its slow-twitch, oxidative soleus muscle has blood flow two- to fourfold greater than fast-twitch, glycolytic gastrocnemius muscle (2, 39). As treadmill exercise begins muscle fibers in the gastrocnemius muscle are recruited and blood flow increases with increasing running speed so that soleus and gastrocnemius muscles have similar blood flow during intense exercise (1). Exercise training of various intensities produces structural and functional vascular adaptations of greater magnitude within the gastrocnemius muscle vascular network than in the soleus vascular network of rats (4, 7, 28, 48). It seems possible that the differences in vascular adaptation in these two skeletal muscles result from the fact that the soleus muscle does not have as large an increase in blood flow during exercise (1, 2, 39) because substantial evidence supports the notion that vascular shear stress plays a key role in modulation of the phenotype of vascular cells and of structural vascular adaptation (29, 43).
The incidences of obesity, metabolic syndrome, and type 2 diabetes (T2D) continue to grow at alarming rates (33, 60). Insulin resistance is a cardinal sign of T2D which may be attributable to physical inactivity/sedentary lifestyle combined with obesity (9, 51, 55, 60). Although exercise training increases insulin sensitivity and glycemic control, these beneficial effects do not explain the power of exercise in prevention and treatment of T2D (3, 23, 56, 66) so mechanisms responsible for these effects of exercise remain to be established (66, 68).
T2D is associated with decreased endothelium-dependent dilation (EDD) and vascular rarefaction in skeletal muscle microcirculation (34, 38, 60) leading us to hypothesize that the ability of exercise to restore structure/function in skeletal muscle vasculature in T2D relates to reversing these untoward effects. Importantly, T2D-induced blunting of EDD differs with muscle fiber type composition, and exercise training reverses this dysfunction in a fiber type-dependent manner (4, 48, 52) as exercise training improves EDD nonuniformly in the arterial tree of skeletal muscle (4, 30, 48, 52, 53).
In the study reported herein, transcriptional profiles in skeletal muscle arterioles and feed arteries from sedentary and exercised-trained animals were assessed using techniques described previously (31, 57). We used transcriptome-wide RNA sequencing (RNA-Seq) analysis in the soleus and gastrocnemius arterioles from Otsuka Long Evans Tokushima Fatty (OLETF) rats to gain insights into the molecular events underpinning exercise-induced skeletal muscle vascular adaptations in obesity and T2D. One group of OLETF rats underwent an endurance exercise training program (EX), a second group underwent an interval sprint training program (SPRINT), and a third group was restricted to cage activity (Sed). Our hypothesis was that the greatest effects of exercise training on the transcriptome would be in the gastrocnemius arterioles compared with soleus arterioles. Furthermore we reasoned that in gastrocnemius arterioles interval sprint training would produce greater vascular transcriptional changes compared with EX because of greater increases in skeletal muscle fiber recruitment of this muscle during sprinting (1, 2, 4, 15, 39, 48-50, 52, 53). We analyzed arterioles of similar branch order from both muscles. The relative sizes and vasomotor properties of these arterioles isolated from these same rats have been described previously (48).
METHODS
Animals and experimental design.
The rats used in this study are the same as those used in our previous reports on the feed arteries (31, 57) and vasomotor function of four arterioles of soleus and gastrocnemius muscles (48). Indeed the arterioles used for RNA-Seq here were dissected from the same muscles and preserved for analysis at the time similar vessels were removed for study of vasomotor function (48). Male OLETF rats (n = 39) were obtained at age 4 wk (Japan SLC, 3371-8, Kotoh-Cho, Hamamatsu, Shizuoka, Japan). The OLETF rat has a mutated cholecystokinin-1 receptor that results in a hyperphagic phenotype and has become an established model of obesity, insulin resistance, and T2D (32). Each rat was individually housed in a temperature-controlled (21°C) environment with 0600–1800 light and 1800-0600 dark cycles. All animals were given ad libitum access to standard chow with a macronutrient composition of 56% carbohydrate, 17% fat, and 27% protein (Formulab 5008, Purina Mills, St. Louis, MO). At 20 wk of age, rats were randomly assigned to one of three groups: 1) Sed (n = 12), 2) EX (n = 13), and 3) SPRINT (n = 14). We used the endurance training (EX) program we have used extensively previously (1, 2, 39, 45, 49, 50) in which treadmill running duration and intensity were increased progressively over the first 4 wk to reach 60 min of treadmill running at 20 m/min at a 15% incline for the remaining 8 wk. We also used a SPRINT exercise training program we have used extensively (1, 2, 39, 45, 49, 50) which consists of six bouts of treadmill running, with 4.5-min rest periods that progressively increase in duration and intensity over the first 5 wk to reach running speeds of 40 m/min at a 15% incline for 2.5 min/bout for the remaining 7 wk (0.6 km/day). Both EX and SPRINT groups exercised 5 days/wk.
Rats were anesthetized at 30–32 wk of age with an intraperitoneal injection of pentobarbital sodium (50 mg/kg) between 0800 and 0930. Tissues were then harvested, and the animals were killed by exsanguination. The last exercise bout for EX and SPRINT animals was performed ∼18 h prior to death. Food was removed from the cages 12 h prior to death. All protocols were approved by the University of Missouri Animal Care and Use Committee.
Body weight, body composition, food intake, and citrate synthase.
Body weights and food intakes were monitored and recorded on a weekly basis. Weekly food intakes were averaged across the period of the intervention (age 20–30 wk). Body composition was assessed by dual-energy X-ray absorptiometry (DXA; Hologic QDR-1000, calibrated for rodents) on the day of death. Omental, retroperitoneal and epididymal adipose tissue depots were then removed and weighed to the nearest 0.01 g. Citrate synthase activity was measured from whole muscle homogenate of the red and white portions of the vastus lateralis muscle using the spectrophotometric method of Srere (62).
Blood parameters.
Whole blood was collected on the day of euthanasia for analysis of glycosylated hemoglobin (HbA1c) by the boronate-affinity high-performance liquid chromatography method (Primus Diagnostics, Kansas City, MO) in the Diabetes Diagnostics Laboratory at the University of Missouri. Serum samples were prepared by centrifugation and stored at −80°C until analysis. Glucose, triglyceride (TG), and nonesterified fatty acid (NEFA) assays were performed by a commercial laboratory (Comparative Clinical Pathology Services, Columbia, MO) on an Olympus AU680 automated chemistry analyzer (Beckman-Coulter, Brea, CA) using commercially available assays according to manufacturer's guidelines. Plasma insulin concentrations were determined using a commercially available, rat-specific enzyme-linked immunosorbent assay (Alpco Diagnostics, Salem, NH). Samples were run in duplicate, and manufacturer's controls and calibrators were used according to assay instructions.
Isolation of skeletal muscle arterioles.
Immediately after harvesting the gastrocnemius and soleus muscle complex, the muscles were pinned down in a Petri dish containing a cold RNA-stabilizing agent (RNAlater; Ambion, Austin, TX). Under the microscope, diaphragm, soleus, and gastrocnemius feed arteries and second (2a)-order branch arterioles were dissected clean of perivascular adipose tissue and excess adventitia. Thus from each rat we isolated the following: the soleus feed artery (SFA) and 2a arteriole (S2a); and the feed artery (GFA), 2a arterioles from red (RG2a) and white (WG2a) portions of the gastrocnemius muscle as shown in Fig. 1. Also, diaphragm feed artery (DFA) and 2a arterioles (D2a) were isolated at the same time. All samples were kept in RNAlater for 48 h at 4°C, and then removed from the RNAlater solution and stored at −80°C until analysis. Although results from the SFA and GFA have been reported previously, we chose to include data from these samples in our current analysis as an internal check of our data analysis procedures (31, 57, 58). Thus, as described below, the RNA-Seq data from SFA and GFA were the same as reported previously, but it was required that these data were analyzed again in the process of analyzing the results from S2a, RG2a, and WG2a samples. Because of the substantial number of differences in the effects of exercise training on gene expression in the diaphragm arteries and the skeletal muscle arteries we decided to publish these data in two papers, this one and the companion paper (40a) focused on diaphragm feed arteries and second-order arterioles.
Fig. 1.
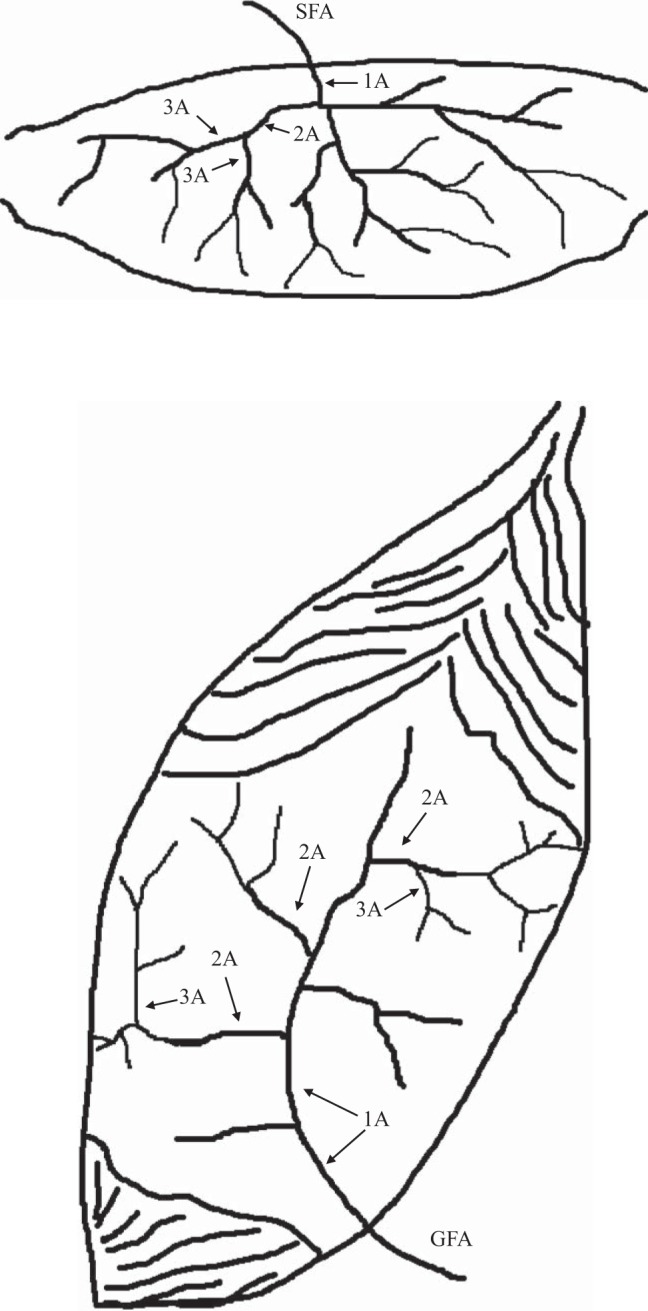
Illustration of location of sampled vessels in the soleus muscle (top) and medial head of the gastrocnemius muscle (bottom). The soleus feed artery (SFA) is the last artery entering the mid-body of the muscle prior to the epimysium. The first artery under the epimysium is the first branch arteriole (1A) which gives rise to the second branch arteriole (2A, referred to in the text as the S2a); finally the 2A arterioles give rise to the third branch arterioles (3A). Similarly for the gastrocnemius muscle (bottom), the gastrocnemius feed artery (GFA) is the last artery entering the muscle and as it goes through the epimysium it becomes the 1A branch arteriole which gives rise to the second branch arteriole (2A) and finally the 2A arterioles give rise to the third branch arterioles (3A). In the gastrocnemius muscle the 2A arterioles near the bottom of the figure (near the knee in the animal) provide blood to the red portion of the muscle (RG2a in the text) while near the top of the figure (superficial portion of the muscle in the animal) the 2A arterioles provide blood to the white portion of the muscle (WG2a in the text of the paper).
RNA extraction and quality control.
Total RNA isolations were performed as described previously using the NucleoMag 96 RNA kit procedure (Clontech part no. 744350.1) (31, 57). For assessing total RNA yield and integrity, tandem Agilent Bioanalyzer 2100 instruments were used in combination with the Total RNA 6000 Pico Assay as described (31, 57). At the time of this study, the RNA Pico LabChip Kit was the only platform to give unbiased assessment of RNA integrity (via RIN) and accurate results with small amounts of RNA. Typical yields for these samples were ∼500-1,000 pg/μl.
Illumina library preparation (SMARTer amplification and RNA-Seq).
The SMARTer Ultra Low RNA Kit for Illumina Sequencing (Clontech, cat. no. 634935) was utilized for generating full-length cDNA transcripts prior to Illumina RNA-Seq library preparation due to low concentration of RNA in some samples. We used SMARTer first-strand cDNA synthesis and purification, utilizing the SMARTer anchor sequence and poly(A) sequence that serve as universal priming sites for end-to-end generation of single-stranded cDNA, followed by cDNA amplification with LongDistance PCR (LD-PCR) using the manufacturer's recommended Advantage 2 PCR system (Clontech, cat. no. PT3281-1) as designed for Illumina sequencing and used 100-1,000 pg of total RNA as input to the SMARTer 1st cDNA reaction.
The Bioanalyzer 2100 High Sensitivity DNA Assay (Agilent, cat. no. 5067-4626) was used to size and quantitate DNA up to 12 kb in length, using minimal sample volumes (1 μl). After 14 cycles of LD-PCR amplification the final cDNA yields were estimated at ∼1–10 ng for each sample. To generate Illumina Paired-End RNAseq libraries, cDNA was fragmented to ∼200 bp using the Q700 DNA fragmentation system (QSonica) and then used directly with the NextFlex DNA preparation kit (Bioo Scientific, cat. no. 5140-02). Fragment cDNA was end repaired and purified with 1.8 × SPRI beads to remove reaction components (Agencourt) and A-tailed in preparation for cohesive ligation to the Illumina specific sequencing adapters (NextFlex DNA Adapters, Bioo Scientific, cat. no. 514104). Ligated DNA was purified twice with 1.0 × SPRI to remove adapter dimers and perform gel-free size selection, and then amplified through 14 cycles of PCR. The final sequencing construct was purified with a 1.0 × SPRI to remove low-molecular-weight adapter dimer artifacts (if any), and libraries were validated to contain ∼330 bp fragments using the Bioanalyzer 2100 High Sensitivity DNA Assay. Library quantitation was performed using the Qubit 2.0 flourometer and the High Sensitivity DNA assay (Life Tech, cat no. Q32851).
RNA sequencing.
As previously described (31, 57), large-scale multiplexing (48 bar codes) was used to form many library pools that were later sequenced. Samples were randomized to the pools in a stratified manner with dynamic allocation used to maximize the representation and balance of key covariates (e.g., vessel, treatment, and date of death). The final pools were each loaded on a single lane of single-read 50-base sequencing on the Illumina HiSeq2000 yielding ∼175–200 million useable reads per lane (14–17 million reads per RNAseq sample). Because the harvesting and sequencing could not all be done at one time, the pools were sequenced in 5 batches over a 4-mo period.
Statistical analysis.
The analysis of the RNA-Seq data was carried out for the SFA, S2a, GFA, RG2a, WG2a, DFA, and D2a samples as described previously (31, 57). Nonspecific filtering of genes prior to statistical testing was carried out to increase detection power (10), based on the requirement that a gene have mean expression level greater than 2 counts per million reads mapped (CPM) after averaging across all samples. This CPM cutoff was established empirically based on the point at which the External RNA Controls Consortium (ERCC) spike-ins at different concentrations were no longer distinguishable. Adjustment to the P values was made to account for multiple testing using the false discovery rate (FDR) method of Benjamini and Hochberg (5). For all comparisons we chose 10% as our FDR threshold for statistical significance. As an empirical measure of the false discovery rate, we evaluated what proportion of the identical ERCC probe/concentration combinations (Set B) appeared in our list of differentially expressed genes. Similarly, we looked at a set of 13 putative housekeeping genes derived from a study of more than 13,000 rat samples (14) to have another estimate of our false discovery rate. The set of genes was Actb, B2m, Gapdh, Gusb, Hprt1, Hmbs, Hsp90b1, Rpl13a, Rps29, Rplp0, Ppia, Tbp, and Tuba1. For both of these sets of controls, we also estimated the fold change of each of the genes as a measure of the accuracy of the fold change estimates.
Based on our list of differentially expressed genes, canonical pathways were assessed for enrichment for each gene list produced (i.e., each gene list was separately analyzed for enriched pathways). We used Fisher's test for enrichment with a P < 0.01 for significance. Many pathways appeared in multiple gene lists so the significance of such pathways was computed by combining P values (across each gene list) using the method of Fisher. Novel networks were generated through the use of Ingenuity Pathways Analysis (Ingenuity Systems, http://www.ingenuity.com/), henceforth IPA, as previously described (31, 57, 58). Finally, for the remaining data (i.e., non RNA-Seq) a one-way ANOVA with LSD post hoc was performed to examine the between-group differences for all descriptive variables, and statistical significance was declared at P ≤ 0.05.
RESULTS
Results characterizing the animals from which the arterioles were isolated are only summarized here because they have been reported previously (57). Both exercise training programs produced decreased body weight (Sed 687 ± 12 g, EX = 592 ± 11 g, SPRINT = 589 ± 13 g), % body fat (Sed 35 ± 1, EX = 25 ± 1, SPRINT = 27 ± 1), and small decreases in absolute food intake but the food intake per day relative to body weight was similar in all three groups. Retroperitoneal, omental, and epididymal adipose tissue masses were also significantly less in both SPRINT and EX groups compared with sedentary animals. Heart weight-to-body weight ratios were significantly greater in EX and SPRINT groups due to differences in body weight as heart weights were similar across all three groups. Both SPRINT and EX training resulted in significant increases in citrate synthase activity in the red and white portions of the vastus lateralis muscle, establishing the effectiveness of the training programs. Total and HDL cholesterol levels were lower in both trained groups while LDL cholesterol was not different among the groups. Triglycerides and nonesterified fatty acid levels were lower in EX and SPRINT than in sedentary rats. Insulin (Sed 8.1 ± 1.4 ng/ml, EX = 4.1 ± 0.5, SPRINT = 3.9 ± 0.6), HOMA-IR index, and % glycosylated hemoglobin (HbA1c) (Sed 7.2 ± 0.3%, EX = 5.4 ± 0.1%, SPRINT = 5.5 ± 0.1%) were lower in both trained groups. Glucose levels (Sed 297 ± 14 mg/dl, EX = 247 ± 27, SPRINT = 209 ± 10) were only significantly lower in the SPRINT vs. sedentary animals (57).
For group comparisons reported involving soleus and gastrocnemius arterioles, the average ERCC Spike-in (Set B) empirical FDR was 2.6% at the FDR cutoff of 10% (mean fold = 1.12), while for the putative housekeeping genes the average was 2.4% (fold = 0.999). In their entirety these findings strongly support the methodology used because, on average, the fold changes for these controls are approximately equal to 1 and the empirical FDR is less than the target FDR (10%).
Effects of EX and SPRINT on gene expression FDR < 10%.
Figure 2 presents results showing the number of genes in each type of arteriole from the gastrocnemius and soleus muscles whose expression was changed by EX and/or SPRINT training with FDR of 10%. The intersections show genes whose expression was changed by both EX and SPRINT. These results show that EX caused the largest number of changes in gene expression in S2a and WG2a arterioles with little to no changes in the GFA. In contrast, SPRINT caused substantial changes in gene expression in the SFA and GFA. Overall, based on our hypothesis, it was surprising that SPRINT caused so few changes in gene expression in the WG2a.
Fig. 2.

Venn diagrams illustrating the number of genes whose expression was altered by endurance exercise (EX) and by interval sprint training (SPRINT) in various arterioles from gastrocnemius (panels on the left) (RG2a, WG2a, and GFA) and soleus (S2a and SFA) muscles as defined in the text. Red font indicates upregulated genes and green font downregulated genes relative to expression in sedentary rats. Overlapping area represents genes whose expression was changed by both EX and SPRINT.
Results of ingenuity canonical pathway analysis of effects of EX and SPRINT.
IPA analysis, used to evaluate the effects of EX and SPRINT on expression of genes in established canonical pathways (301 metabolic pathways and 341 signaling pathways), revealed that 18 pathways had significant changes in gene expression when analyzed across vessels, and 16 of 18 were signaling pathways. Based on past experience concerning known vascular cell signaling pathways that are altered by exercise training and results indicating pathways that have statistically significant changes induced by EX and/or SPRINT, we selected the following canonical pathways for further analysis: endothelin-1, eNOS, cellular effects of sildenafil, epithelial adherens junction, germ cell-sertoli cell junction, remodeling of epithelial adherens junctions, tight junction, STAT3, protein kinase A, production of NO and ROS, calcium, AMPK, gap junction, actin cytoskeleton, glucocorticoid receptor, NRF2-mediated oxidative stress responses, PLC, protein ubiquitination pathway, regulation of Stathmin1, T2D, hepatic fibrosis, insulin receptor signaling, and WntI2-catenin signaling pathways. Results indicate that some pathways contained substantial numbers of genes with changes in expression across many of the arteries examined. For example, the Actin Cytoskeleton Signaling pathway (Table 1) contained a number of genes that exhibited altered expression levels in EX and/or SPRINT relative to sedentary OLETF rats. Many genes coding for contractile and/or structural proteins were increased by EX and SPRINT in the GFA but exhibited decreased expression in the RG2a arterioles (Table 1). For example, Myh4 gene (myosin, heavy chain 4, skeletal muscle) expression was increased by 1.79- and 7.87-fold in the GFA of EX and SPRINT, respectively, whereas expression of this same gene was decreased in the RG2a and S2a with no change in SFA or WG2a with EX and SPRINT. Similarly, Actc1 expression was increased in the GFA of EX and SPRINT but decreased in the RG2a and S2a with no change in SFA or WG2a. These results indicate that the adaptations to both SPRINT and EX ongoing in the GFA were dramatically different from those in other arterioles in the vasculature of the gastrocnemius muscle and soleus muscle.
Table 1.
Actin cytoskeleton signaling IPA canonical pathway
| Symbol | GeneID | GFA.OE | GFA.OI | RG2a.OE | RG2a.OI | S2a.OE | S2a.OI | SFA.OE | SFA.OI | WG2a.OE | WG2a.OI |
|---|---|---|---|---|---|---|---|---|---|---|---|
| Fn1 | 25661 | 1.055 | 0.962 | 1.085 | 1.155 | 1.443* | 1.193 | 1.062 | 0.96 | 0.841 | 0.719* |
| Shc1 | 85385 | 1.425* | 1.143 | 1.427* | 1.44* | 1.704* | 1.447* | 1.251 | 1.136 | 1.287 | 1.073 |
| Myh10 | 79433 | 0.878 | 0.824 | 0.996 | 0.963 | 1.067 | 0.823 | 0.834 | 0.727* | 0.908 | 0.623* |
| Mprip | 116504 | 0.984 | 0.758* | 1.249 | 1.087 | 1.099 | 0.893 | 0.837 | 0.704* | 0.872 | 1.015 |
| Vav3 | 295378 | 1.214 | 0.707 | 1.121 | 0.983 | 1.502* | 1.079 | 0.978 | 1.119 | 1.128 | 0.802 |
| Actb | 81822 | 0.911 | 1.087 | 0.933 | 0.903 | 1.129 | 1.268 | 0.965 | 1.124 | 1.163 | 1.055 |
| Sos2 | 85384 | 1.137 | 0.881 | 1.305 | 0.924 | 1.021 | 0.768 | 1.089 | 0.89 | 0.785 | 1.1 |
| Rac1 | 363875 | 0.931 | 0.902 | 1.327 | 1.532* | 1.49* | 1.144 | 0.924 | 0.931 | 1.054 | 0.923 |
| Rdx | 315655 | 1.038 | 1.087 | 1.321* | 1.511* | 1.119 | 0.89 | 1.1 | 0.901 | 0.884 | 0.99 |
| Actg2 | 25365 | 1.283 | 1.309 | 1.318 | 1.392 | 0.897 | 0.924 | 1.051 | 0.722 | 1.092 | 1.186 |
| Actg1 | 287876 | 0.929 | 1.011 | 0.86 | 0.922 | 0.93 | 0.976 | 1.051 | 1.078 | 0.933 | 0.927 |
| Myh2 | 691644 | 1.191 | 21.846* | 0.377 | 0.093* | 0.979 | 0.727 | 0.425 | 0.956 | 1.28 | 1.328 |
| Mylpf | 24584 | 0.779 | 15.647* | 0.286 | 0.134* | 0.774 | 0.837 | 0.464 | 0.534 | 0.999 | 0.885 |
| Myl1 | 56781 | 1.013 | 5.982* | 0.411 | 0.27* | 0.264* | 0.466 | 1.387 | 1.052 | 1.239 | 1.422 |
| Myh1 | 287408 | 1.207 | 29.976* | 0.296 | 0.078* | 0.593 | 0.375 | 0.485 | 1.207 | 1.456 | 1.488 |
| Myh4 | 360543 | 1.787 | 7.867* | 0.198* | 0.069* | 0.396 | 0.165* | 1.271 | 1.899 | 0.551 | 0.948 |
| Myh8 | 252942 | 2.017 | 6.989* | 0.343 | 0.066* | 1.029 | 0.413 | 1.153 | 1.55 | 1.146 | 1.334 |
| Actn3 | 171009 | 1.049 | 10.724* | 0.173* | 0.063* | 0.54 | 0.293 | 0.702 | 0.948 | 0.74 | 1.25 |
| Ptk2 | 25614 | 0.891 | 0.967 | 1.057 | 1.166 | 1.668* | 1.1 | 1.066 | 1.025 | 1.043 | 1.106 |
| F2r | 25439 | 1.071 | 1.069 | 1.015 | 1.168 | 1.926* | 1.451* | 0.949 | 0.938 | 0.966 | 0.967 |
| Cfl2 | 366624 | 0.86 | 1.166 | 0.707* | 0.757 | 0.405* | 0.633* | 0.954 | 0.895 | 0.753 | 0.888 |
| Pik3r6 | 497932 | 1.325 | 1.222 | 0.938 | 0.675 | 1.894* | 1.897* | 0.915 | 1.18 | 0.903 | 1.07 |
| Cd14 | 60350 | 0.978 | 0.873 | 1.379* | 1.351 | 1.637* | 1.583* | 0.972 | 1.449* | 1.265 | 1.525* |
| Pip4k2a | 116723 | 1.041 | 0.943 | 1.024 | 1.17 | 1.697* | 1.647* | 1.112 | 1.011 | 1.376* | 1.416 |
| Myh7b | 311570 | 0.856 | 0.551 | 0.976 | 0.847 | 0.276* | 0.406* | 1.24 | 1.131 | 1.491 | 1.833 |
| Actc1 | 29275 | 1.188 | 2.623* | 0.421* | 0.335* | 0.293* | 0.568* | 1.171 | 1.065 | 0.86 | 0.785 |
| Pip4k2c | 140607 | 1.154 | 1.301* | 0.917 | 0.869 | 1.539* | 1.007 | 1.109 | 1.103 | 0.88 | 1.165 |
| Ppp1r12b | 304813 | 1.07 | 1.095 | 1.008 | 1.199 | 0.865 | 0.466* | 0.994 | 0.856 | 1.053 | 1.134 |
Results of IPA analysis to evaluate the effects of EX and SPRINT on expression of genes in the actin cytoskeleton signaling canonical pathway. Results are expressed as fold change for the EX (OE) or SPRINT (OI) values relative to that of the sedentary OLETF value for that sample. Thus any entry that is >1.00 (italic font) reflects a gene with increased expression and any entry that is <1.00 (nonitalic font) reflects a gene with decreased expression. The * indicate a value that is significantly changed relative to sedentary OLETF rats (P < 0.01). The Symbol and Gene IDs are from the National Center for Biotechnology Information (NCBI) (http://www.ncbi.nlm.nih.gov/) gene bank and defined therein.
Although not part of the actin cytoskeleton pathway, tubulin, beta 2A class IIa and tubulin, beta 2B class IIb (Tubb2a and Tubb2b, respectively) were increased from 1.3- to 1.9-fold in all gastrocnemius and soleus arterioles by both EX and SPRINT. Tubb 3 (tubulin, beta 3 class III) exhibited increased expression in SFA and WG2a of SPRINT rats and Tubb 4 (Tubulin, beta 4B class IVb) expression was increased 1.4-fold in GFA by SPRINT. Products of tubulin genes are believed to be important in gap junction signaling and in formation of cyto-architecture. Two other genes of interest relative to structural adaptation that exhibited increased expression with exercise training are ankyrin repeat domain 23 (Ankrd23) whose expression was increased by SPRINT in GFA (19.6 fold) and WG2a (1.4 fold) but decreased in RG2a; and mRNA for actin-binding Rho activating protein (Abra) was increased (6.9 fold) in GFA of SPRINT rats.
In contrast to differential effects of training on gene expression of the Actin Cytoskeleton Signaling pathway across different skeletal muscle arterioles, some genes in this pathway exhibited more uniform changes in expression across all five artery samples. For example, SHC transforming protein 1 (Shc1), a growth factor, exhibited similar increases in expression across all five artery samples (some significant increases, some not) with EX (Table 1). Of interest, SPRINT did not significantly alter Shc1 expression in GFA, SFA, or WG2a suggesting that EX increases expression of Shc1 more consistently in skeletal muscle arterioles than does SPRINT. Shc1 is also a component of other IPA canonical pathways examined including ET-1 signaling, insulin receptor signaling, integrin signaling, PLC signaling, PPAR-signaling, renin-angiotensin and the VEGF signaling pathways. Thus it is not possible at this time to determine for which pathway increased Shc1 expression is most important.
The canonical signaling pathway exhibiting the largest number of genes whose expression was changed by EX and/or SPRINT is the protein kinase A signaling pathway (Table 2). As was true of other pathways, the expression of some genes in the protein kinase A signaling pathway was increased across all arteries by EX and SPRINT, some are decreased across all arteries, and some show differential responses to exercise training. Examples of genes in this pathway whose expression was increased by EX and/or SPRINT across all arteries are Desert Hedgehog (Dhh), Adenylate cyclase 4 (Adcy4), and an inhibitor of NF-kappa-B (Nfkbia).
Table 2.
Protein kinase A signaling IPA canonical pathway
| Symbol | GeneID | GFA.OE | GFA.OI | RG2a.OE | RG2a.OI | S2a.OE | S2a.OI | SFA.OE | SFA.OI | WG2a.OE | WG2a.OI |
|---|---|---|---|---|---|---|---|---|---|---|---|
| Nfkbia | 25493 | 1.427* | 1.588* | 1.849* | 1.634* | 1.211 | 1.42* | 1.284 | 1.297 | 1.483* | 1.56* |
| Lipe | 25330 | 1.19 | 1.014 | 0.742 | 0.944 | 0.862 | 0.887 | 1.096 | 1.754* | 1.611 | 1.643 |
| Gys2 | 25623 | 1.693 | 0.458 | 2.414 | 1.788 | 1.925 | 0.688 | 0.763 | 0.773 | 0.622 | 1.085 |
| Ptprc | 24699 | 0.695* | 0.617 | 0.936 | 0.925 | 0.726 | 0.899 | 0.914 | 0.913 | 0.802 | 0.769 |
| Myh10 | 79433 | 0.878 | 0.824 | 0.996 | 0.963 | 1.067 | 0.823 | 0.834 | 0.727 | 0.908 | 0.623* |
| Ywhag | 56010 | 1.222 | 1.189 | 0.932 | 1.186 | 1.108 | 1.041 | 1.383 | 1.356 | 1.089 | 0.935 |
| Ptpn2 | 117063 | 0.816 | 0.957 | 0.979 | 1.133 | 1.304* | 1.535* | 1.08 | 1.017 | 0.949 | 0.777 |
| Ywhab | 56011 | 0.959 | 0.904 | 1.166 | 1.064 | 1.424* | 1.392* | 1.305* | 1.211 | 1.187 | 1.219 |
| Cdc14b | 361195 | 1.457 | 1.514* | 1.531* | 1.379 | 1.49 | 0.98 | 1.421* | 0.974 | 0.918 | 0.936 |
| Crebbp | 54244 | 1.168 | 1.066 | 1.22 | 1.587* | 1.187 | 0.986 | 1.286 | 1.117 | 1.501* | 1.108 |
| Ptch1 | 89830 | 1.506 | 1.062 | 1.177 | 1.169 | 1.8* | 0.871 | 1.101 | 0.901 | 1.114 | 0.839 |
| Prkaca | 25636 | 1.392 | 0.959 | 1.316 | 1.446 | 0.872 | 0.977 | 0.999 | 0.976 | 0.936 | 0.932 |
| Gsk3b | 84027 | 0.849 | 0.761 | 1.148 | 1.463 | 0.9 | 0.719 | 1.245 | 1.013 | 1.314 | 1.09 |
| Prkcz | 25522 | 1.241 | 0.847 | 0.975 | 0.719 | 1.329 | 1.007 | 0.836 | 0.895 | 0.96 | 1.251 |
| Crem | 25620 | 0.481* | 0.591* | 0.759 | 0.792 | 0.797 | 0.766 | 0.657* | 0.727* | 0.749* | 0.61* |
| Myh2 | 691644 | 1.191 | 21.846* | 0.377 | 0.093* | 0.979 | 0.727 | 0.425 | 0.956 | 1.28 | 1.328 |
| Tnni2 | 29389 | 1.105 | 24.514* | 0.319 | 0.11* | 0.471 | 0.551 | 0.674 | 0.785 | 0.952 | 0.997 |
| Mylpf | 24584 | 0.779 | 15.647* | 0.286 | 0.134* | 0.774 | 0.837 | 0.464 | 0.534 | 0.999 | 0.885 |
| Myl1 | 56781 | 1.013 | 5.982* | 0.411 | 0.27* | 0.264* | 0.466 | 1.387 | 1.052 | 1.239 | 1.422 |
| Myh4 | 360543 | 1.787 | 7.867* | 0.198* | 0.069* | 0.396 | 0.165* | 1.271 | 1.899 | 0.551 | 0.948 |
| Gys1 | 690987 | 1.457* | 1.541* | 0.388* | 0.303* | 0.707 | 0.77 | 1.207 | 0.932 | 1.543 | 1.266 |
| Pygm | 24701 | 0.868 | 2.599* | 0.34* | 0.234* | 0.53 | 0.769 | 1.111 | 1.132 | 1.339 | 1.445 |
| Ptk2 | 25614 | 0.891 | 0.967 | 1.057 | 1.166 | 1.668* | 1.1 | 1.066 | 1.025 | 1.043 | 1.106 |
| Ptcd1 | 24655 | 1.192 | 1.127 | 1.009 | 1.011 | 1.516* | 1.297 | 1.091 | 1.154 | 1.169 | 1.043 |
| Dhh | 84380 | 1.937* | 1.481* | 1.948* | 1.892* | 2.108* | 1.996* | 1.376 | 1.564* | 1.656* | 1.389* |
| Gnb4 | 294962 | 1.039 | 1.205 | 0.795 | 0.891 | 2.394* | 2.067* | 0.69 | 1.044 | 0.747 | 0.983 |
| Finb | 306204 | 1.209 | 1.053 | 1.404* | 1.251 | 1.582* | 1.051 | 0.989 | 1.121 | 1.396* | 1.194 |
| Ptprj | 29645 | 1.748 | 1.233 | 0.962 | 1.485 | 2.422* | 1.954* | 1.284 | 1.774* | 1.292 | 1.049 |
| Dusp6 | 116663 | 1.276* | 1.063 | 0.96 | 1.062 | 1.681* | 1.885* | 1.275* | 1.39* | 1.187 | 1.064 |
| Adcy4 | 54223 | 1.3 | 1.278 | 1.1 | 1.183 | 1.779* | 1.399* | 1.202 | 1.492* | 1.361* | 0.965 |
| Eya3 | 313027 | 0.989 | 0.843 | 1.008 | 1.086 | 1.602 | 1.12 | 1.269 | 1.279 | 0.866 | 0.754 |
| Akap10 | 360540 | 1.335 | 1.18 | 1.067 | 1.145 | 1.778 | 0.983 | 1.144 | 0.928 | 0.899 | 0.994 |
| Pygb | 25739 | 1.287 | 1.021 | 0.906 | 0.775 | 1.814 | 1.709 | 1 | 1.067 | 1.644 | 0.988 |
| Gng5 | 79218 | 0.747 | 0.956 | 1.084 | 1.051 | 0.619 | 0.743 | 0.895 | 0.982 | 0.885 | 0.85 |
| Ppp1r14b | 259225 | 0.936 | 1.026 | 1.118 | 1.275 | 1.878 | 1.377 | 0.963 | 1.088 | 0.687 | 0.838 |
| Nfatc3 | 361400 | 0.981 | 0.764 | 1.029 | 0.981 | 1.012 | 0.544 | 0.912 | 0.738 | 1.102 | 1.089 |
| Pdia3 | 29468 | 0.873 | 0.714 | 0.964 | 0.925 | 1.669 | 2.01 | 1.277 | 1.237 | 1.193 | 1.191 |
| Tgfbr1 | 29591 | 0.865 | 0.854 | 1.059 | 1.01 | 1.097 | 0.952 | 0.768 | 0.56 | 0.868 | 0.845 |
| Rhoa | 117273 | 0.83 | 0.949 | 0.934 | 1.058 | 1.263 | 1.398 | 1.36 | 1.391 | 1.164 | 1.193 |
| Tcf7l1 | 312451 | 0.87 | 0.847 | 0.933 | 1.201 | 1.416 | 1.054 | 1.033 | 0.635 | 1.008 | 0.886 |
| Prkar1a | 25725 | 1.207 | 1.271 | 0.941 | 0.929 | 0.952 | 0.976 | 1.276 | 1.551 | 1.247 | 1.111 |
Results of IPA analysis to evaluate the effects of EX and SPRINT on expression of genes in this IPA canonical signaling pathway. Results are expressed as fold change for the EX (OE) or SPRINT (OI) values relative to that of the sedentary OLETF value for that sample. Thus, any entry that is >1.00 (italic font) reflects a gene with increased expression and any entry that is <1.00 (nonitalic font) reflects a gene with decreased expression. Value = 1 (boldface) reflects no change in expression. The * indicate a value that is significantly changed relative to sedentary OLETF rats (P < 0.01). The Symbol and Gene IDs are from the National Center for Biotechnology Information (NCBI) (http://www.ncbi.nlm.nih.gov/) gene bank and defined therein.
The endothelin-1 signaling pathway (Table 3) also contained a number of genes showing altered expression due to EX and/or SPRINT in some cases in all arterioles examined and in others only in select arterioles. Expression of G protein-coupled receptor binding protein (G protein), alpha transducing activity polypeptide 1 (Gnat1) shows increased expression in GFA, RG2a, WG2a, and SFA with EX and SPRINT. EX-S2a arterioles also show increased expression of Gnat1, but there was no change in SPRINT-S2a arterioles. EX and/or SPRINT also increased expression of endothelin converting enzyme (Ece1) in GFA, S2a, SFA, and WG2a. Of interest, MAPK6 (Mapk6), which is activated following insulin stimulation, showed decreased expression or no change in expression across all five arterioles/arteries with both EX and SPRINT. Myelocytomatosis oncogene (Myc) expression is not altered by EX or SPRINT in the GFA, RG2a, or WG2a arterioles but is increased ∼2-fold in the SFA and S2a by both EX and SPRINT. Also, calsequestrin 1 (Casq1) expression was decreased in RG2a, WG2a, SFA, and S2a by both EX and SPRINT, but Casq1 expression did not change in the GFA with EX and increased expression sixfold in SPRINT.
Table 3.
ET-1 signaling IPA canonical pathway
| Symbol | GeneID | GFA.OE | GFA.OI | RG2a.OE | RG2a.OI | S2a.OE | S2a.OI | SFA.OE | SFA.OI | WG2a.OE | WG2a.OI |
|---|---|---|---|---|---|---|---|---|---|---|---|
| Shc1 | 85385 | 1.425* | 1.143 | 1.427* | 1.44* | 1.704* | 1.447* | 1.251 | 1.136 | 1.287 | 1.073 |
| Fos | 314322 | 0.712 | 0.745 | 0.592 | 0.452 | 1.518 | 1.213 | 1.228 | 0.863 | 0.397* | 0.602 |
| Pla2 g5 | 29354 | 0.75 | 0.841 | 0.804 | 0.898 | 1.315 | 1.559 | 0.843 | 0.838 | 0.998 | 1.047 |
| Prkcz | 25522 | 1.241 | 0.847 | 0.975 | 0.719 | 1.329 | 1.007 | 0.836 | 0.895 | 0.96 | 1.251 |
| Prdx6 | 94167 | 0.845 | 1.182 | 1.134 | 1.143 | 0.907 | 0.93 | 1.15 | 0.986 | 0.831 | 1.067 |
| Casq1 | 686019 | 0.896 | 6.142* | 0.263* | 0.167* | 0.432 | 0.587 | 0.679 | 0.668 | 0.769 | 0.684 |
| Plcd1 | 24655 | 1.192 | 1.127 | 1.009 | 1.011 | 1.516* | 1.297* | 1.091 | 1.154 | 1.169 | 1.043 |
| Pla2 g16 | 24913 | 0.748 | 0.748 | 0.864 | 0.872 | 0.473* | 0.742 | 0.779 | 0.773 | 0.717 | 0.75 |
| Myc | 24577 | 1.119 | 0.956 | 1.192 | 1 | 1.909* | 2.038* | 1.565* | 2.051* | 1.152 | 1.019 |
| Adcy4 | 54223 | 1.3 | 1.278* | 1.1 | 1.183 | 1.779* | 1.399* | 1.202 | 1.492* | 1.361* | 0.965 |
| Pik3r6 | 497932 | 1.325 | 1.222 | 0.938 | 0.675 | 1.894* | 1.897* | 0.915 | 1.18 | 0.903 | 1.07 |
| Pld4 | 362792 | 0.83 | 0.697* | 0.865 | 0.746 | 1.017 | 2.041* | 0.756 | 0.937 | 1.401 | 0.809 |
| Pdia3 | 29468 | 0.873 | 0.714 | 0.964 | 0.925 | 1.669* | 2.01* | 1.277 | 1.237 | 1.193 | 1.191 |
| Mapk6 | 58840 | 0.959 | 0.886 | 0.578* | 0.55* | 0.718* | 0.467* | 0.718 | 0.84 | 0.959 | 0.72 |
| Gnat1 | 363143 | 1.59* | 1.869* | 2.06* | 1.909* | 1.84* | 0.837 | 2.604* | 2.264* | 2.744* | 1.943 |
| Ece1 | 94204 | 1.612 | 1.284 | 0.938 | 0.882 | 1.756* | 1.368 | 1.335 | 2.065* | 1.444 | 1.039 |
Results of IPA analysis to evaluate the effects of EX and SPRINT on expression of genes in this IPA Canonical pathway. Results are expressed as fold change for the EX (OE) or SPRINT (OI) values relative to that of the sedentary OLETF value for that sample. Thus, any entry that is >1.00 (italic font) reflects a gene with increased expression and any entry that is <1.00 (nonitalic font) reflects a gene with decreased expression. Value = 1 (boldface) reflects no change in expression. The * indicate a value that is significantly changed relative to sedentary OLETF rats (P < 0.01). The Symbol and Gene IDs are from the National Center for Biotechnology Information (NCBI) (http://www.ncbi.nlm.nih.gov/) gene bank and defined therein.
Because we previously observed exercise training induced changes in eNOS (Nos3) expression (41–45), we examined the eNOS Signaling pathway (Table 4). Nos3 mRNA expression was significantly increased only in RG2a by SPRINT and in the WG2a by EX, and Akt1 expression was increased by EX in WG2a. EX and SPRINT increased expression of heat shock proteins Hspa5 and Hsp90b1 as both were increased in RG2a, WG2a, SFA, and S2a, and Hspa5 was increased in GFA by SPRINT. Also, PKG1 (Prkg1) showed decreased expression in S2a, SFA, with both EX and SPRINT, while WG2a showed decreased PKG1 expression with EX. Expression of the phosphoinositide-3-kinase subunit 6 (Pik3r6) was increased in GFA, SFA, and S2a with both EX and SPRINT while only EX increased expression of this gene in WG2a. Protein kinase, cAMP-dependent, regulatory, type 1 alpha (Prkar1a) exhibited increased expression in GFA and SFA of both EX and SPRINT rats. EX also increased expression of Prkar1a in the WG2a. In the Production of NO and ROS canonical signaling pathway, Rhoa and Rhott (RAS homolog family member T2) showed increased expression in SFA and S2a with both EX and SPRINT (Table 5). Thus these results indicate that both EX and SPRINT increase expression of genes involved in production of, and signaling by, NO in the skeletal muscle arterioles, but these changes are not uniform across arterioles. Also, caveolin 1 (Cav1) expression was increased 1.4-fold in the GFA of SPRINT rats. This is striking in that this gene is highly expressed in GFA of sedentary OLETF rats. Of interest, a member of the VEGF signaling pathway, Bcl2l1, exhibited increased expression in all of the arterioles of SPRINT rats whereas expression of this gene was increased only in the S2a and SFA of EX rats.
Table 4.
eNOS signaling IPA canonical pathway
| Symbol | GeneID | GFA.OE | GFA.OI | RG2a.OE | RG2a.OI | S2a.OE | S2a.OI | SFA.OE | SFA.OI | WG2a.OE | WG2a.OI |
|---|---|---|---|---|---|---|---|---|---|---|---|
| Lpar4 | 302378 | 0.714 | 0.571* | 0.651 | 0.735 | 1.135 | 0.737 | 1.37 | 0.691 | 0.913 | 0.576* |
| Akt1 | 24185 | 1.127 | 1.096 | 1.171 | 1.067 | 1.026 | 0.902 | 0.996 | 0.92 | 1.551* | 1.36 |
| Prkaca | 25636 | 1.392 | 0.959 | 1.316 | 1.446 | 0.872 | 0.977 | 0.999 | 0.976 | 0.936 | 0.932 |
| Hspa5 | 25617 | 1.023 | 1.319* | 1.306* | 1.329* | 1.486* | 1.884* | 1.654* | 2.047* | 1.024 | 1.252* |
| Prkcz | 25522 | 1.241 | 0.847 | 0.975 | 0.179 | 1.329 | 1.007 | 0.836 | 0.895 | 0.96 | 1.251 |
| Aqp4 | 25293 | 1.39 | 2.336 | 0.072* | 0.066* | 0.643 | 0.318 | 0.787 | 1.141 | 1.258 | 1.056 |
| Hsp90b1 | 362862 | 1.063 | 1.015 | 1.277* | 1.298* | 1.378* | 1.484* | 1.242* | 1.145 | 1.194* | 1.063 |
| Prkg1 | 54286 | 0.921 | 1.039 | 0.832 | 0.758 | 0.469* | 0.559* | 0.675 | 0.614* | 0.53* | 0.908 |
| Adcy4 | 54223 | 1.3 | 1.278 | 1.1 | 1.183 | 1.779* | 1.399* | 1.202 | 1.492* | 1.361* | 0.965 |
| Pik3r6 | 497932 | 1.325 | 1.222 | 0.938 | 0.675 | 1.894* | 1.897* | 0.915 | 1.18 | 0.903 | 1.07 |
| Prkar1a | 25725 | 1.207* | 1.271* | 0.941 | 0.929 | 0.952 | 0.976 | 1.276* | 1.551* | 1.247* | 1.111 |
Results of IPA analysis to evaluate the effects of EX and SPRINT on expression of genes in this IPA canonical pathway. Results are expressed as fold change for the EX (OE) or SPRINT (OI) values relative to that of the sedentary OLETF value for that sample. Thus, any entry that is >1.00 (italic font) reflects a gene with increased expression and any entry that is <1.00 (nonitalic font) reflects a gene with decreased expression. The * indicate a value that is significantly changed relative to sedentary OLETF rats (P < 0.01). The Symbol and Gene IDs are from the National Center for Biotechnology Information (NCBI) (http://www.ncbi.nlm.nih.gov/) gene bank and defined therein.
Table 5.
Production of NO and ROS IPA canonical pathway
| Symbol | GeneID | GFA.OE | GFA.OI | RG2a.OE | RG2a.OI | S2a.OE | S2a.OI | SFA.OE | SFA.OI | WG2a.OE | WG2a.OI |
|---|---|---|---|---|---|---|---|---|---|---|---|
| Nfkbia | 25493 | 1.427* | 1.588* | 1.849* | 1.634* | 1.211 | 1.42* | 1.284 | 1.297 | 1.483* | 1.56* |
| Rbp4 | 25703 | 1.07 | 0.695 | 1.003 | 1.04 | 1.614 | 2.345* | 1.071 | 1.27 | 1.102 | 1.379 |
| Ppp2cb | 24673 | 0.926 | 0.886 | 1.463* | 1.331* | 1.181 | 0.894 | 1.231 | 0.867 | 0.938 | 0.95 |
| Map3k12 | 25579 | 1.276 | 1.098 | 1.251 | 1.198 | 1.234 | 1.168 | 1.142 | 1.091 | 1.127 | 0.958 |
| Fos | 314322 | 0.712 | 0.745 | 0.592 | 0.452* | 1.518 | 1.213 | 1.228 | 0.863 | 0.397* | 0.602 |
| Akt1 | 24185 | 1.127 | 1.096 | 1.171 | 1.067 | 1.026 | 0.902 | 0.996 | 0.92 | 1.551* | 1.36 |
| Crebbp | 54244 | 1.168 | 1.066 | 1.22 | 1.587* | 1.187 | 0.986 | 1.286 | 1.117 | 1.501* | 1.108 |
| Rac1 | 363875 | 0.931 | 0.902 | 1.327 | 1.532* | 1.49* | 1.144 | 0.924 | 0.931 | 1.054 | 0.923 |
| Map3k7 | 313121 | 1.012 | 0.839 | 1.119 | 1.056 | 1.031 | 0.764 | 0.913 | 0.708 | 0.98 | 1.006 |
| Prkcz | 25522 | 1.241 | 0.847 | 0.975 | 0.719 | 1.329* | 1.007 | 0.836 | 0.895 | 0.96 | 1.251 |
| Ppp2r1a | 117281 | 0.854 | 1.117 | 1.118 | 0.99 | 0.699* | 0.857 | 1.157 | 1.094 | 1.101 | 0.999 |
| Pik3r6 | 497932 | 1.325 | 1.222 | 0.938 | 0.675 | 1.894* | 1.897* | 0.915 | 1.18 | 0.903 | 1.07 |
| Arg2 | 29215 | 1.178 | 1.263 | 1.021 | 1.189 | 1.648* | 1.214 | 1.875* | 1.425* | 0.983 | 0.841 |
| Stat1 | 25124 | 0.941 | 0.822 | 0.824 | 0.905 | 0.688* | 0.843 | 0.81 | 0.857 | 0.876 | 0.902 |
| Ppp1r14b | 259225 | 0.936 | 1.026 | 1.118 | 1.275 | 1.878* | 1.377 | 0.963 | 1.088 | 0.687 | 0.838 |
| Map3k6 | 313022 | 1.148 | 1.193 | 1.615 | 1.461 | 1.587* | 1.475 | 1.348 | 2.127* | 1.639* | 2.023* |
| Rhoa | 117273 | 0.88 | 0.949 | 0.934 | 1.058 | 1.263* | 1.398* | 1.36* | 1.391* | 1.164 | 1.193 |
| Rhot2 | 287156 | 1.422 | 1.408 | 1.026 | 0.878 | 0.806 | 1.118 | 1.612* | 1.811* | 1.406* | 1.199 |
Results of IPA analysis to evaluate the effects of EX and SPRINT on expression of genes in this IPA canonical pathway. Results are expressed as fold change for the EX (OE) or SPRINT (OI) values relative to that of the sedentary OLETF value for that sample. Thus, any entry that is >1.00 (italic font) reflects a gene with increased expression and any entry that is <1.00 (nonitalic font) reflects a gene with decreased expression. The * indicate a value that is significantly changed relative to sedentary OLETF rats (P < 0.01). The Symbol and Gene IDs are from the National Center for Biotechnology Information (NCBI) (http://www.ncbi.nlm.nih.gov/) gene bank and defined therein.
Because the Nrf2 mediated oxidative stress response canonical pathway was significantly affected by EX and SPRINT and because Nrf2 (a nuclear transcription factor that enhances antioxidant defenses and counteracts oxidative stress) is considered to attenuate cardiovascular disease (59), we analyzed the effects of EX and SPRINT on this canonical pathway. As shown in Table 6, the expression of a number of these genes was decreased in the soleus (S2a and SFA) with little effect on gene expression in the gastrocnemius arterioles. Expression of the FK506 binding protein that works with glucocorticoid receptors (Fkbp5) was increased in all skeletal muscle arterioles. Among the genes in the hypoxia signaling pathway, small ubiquitin-like modifier 1 (Sumo1) showed decreased expression in S2a, SFA, and WG2a of EX and SPRINT trained rats but exhibited increased expression in SPRINT-RG2a.
Table 6.
NRF2-mediated oxidative stress responses
| Symbol | GeneID | GFA.OE | GFA.OI | RG2a.OE | RG2a.OI | S2a.OE | S2a.OI | SFA.OE | SFA.OI | WG2a.OE | WG2a.OI |
|---|---|---|---|---|---|---|---|---|---|---|---|
| Fkbp5 | 361810 | 1.492 | 2.293* | 2.062* | 3.142* | 1.274 | 1.522 | 1.879* | 3.179* | 1.404 | 2.891* |
| Fmo1 | 25256 | 0.893 | 0.907 | 1.173 | 1.094 | 0.921 | 1.243 | 0.897 | 0.811 | 1.034 | 1.01 |
| Map2k6 | 114495 | 0.89 | 0.9 | 0.849 | 0.791 | 0.829 | 0.791 | 0.795 | 0.877 | 1.321 | 1.136 |
| Actb | 81822 | 0.911 | 1.087 | 0.933 | 0.903 | 1.129 | 1.268 | 0.965 | 1.124 | 1.163 | 1.055 |
| Crebbp | 54244 | 1.168 | 1.066 | 1.22 | 1.587* | 1.187 | 0.986 | 1.286 | 1.117 | 1.501* | 1.108 |
| Herpud1 | 85430 | 1.182 | 1.216 | 1.16 | 1.186 | 1.227 | 1.413* | 1.289 | 1.638* | 1.203 | 1.643* |
| Dnajb2 | 689593 | 1.152 | 1.316* | 0.919 | 0.862 | 1.277 | 1.027 | 1.007 | 1.067 | 0.912 | 1.13 |
| Dnaja1 | 65028 | 0.776 | 1.277 | 1.11 | 1.423 | 0.997 | 1.374 | 1.017 | 1.379 | 0.823 | 1.101 |
| Prkcz | 25522 | 1.241 | 0.847 | 0.975 | 0.719 | 1.329 | 1.007 | 0.836 | 0.895 | 0.96 | 1.251 |
| Sod3 | 25352 | 1.175 | 1.029 | 1.058 | 0.899 | 1.33 | 1.468 | 1.184 | 1.192 | 1.299 | 1.398 |
| Fos | 314322 | 0.712 | 0.745 | 0.592 | 0.452* | 1.518 | 1.213 | 1.228 | 0.863 | 0.397* | 0.602 |
| Akt1 | 24185 | 1.127 | 1.096 | 1.171 | 1.067 | 1.026 | 0.902 | 0.996 | 0.92 | 1.551* | 1.36 |
| Map3k7 | 313121 | 1.012 | 0.839 | 1.119 | 1.056 | 1.031 | 0.764 | 0.913 | 0.708* | 0.98 | 1.006 |
| Jund | 24518 | 1.267 | 1.031 | 1.268 | 1.63 | 1.752* | 1.436 | 1.193 | 1.061 | 1.14 | 1.039 |
| Gsk3b | 84027 | 0.849 | 0.761 | 1.148 | 1.463 | 0.9 | 0.719 | 1.245 | 1.013 | 1.314 | 1.09 |
| Actg2 | 25365 | 1.283 | 1.309 | 1.318 | 1.392 | 0.897 | 0.924 | 1.051 | 0.722 | 1.092 | 1.186 |
| Actg1 | 287876 | 0.929 | 1.011 | 0.86 | 0.922 | 0.93 | 0.976 | 1.051 | 1.078 | 0.933 | 0.927 |
| Fth1 | 25319 | 0.758 | 0.859 | 0.853 | 0.877 | 0.807 | 1.164 | 0.928 | 0.837 | 1.343 | 1.362 |
| Enc1 | 294674 | 1.141 | 1.128 | 1.285 | 2.14* | 2.255* | 1.759* | 1.63* | 2.196* | 1.353 | 1.041 |
| Prdx1 | 117254 | 0.732 | 0.859 | 0.994 | 1.235 | 0.547* | 0.672* | 0.717* | 0.799 | 0.706* | 0.828 |
| Pik3r6 | 497932 | 1.325 | 1.222 | 0.938 | 0.675 | 1.894* | 1.897* | 0.915 | 1.18 | 0.903 | 1.07 |
| Dnajc15 | 290370 | 0.855 | 1.184 | 0.94 | 1.122 | 0.389* | 0.589* | 1.001 | 0.706 | 0.785 | 0.874 |
| Actc1 | 29275 | 1.188 | 2.623 | 0.421 | 0.335 | 0.293* | 0.568* | 1.171 | 1.065 | 0.86 | 0.785 |
| Gstp1 | 24426 | 0.832 | 0.903 | 0.919 | 1.007 | 0.639* | 0.805 | 0.724* | 0.709* | 0.86 | 1.105 |
| Mgst3 | 289197 | 0.73 | 1.025 | 0.793 | 0.834 | 0.289* | 0.577 | 0.596 | 0.65 | 0.912 | 0.985 |
| Ephx1 | 25315 | 0.867 | 1.064 | 0.957 | 1.179 | 0.506* | 0.685* | 0.593* | 0.619* | 0.831 | 0.895 |
| Mgst2 | 295037 | 0.754 | 0.74 | 0.873 | 1.108 | 1.25 | 1.11 | 0.474* | 0.515* | 0.93 | 0.962 |
| Gsta2 | 24422 | 0.731 | 0.934 | 1.126 | 1.109 | 0.675 | 0.717 | 0.723 | 0.611* | 0.762 | 0.658 |
| Stip1 | 192277 | 0.955 | 1.281 | 1.188 | 1.524* | 1.164 | 1.355* | 1.303 | 1.647* | 0.865 | 0.971 |
Results of IPA analysis to evaluate the effects of EX and SPRINT on expression of genes in this IPA canonical pathway. Results are expressed as fold change for the EX (OE) or SPRINT (OI) values relative to that of the sedentary OLETF value for that sample. Thus any entry that is >1.00 (italic font) reflects a gene with increased expression and any entry that is <1.00 (nonitalic font) reflects a gene with decreased expression. The * indicate a value that is significantly changed relative to sedentary OLETF rats (P < 0.01). The Symbol and Gene IDs are from the National Center for Biotechnology Information (NCBI) (http://www.ncbi.nlm.nih.gov/) gene bank and defined therein.
Both EX and SPRINT altered the expression of a number of genes in the Protein Ubiquitination Pathway (Table 7). It is of interest that the SFA (18 genes), S2a (34 genes), and WG2a (22) showed greater numbers of ubiquitination pathway genes with altered expression in EX and SPRINT groups than did the GFA (7 genes) and RG2a (14 genes) (Table 7). Equally interesting is the observation that EX induced greater alteration of expression of ubiquitination pathway genes in S2a (22 genes) and WG2a (15 genes) than did SPRINT in S2a (12 genes) and WG2a (7 genes). EX resulted in decreased expression of 18 genes in the ubiquitination pathway in S2a and decreased expression of 13 genes in this pathway in WG2a. SPRINT also primarily resulted in decreased expression of genes in this pathway vs. increased expression. There were 12 genes coding for proteins in the proteasome complexes that exhibited altered expression in EX and/or SPRINT (Table 7). Of interest, expression of these genes in the skeletal muscle arterioles was either decreased or not changed in 11 of these genes, only Psmd5 (proteasome 26S subunit, non-ATPase 5) exhibited increased expression in the S2a and SFA of SPRINT and in the SFA of EX (the WG2a-EX and -SPRINT and S2a-EX exhibited increased expression but P > 0.05). It is apparent in Table 7 that these changes in proteasome complex-related genes appeared more prominent in the WG2a, S2a, and SFA than in the GFA and RG2a. Consistent with this observation, IPA analysis determined that the Protein Ubiquitination Pathway was a top canonical pathway in the WG2a and S2a of EX rats. Ubd expression was decreased by EX and SPRINT in all arterioles studied. Cul1 expression was decreased in RG2a by both EX and SPRINT and in S2a by SPRINT.
Table 7.
Protein ubiquitination canonical pathway
| Symbol | GeneID | GFA.OE | GFA.OI | RG2a.OE | RG2a.OI | S2a.OE | S2a.OI | SFA.OE | SFA.OI | WG2a.OE | WG2a.OI |
|---|---|---|---|---|---|---|---|---|---|---|---|
| Birc6 | 313876 | 1.12 | 0.888 | 1.368* | 1.424* | 1.177 | 1.02 | 1.12 | 0.897 | 1.102 | 1.023 |
| Usp28 | 315639 | 0.957 | 1.142 | 0.75 | 0.928 | 1.424 | 0.939 | 1.181 | 1.189 | 0.892 | 0.873 |
| Ube4b | 298652 | 1.275* | 0.883 | 1.163 | 1.293 | 1.11 | 1.042 | 0.966 | 0.889 | 0.843 | 0.954 |
| Dnajb2 | 689593 | 1.152 | 1.316* | 0.919 | 0.862 | 1.277 | 1.027 | 1.007 | 1.067 | 0.912 | 1.13 |
| Usp1 | 313387 | 0.987 | 0.848 | 0.99 | 1.126 | 1.21 | 0.906 | 1.028 | 1.059 | 0.934 | 1.21 |
| Dnaja1 | 65028 | 0.776 | 1.277 | 1.11 | 1.423 | 0.997 | 1.374 | 1.017 | 1.379 | 0.823 | 1.101 |
| Hspa5 | 25617 | 1.023 | 1.319* | 1.306* | 1.329* | 1.486* | 1.884* | 1.654* | 2.047* | 1.024 | 1.252 |
| Ube4a | 315608 | 1.162 | 1.023 | 1.055 | 1.265 | 1.119 | 0.96 | 0.889 | 0.759* | 0.962 | 1.048 |
| Usp7 | 360471 | 1.079 | 1.07 | 1.122 | 1.091 | 1.458* | 1.097 | 1.088 | 1.223 | 1.163 | 1.111 |
| Psme1 | 29630 | 0.851 | 0.94 | 0.916 | 1.05 | 0.761* | 0.898 | 0.87 | 0.851 | 0.809 | 0.868 |
| Usp42 | 288482 | 1.185 | 0.978 | 1.332 | 1.3 | 1.24 | 0.964 | 0.932 | 0.87 | 1.062 | 1.221 |
| Usp47 | 308896 | 1.026 | 0.979 | 1.039 | 0.974 | 0.647* | 0.587* | 0.806 | 0.878 | 0.904 | 0.909 |
| Psma3 | 29670 | 0.899 | 1.102 | 1.03 | 1.076 | 0.813* | 0.811* | 0.961 | 0.825* | 0.774* | 0.844* |
| Ube2j2 | 298689 | 1.145 | 1.067 | 1.178 | 1.178 | 1.24 | 1.368* | 1.281 | 1.364* | 1.166 | 1.353* |
| Cul1 | 362356 | 0.922 | 0.842 | 0.685* | 0.745* | 0.866 | 0.817* | 0.907 | 0.97 | 1.117 | 1.02 |
| Psmb3 | 29676 | 0.948 | 0.932 | 1.061 | 1.193 | 0.662* | 0.8 | 0.784 | 0.782 | 0.812 | 0.832 |
| Cryab | 25420 | 1.163 | 1.289 | 0.821 | 0.895 | 0.259* | 0.769 | 1.457 | 0.865 | 0.813 | 0.759 |
| Usp18 | 312688 | 0.63* | 0.606* | 0.81 | 0.613 | 0.484* | 0.526* | 0.74 | 0.561* | 0.747 | 0.519* |
| Dnajc15 | 290370 | 0.855 | 1.184 | 0.94 | 1.122 | 0.389* | 0.589* | 1.001 | 0.706 | 0.785 | 0.874 |
| Skp1 | 287280 | 0.819 | 1.17 | 0.861 | 1.03 | 0.524* | 0.701* | 0.802 | 0.71* | 0.663* | 0.852 |
| Tceb1 | 64525 | 0.976 | 0.929 | 1.053 | 1.303* | 0.676* | 0.834 | 0.829 | 0.8* | 0.792 | 0.88 |
| Ubd | 29168 | 0.382* | 0.478 | 0.225* | 0.313* | 0.112* | 0.37* | 0.211* | 0.162* | 0.256* | 0.26* |
| Dnajc24 | 362184 | 0.763 | 0.747 | 1.19 | 1.262 | 0.419* | 0.816 | 0.795 | 0.626* | 0.578* | 0.735 |
| Hsp90b1 | 362862 | 1.063 | 1.015 | 1.277* | 1.298* | 1.378* | 1.484* | 1.242* | 1.145 | 1.194* | 1.063 |
| Psmb2 | 29675 | 0.812 | 0.929 | 0.922 | 1.068 | 0.663* | 0.748 | 0.757 | 0.729* | 0.773 | 0.816 |
| Psmd12 | 287772 | 0.856 | 1.177 | 0.882 | 0.913 | 0.624* | 0.85 | 0.857 | 1.027 | 0.831 | 0.85 |
| Psma5 | 29672 | 0.832 | 0.934 | 0.997 | 1.198 | 0.695* | 0.859 | 0.768* | 0.931 | 0.763* | 0.785 |
| Psmb1 | 94198 | 0.866 | 1.117 | 0.944 | 1.204 | 0.683* | 0.885 | 0.703* | 0.75* | 0.768* | 0.863 |
| Usp46 | 289584 | 1.092 | 1.042 | 1.299 | 1.526* | 1.574* | 1.154 | 1.129 | 1.058 | 1.554* | 0.89 |
| Psma2 | 29669 | 0.873 | 1 | 1.02 | 1.24 | 0.642* | 0.802 | 0.796 | 0.738* | 0.772* | 0.829 |
| Birc2 | 60371 | 0.793* | 0.945 | 1.05 | 1.072 | 0.742* | 0.773* | 1.086 | 1.09 | 0.75* | 0.742* |
| Psmd5 | 296651 | 1.371 | 0.86 | 1.049 | 0.847 | 1.323 | 1.76* | 1.753* | 2.409* | 1.439 | 1.48 |
| Uchl1 | 29545 | 0.747 | 1.206 | 0.584 | 0.451* | 0.585 | 1.063 | 0.881 | 0.896 | 0.265* | 0.543 |
| Dnajc12 | 619393 | 0.89 | 0.816 | 0.943 | 0.836 | 0.8 | 0.81 | 0.938 | 0.724 | 0.462* | 0.526* |
| Psma4 | 29671 | 0.889 | 0.979 | 0.991 | 1.028 | 0.93 | 0.917 | 1.067 | 0.862 | 0.702* | 0.778* |
| Psmd14 | 311078 | 0.826 | 1.098 | 0.878 | 0.999 | 0.741* | 0.755 | 0.925 | 0.87 | 0.642* | 0.81 |
| Psmc2 | 25581 | 0.854 | 0.962 | 1.01 | 1.058 | 0.919 | 1.115 | 0.894 | 0.909 | 0.67* | 0.776* |
Results of IPA analysis to evaluate the effects of EX and SPRINT on expression of genes in this IPA canonical pathway. Results are expressed as fold change for the EX (OE) or SPRINT (OI) values relative to that of the sedentary OLETF value for that sample. Thus, any entry that is >1.00 (italic font) reflects a gene with increased expression and any entry that is <1.00 (nonitalic font) reflects a gene with decreased expression. Value = 1 (boldface) reflects no change in expression. The * indicate a value that is significantly changed relative to sedentary OLETF rats (P < 0.01). The Symbol and Gene IDs are from the National Center for Biotechnology Information (NCBI) (http://www.ncbi.nlm.nih.gov/) gene bank and defined therein.
The WntI2-catenin Signaling pathway analysis revealed decreased expression of Ubd, a gene coding for protein involved in antigen processing and presentation (FAT10) for activating NF-kB. Ubd is decreased in all arteries by both EX and SPRINT. Myc expression was increased by EX and SPRINT in SFA and S2a. Expression of frizzled related protein (Frzb), a G protein-coupled receptor for Wnt signaling, was decreased in GFA by SPRINT as was frizzled family receptors 1 (Fzd1) and 8 (Fzd8). Similarly, in the SFA SPRINT exhibited decreased expression of Sfrp2 (secreted frizzled-related protein 2). WNT1 inducible signaling pathway protein (Wisp2) was increased in GFA, RG2a, SFA, and S2a by SPRINT. EX also increased Wisp2 in GFA, RG2a, and SFA and Wisp1 in S2a. Also, casein kinase 1, gamma 1 (Csnk1g1) exhibited decreased expression in SFA but increased expression in the S2a of EX and SPRINT rats.
In summary, canonical signaling pathway analysis revealed that EX induces increased expression of the following genes in all arteries examined: Shc1, desert hedgehog protein (Dhh), adenylate cyclase 4 (Adcy4), G protein binding protein, alpha (Gnat1), and Bcl2l1, a protein that is a member of the VEGF signaling pathway. Also, EX induced decreased expression of ubiquitin D (Ubd) and cAMP response element modulator (Crem) in all five skeletal muscle arteries examined. EX increased expression of endothelin converting enzyme (Ece1), Hsp90b, Fkbp5, and Cdcl4b in four arterioles. Based on canonical signaling pathway analysis, SPRINT had similar effects on expression of Crem, Dhh, Bcl2l1, and Ubd in all arterioles examined. In addition SPRINT increased expression of Nfkbia, Hspa5, Tubb 2a and Tubb 2b, and Fkbp5 in all five skeletal muscle arterioles and increased expression of Gnat1 in all but the S2a arterioles. Expression of genes considered markers of development of atherosclerosis was also influenced by exercise training. For example, vascular cell adhesion molecule 1 (VCAM1) expression was decreased 50% by EX in GFA.
Exercise training induces differential changes in gene expression across skeletal muscle arterioles.
Consideration of how phenotype is changed in the different skeletal muscle arteries/arterioles by EX and SPRINT as reflected in our entire data set provides some interesting observations. For example, the GFA exhibits SPRINT-induced changes in expression of a number of genes related to the contractile component of smooth muscle including myosin-related genes as shown in the center of Fig. 3 [Myo1a, Myh2, Myh3, Myh4, Myf6, Myl1, Myl3, Mylip, Mylpf, Myom2, Mybpc2, Myot (myotilin, a sarcomeric protein that binds to alpha-actinin at the Z-Line)], actin-related genes [Xirp2, Acta1, Actc1, Actn3, Myoz1 (Myozenins, may serve as intracellular binding proteins involved in linking Z-disk proteins such as alpha-actinin, gamma-filamin)], troponin (Tnnc2, Tnni2, Tnnt2), and tubulin-related genes (Tubb2a, Tubb2b, Tubb4). Also shown in Fig. 3, SPRINT altered expression of other genes related to structure of the artery including collagen (Col5a3, Col3a1, Col1a2, expression decreased), Plod3, Has2 (hyaluronan synthase-2), TIMP metallopeptidase inhibitor 2 (Timp2), and genes that may signal vascular remodeling including Ankrd23 and Abra. Last, Fig. 3 shows that SPRINT also altered expression of ion channels in GFA including sodium channel, voltage-gated, type IV, beta subunit (Scn4b); potassium inwardly rectifying channel, subfamily J, member 11 (Kenj11); potassium voltage-gated channel, shaker-related subfamily member 5 (Kcna5); potassium intermediate/small conductance calcium-activated channel, subfamily N, member 4 (Kcnn4); anoctamin 1, calcium activated chloride channel (Ano1); gap junction protein, alpha 5 (Gja5); sodium channel and calthrin linker 1 (Sclt1); potassium channel tetramerization domain containing 3 (Kcdt3); and transient receptor potential cation channel, subfamily V, member 4 (Trpv4) (Fig. 3).
Fig. 3.

Patterns of altered gene expression in feed arteries (GFA and SFA) and in various arterioles of gastrocnemius muscle and soleus muscles of Otsuka Long Evans Tokushima Fatty (OLETF) rats following interval sprint training (SPRINT). Fold change in gene expression is shown relative to expression level of sedentary OLETF rats. Results of different arterioles and feed arteries can be compared for the different categories of genes listed across the top of the figure. For example note in the middle panel how gene expression is increased in GFA for actin-related, myosin-related, and troponin (Tnn) genes whereas expression of these same genes is decreased in the RG2a and S2a and relatively unchanged in the SFA and WG2a.
Comparison of the pattern of changes in gene expression in the GFA and RG2a as shown in Fig. 3 indicates that SPRINT induced a much different pattern of gene expression changes in RG2a than that seen in GFA. Thus while SPRINT altered expression of a number of genes related to the contractile component of smooth muscle, SPRINT induced decreased expression of the actin-related, arterial structure-related genes, myosin-related, and Tnn-related genes, just the opposite of changes induced by SPRINT in GFA (Fig. 3). In the RG2a SPRINT decreased expression of Abra and Ankrd23 (Fig. 3). In WG2a there were little to no changes in the expression of these genes and although SPRINT did not alter expression of collagen genes in the WG2a, expression of fibronectin type III and SPRY domain containing 2 (Fsd2) genes were decreased (Fig. 3). SPRINT also increased expression of Ankrd23 in WG2a but did not alter expression of Abra, and there were no significant changes in expression of mRNA for myosin-related, actin-related, or troponin-related proteins in the WG2a (Fig. 3). In the RG2a SPRINT decreased expression of Abra and Ankrd23 (Fig. 3).
SPRINT also altered expression of ion channels in RG2a and WG2a skeletal muscle arterioles (Fig. 3). Although the patterns of SPRINT-induced changes in ion channel gene expression was clearly different among the GFA, RG2a, and WG2a arterioles, the differences were not as great as for genes coding for contractile/structural proteins (Fig. 3). SPRINT caused similar effects on expression of genes coding for signaling pathways and Mapk genes of the GFA, RG2a, and WG2a (Fig. 3). Importantly, in RG2a SPRINT had no effect on the expression of RNA for the potassium channels whose expression was altered by SPRINT in the GFA. Thus, while SPRINT altered expression of 368 genes in RG2a, 247 genes in the GFA, and 147 genes in the WG2a, the phenotypic effects of SPRINT on these three vessels is quite different (Fig. 3). These results demonstrate that SPRINT induced different phenotypic changes in these three different arteries of the gastrocnemius muscle. The differences between the changes in mRNA among gastrocnemius arterioles are striking (Fig. 3).
Figure 3 also illustrates the observation that the phenotypic effects of SPRINT were also different in arterioles of the soleus muscle than in the gastrocnemius muscle, and overall the magnitude of changes in gene expression was less in soleus arterioles than in gastrocnemius. The SFA exhibited SPRINT-induced changes in expression of 513 genes, yet there was only one myosin-related gene whose expression was altered in the SFA [myosin regulatory light chain interacting protein (Mylip) expression was decreased]. Also, SPRINT did not alter the expression of any SFA actin-related genes. SPRINT decreased expression of one troponin gene (Tnnt2), but increased expression of tropomyosin (Tpm4), and of tubulin-related genes (Tubb3, Tubb6, Tubb2a, Tubb2b, Tubb5) in SFA. SPRINT also decreased expression of collagen genes in SFA (Fig. 3) and of matrix metallopeptidase 15 (Mmp15); but increased expression of heparanase (Hpse). These gene expression changes are dramatically different from those seen in the GFA and suggest limited or different structural vascular remodeling is ongoing in SFA vs. GFA. SPRINT also altered expression of ion channels in SFA differently than in GFA. SPRINT altered the expression of the following channel-related genes in SFA: potassium voltage-gated channel 1 (Kcna1); potassium intermediate/small conductance calcium-activated channel, subfamily N, member 4 (Kcnn4); calcium channel, voltage-dependent, beta 4 subunit (Cacnb4); gap junction protein, alpha 5 (Gja5); sodium channel and calthrin linker 1 (Sclt1); and transient receptor potential cation channel, subfamily V, member 2 (Trpv2). Figure 3 also illustrates the observation that SPRINT produced a pattern of gene expression changes in the S2a that were similar to those in the RG2a discussed above.
Figure 4 presents results for the effects of EX on expression of the same groups of genes summarized for SPRINT in Fig. 3. Comparison of these two figures reveals that EX has less effect on gene expression in the GFA than did SPRINT. In contrast, the patterns of gene expression changes in RG2a and WG2a are similar between EX and SPRINT, with decreased expression of actin-, myosin-, and Tnn-related genes in the RG2a (Figs. 3 and 4). EX resulted in similar changes in gene expression in the S2a as in the RG2a (Fig. 4) as was true for SPRINT (Fig. 3). In the SFA, EX produced larger decreases in expression of some myosin-related genes but otherwise the patterns of change in SFA gene expression was similar with EX and SPRINT (Figs. 3 and 4).
Fig. 4.

Patterns of altered gene expression in feed arteries (GFA and SFA) and in various arterioles of gastrocnemius muscle and soleus muscles of OLETF rats following endurance exercise training (EX). Fold change in gene expression is shown relative to expression level of sedentary OLETF rats as described for Fig. 3. Note by comparing Figs. 3 and 4 one can appreciate how EX has similar effects on expression of actin-, myosin-, and troponin-related genes in RG2a and S2a as did SPRINT (Fig. 3) whereas the effects of SPRINT on the GFA are much different from those of EX.
Analysis of results also revealed that a family of genes, the solute carrier group of membrane transport proteins (Slc), had a number of genes whose expression was altered differentially by EX and SPRINT. Results indicate that expression of 53 Slc genes was altered by EX and/or SPRINT (Table 8). As can be appreciated from Table 8, EX and SPRINT induced similar numbers of changes in Slc gene expression (EX: 22 increased and 22 decreased; and SPRINT: 19 increased and 22 decreased). However, the patterns of changes were not the same for EX and SPRINT. EX produced the greatest changes in Slc gene expression in the smaller arterioles S2a (8 increased and 12 decreased), RG2a (3 increased and 9 decreased), and WG2a (8 increased and 3 decreased) whereas SPRINT had the greatest effects on GFA (4 increased and 4 decreased), RG2a (3 increased and 9 decreased), and SFA (8 increased and 4 decreased). The genes whose expression was most influenced by EX/SPRINT were Slc9a3r2 with changes in four of five arterioles (increased in all but the S2a by both SPRINT and EX) and Slc7a6 with increases in three of five arterioles (increased by both EX and SPRINT in RG2a and SFA, and increased in S2a by EX). Another interesting observation is that six of the mitochondrial transport genes were changed in four of five arteriole samples (none of these genes had altered expression in the WG2a) and expression of nearly all of these genes was decreased (one exception was Slc25a24 which increased in S2a-EX and decreased in GFA- SPRINT). Slc25a25 exhibited decreased expression in GFA, RG2a, and S2a with EX and in RG2a with SPRINT (Table 8).
Table 8.
Effects of exercise on expression of genes coding for solute carrier transporter proteins
| Symbol | GeneID | GFA.OE | GFA.OI | RG2a.OE | RG2a.OI | S2a.OE | S2a.OI | SFA.OE | SFA.OI | WG2a.OE | WG2a.OI |
|---|---|---|---|---|---|---|---|---|---|---|---|
| Slc2a1 | 24546 | ↑ | |||||||||
| Slc2a4 | 25139 | ↓ | ↓ | ||||||||
| Slc2a8 | 50690 | ↓ | ↓ | ↓ | |||||||
| Slc3a2 | 50567 | ↑ | ↑ | ||||||||
| Slc4alap | 298805 | ↓ | |||||||||
| Slc5a6 | 170551 | ↑ | ↑ | ||||||||
| Slc6a4 | 25553 | ↓ | |||||||||
| Slc6a6 | 29464 | ↓ | |||||||||
| Slc6a8 | 50690 | ↓ | ↓ | ||||||||
| Slc7a1 | 25648 | ↑ | |||||||||
| Slc7a3 | 29485 | ↓ | |||||||||
| Slc7a6 | 307811 | ↑ | ↑ | ↑ | ↑ | ↑ | |||||
| Slc9a3r2 | 116501 | ↑ | ↑ | ↑ | ↑ | ↑ | ↑ | ↑ | ↑ | ||
| Slc9a8 | 311651 | ↑ | |||||||||
| Slc10a6 | 289459 | ↑ | ↑ | ↑ | |||||||
| Slc12a6 | 691209 | ↓ | ↓ | ||||||||
| Slc12a7 | 308069 | ↑ | |||||||||
| Slc15a3 | 246239 | ↑ | |||||||||
| Slc16a1 | 25027 | ↓ | |||||||||
| Slc16a3 | 94172 | ↓ | |||||||||
| Slc16a7 | 29735 | ↓ | ↓ | ||||||||
| Slc23a2 | 50622 | ↓ | ↓ | ||||||||
| Slc25a4 | 85333 | ↓ | |||||||||
| Slc25a20 | 117035 | ↓ | |||||||||
| Slc25a21 | 171151 | ↓ | |||||||||
| Slc25a24 | 310791 | ↓ | ↑ | ||||||||
| Slc25a25 | 246771 | ↓ | ↓ | ↓ | ↓ | ||||||
| Slc25a28 | 688811 | ↓ | ↓ | ||||||||
| Slc26a2 | 117267 | ↓ | |||||||||
| Slc27a1 | 94172 | ↓ | |||||||||
| Slc28a2 | 60423 | ↑ | ↑ | ||||||||
| Slc30a9 | 498358 | ↑ | |||||||||
| Slc35b1 | 287642 | ↑ | |||||||||
| Slc35c1 | 311204 | ↑ | |||||||||
| Slc35e3 | 362883 | ↑ | ↑ | ||||||||
| Slc35e4 | 266687 | ↑ | ↑ | ↑ | |||||||
| Slc35f1 | 502421 | ↓ | |||||||||
| Slc37a1 | 294321 | ↓ | |||||||||
| Slc37a4 | 29573 | ↓ | |||||||||
| Slc38a1 | 170567 | ↓ | ↓ | ↓ | ↓ | ||||||
| Slc38a3 | 252919 | ↓ | |||||||||
| Slc39a9 | 314275 | ↓ | |||||||||
| Slc39a13 | 295928 | ↑ | ↑ | ||||||||
| Slc40a1 | 170840 | ↑ | |||||||||
| Slc41a1 | 363985 | ↓ | |||||||||
| Slc44a3 | 295417 | ↓ | |||||||||
| Slc45a3 | 304785 | ||||||||||
| Slc46a3 | 288454 | ↓ | ↓ | ↓ | |||||||
| Slco2a1 | 24546 | ↑ | ↑ | ||||||||
| Ucp3 | 25708 | ↓ |
Effects of exercise on expression of genes coding for solute carrier transporter proteins. Results are reflected as increased expression (upward arrow) or decreased expression (downward arrow). Only significant differences are shown (P < 0.01) for the EX (OE) or SPRINT (OI) values relative to that of the sedentary OLETF value for that sample. The Symbol and Gene IDs are from the National Center for Biotechnology Information (NCBI) (http://www.ncbi.nlm.nih.gov/) gene bank and defined therein.
DISCUSSION
This study was designed to determine the effects of EX and SPRINT training on the transcriptome of skeletal muscle arterioles of OLETF rats, a model of T2D. Understanding exercise-induced alterations in the phenotype of arterioles and/or arteriolar vascular cells is one key to establishing mechanisms responsible for the beneficial effects of exercise in prevention and treatment of T2D. Based on our current knowledge, we hypothesized that the greatest effects of exercise training would be on the transcriptome of gastrocnemius arterioles. This expectation was based on the idea that shear stress at the vessel wall caused by blood flow during exercise training bouts is a major signal for changes in gene expression. We measured the impact of EX and SPRINT on vascular gene expression profiles in three arteries/arterioles supplying the gastrocnemius muscle and two arteries/arterioles supplying the soleus muscle using transcriptome-wide RNA-Seq analysis to comprehensively characterize vascular adaptations. Results do not support our hypothesis as the S2a's had the greatest number of changes in gene expression. Results also indicate that the effects of EX and SPRINT on gene expression patterns in the skeletal muscle arteriolar network are complex and spatially nonuniform within and among skeletal muscles.
SPRINT effects are different across skeletal muscle arteries/arterioles: gastrocnemius arteriolar tree.
As shown in Fig. 3, results indicate that SPRINT training had the greatest effects on expression of GFA genes coding for structural/contractile proteins with additional effects on signaling pathways/genes in the GFA. Consistent with this conclusion, IPA Network analysis revealed that the Organ Morphology: Skeletal Muscular System Development and Function networks (score 43) (Fig. 5) and the Cellular Development, Embryonic Development (score 15) networks were the top networks for GFA. Figure 5 illustrates the large number of contractile protein genes exhibiting increased expression in the GFA (red symbols). Canonical pathway analysis also indicated that the Actin Cytoskeleton Signaling pathway (Table 1) and Epithelial Adherens Junction Signaling pathways were among the top pathways influenced in GFA by SPRINT. Evidence that SPRINT also altered vascular control pathways in the GFA is apparent in the fact that calcium signaling pathways and NO-related pathways were also among the top canonical pathways affected.
Fig. 5.

Organ morphology: skeletal muscular system development and function. Top-scoring gene network influenced by SPRINT in the GFA (score = 43). Nodes represent genes/molecules. The shading is in proportion to the size of the fold change (red, upregulation; green, downregulation). White nodes denote network members that were not represented on the array. Gray nodes denote network members that did not reach the false discovery rate (FDR) < 10%. Solid and dotted lines denote direct and indirect relationships, respectively. Note in red the large number of contractile protein related genes that are upregulated by SPRINT.
In contrast to the SPRINT-induced phenotypic changes in GFA, WG2a exhibited modest or no changes in expression of genes coding for structural/contractile proteins. The WG2a exhibited SPRINT-induced changes in expression of genes coding for ion channels and signaling pathways (Fig. 3). IPA canonical pathway analysis revealed that none of the top canonical pathways altered by SPRINT in the GFA were among the top pathways in the WG2a demonstrating that SPRINT had different effects on the transcriptome of GFA than of WG2as. The WG2a top canonical signaling pathways changed by SPRINT included: Semaphorin Signaling in Neurons, NRF2-mediated Oxidative Stress, Glucocorticoid Receptor Signaling, and Axonal Guidance Signaling. SPRINT also altered expression of genes coding for proteins involved in Cell-Cell signaling, Cellular Growth and Proliferation in the WG2a to a lesser extent than in the GFA in that there were 5 to 10 molecules/pathway with altered expression in the GFA but only 1 to 2 in the WG2a. In the WG2a of SPRINT animals IPA Network analysis indicated that the top network was Cell Death and Survival, Gene Expression, Cellular Movement (score 6). Overall the data indicate that the genes showing the greatest changes in expression in the WG2a are not generally altered in the GFA, and contrary to our hypothesis, SPRINT had greater effect on gene expression in the GFA than in WG2a.
The pattern of alterations in gene expression produced by SPRINT in the RG2a also differed from the GFA, and the magnitude of fold changes in genes coding for structural/contractile proteins is substantially less in RG2a (Fig. 3). Comparison of the patterns of gene expression changes shown in Fig. 3 reveals that SPRINT caused RG2a to exhibit changes in gene expression in the Actin Cytoskeleton Signaling pathway (Table 1) and Epithelial Adherens Junction Signaling pathways that were in the opposite direction from those in GFA. Further, IPA Network analysis revealed that the Organ Morphology: Skeletal Muscular System Development and Function network (score of 57) and the Cardiovascular Disease, Ophthalmic Disease, Organ Morphology Networks were the top networks for RG2a. Figure 3 illustrates that many genes coding for contractile proteins exhibit decreased expression in RG2a, a much different pattern of altered gene expression than that seen in the GFA (Figs. 3 and 5). Overall, the genes whose expression were changed by SPRINT are not the same in RG2a and GFA [e.g., SPRINT increased expression of Myh1 (30-fold), Myh2 (22-fold), and Tnnt2 (14-fold) in the GFA but decreased expression of Myh1 (14-fold), Myh2 (11-fold), and Tnnt2 (10-fold) in the RG2a]. Also, SPRINT increased expression of Nos3 (codes for eNOS protein) in the RG2a, not the GFA. Consistent with this observation, SPRINT also increased EDD in RG2a, not GFA (48).
Previous vasomotor function results indicated that SPRINT induced greater changes in WG2a and RG2a signaling pathways than in GFA. Results obtained from matched arterioles of the same rats reveal that acetylcholine (ACh)-induced EDD was increased by SPRINT in the RG2a and insulin-induced EDD was significantly increased in the WG2a (following endothelin receptor blockade) (48). In contrast, in the GFA, SPRINT did not alter insulin-induced EDD and only modestly increased maximal ACh-induced EDD.
Comparison of effects of SPRINT on soleus and gastrocnemius muscle arteries/arterioles.
SPRINT had different effects on phenotype of soleus arterioles from those in the gastrocnemius muscle. As can be seen in Fig. 3, the top canonical pathways altered by SPRINT in the SFA were different from the top canonical pathways altered in the GFA. Of interest the Glucocorticoid Receptor Signaling and NRF2-mediated Oxidative Stress Response pathways were two of the top canonical pathways altered by SPRINT in the SFA, not the GFA. The only canonical pathway altered by SPRINT in both SFA and GFA was the Epithelial Adherens Junction Signaling pathway. IPA Network analysis confirms that SPRINT alters the expression of genes differently in the GFA than in the SFA.
Figure 3 also illustrates the fact that the effects of SPRINT on canonical signaling pathways in the S2a are different from the RG2a and WG2a arterioles. The expression of a large number of genes associated with development, growth, proliferation, cell maintenance, and cell death and survival were changed by SPRINT in S2a's. IPA Network analysis of S2a indicates that SPRINT alters the Developmental Disorder, Hereditary Disorder, Metabolic Disease Network (score 34), and Cell Death and Survival, Cell-cell signaling Network (score 28). Thus SPRINT alters structural networks in S2a, as it does in the other skeletal muscle arterioles, but not the same networks, and most genes with SPRINT-induced altered expression in S2as are not altered in RG2a or WG2a. Previous results demonstrated that SPRINT did not alter ACh-induced or insulin-induced EDD in SFA (48). Thus available transcriptome and vasomotor function results support the hypothesis that SPRINT has different phenotypic effects throughout the arteriolar circulation of the gastrocnemius and soleus muscles of OLETF rats.
Effects of SPRINT are different from effects of EX across skeletal muscle arteries/arterioles.
EX training altered the expression of a smaller number of genes than did SPRINT in every arteriole examined except for the WG2a. There were not enough genes with altered expression in the GFA of EX rats to support IPA Network analysis. In the RG2a IPA canonical pathway analysis indicated that EX altered NF-kB signaling (Table 6), Antiproliferative role of TOB in T cell signaling, TNFR2 signaling, 4-1BB signaling in T lymphocytes, and Sonic Hedgehog signaling. The molecular and cellular functions that are modulated by genes with EX-induced alterations in gene expression in RG2a included cell death, survival, movement, development, growth and proliferation as well as posttranslational modification. IPA Network analysis indicated that the Cell Cycle, Cell Death and Survival Network (score 31) was modified by EX in RG2a. In contrast to the RG2a arterioles, the WG2a from the EX group had more genes with altered expression than did WG2a of SPRINT. There was little evidence of changes in structural/contractile protein gene expression in the WG2a of EX. Rather there were changes in expression of genes coding for signaling pathways including Protein Ubiquitination Pathway, Androgen Signaling, Estrogen Receptor Signaling, and Parkinson's Signaling pathways. WG2a of EX also exhibited alterations in expression of genes coding for proteins involved in cellular growth, proliferation, development, assembly and organization and function as well as cell-cell signaling but to a lesser extent than in the GFA. In the WG2a of EX animals the top networks according to IPA Network analysis were the Cellular Assembly and Organization (score 37), Cell Death and Survival, Hereditary Disorder, Neurological Diseases (score 34) and Cellular Morphology, Cellular Movement, Cell-Cell Signaling and Interaction Networks (score 21). Overall the data indicate that the genes showing the greatest changes in expression in the WG2a of EX are much different than those seen in WG2a of SPRINT rats. IPA Network analysis revealed that none of the top canonical pathways altered in the GFA by EX were among the top pathways in the WG2a. Also, Table 7 illustrates the central role UBC and protein ubiquitin proteasome systems seem to play in the EX-induced adaptive changes in gene expression in the WG2a. IPA Network analysis indicates that Protein Ubiquitination Pathway was a top canonical pathway in both the WG2a and S2a of the EX rats.
EX caused changes in a much larger number of genes (encompassing contractile, structural, and signaling pathway proteins) than did the other arterioles as EX increased expression of 355 genes and decreased expression of 420 genes in the S2a. S2a of EX exhibited alterations in expression of genes involved in cellular growth, proliferation, development, assembly, and organization and function as well as cell-cell signaling and small molecule biochemistry. IPA Network analysis revealed 15 Networks with significant changes in gene expression with the top 3 Networks DNA, Replication, Recombination, Repair and Cell Cycle Cell Assembly (score 46), Amino Acid, Metabolism, Small Molecule, Drug Metabolism (score 44) and Energy Production, Lipid Metabolism, Small Molecule Biochemistry (score 42).
We previously examined exercise training-induced structural vascular adaptation in normal rats (7, 20, 21, 40) and found that model analysis indicated that structural arteriolar adaptations create a major portion of the exercise training-induced increased blood flow capacity in gastrocnemius muscle. Structural arteriolar remodeling is the primary adaptation in gastrocnemius muscle with SPRINT, and structural vascular adaptation occurs to a greater extent in the larger arterioles of the gastrocnemius (7, 20, 21, 40). Present results are consistent with this hypothesis, in that the GFA appeared to have a predominance of increased gene expression associated with structural remodeling while RG2a showed nearly opposite changes in expression of structural adaptive genes than GFA (Fig. 3). The current data set cannot fully evaluate the hypothesis that structural adaptation occurs more in larger arterioles because we only studied 2a arterioles in the present study. However, the analysis of Binder et al. (7) indicated that after SPRINT, flow through 2a arterioles is substantially greater than in 2a arterioles of sedentary muscle and that although 2a arteriolar diameter tended to increase in SPRINT (figure 1 of Binder et al.) there was no significant difference in diameter (7). These observations suggest that SPRINT may increase EDD in RG2a and WG2a arterioles as a result of increased shear through these arterioles and that SPRINT does not alter EDD in other arteries because flow through the other arteries is not adequately altered during SPRINT training bouts. If increased blood flow during exercise is a primary signal for vascular adaptations, one would expect greater changes in gene expression in the artery that is exposed to greater increases in blood flow (i.e., RG2a and WG2a) and not vice versa. Indeed, vasomotor function of the GFA, RG2a, and WG2a appears to be more amenable to exercise training than the SFA (4, 28, 48). In particular, previous studies from our group have shown that OLETF rats given access to voluntary running wheels exhibit improved EDD in the GFA, but not SFA (4). Earlier work in lean healthy rats also demonstrated a lack of exercise training-induced change in EDD in the SFA (28). Likewise, our recently published data from the present group of rats indicates that treadmill EX and SPRINT increased ACh-induced EDD in the RG2a and that EX increased ACh-induced EDD in WG2a and that SPRINT increased insulin-induced EDD in WG2a; whereas, exercise-induced changes were not observed in the SFA (48). Previous results also indicated that EX and SPRINT improved insulin-induced EDD by decreasing endothelin-1-mediated constriction signaled by insulin (4, 48, 53). The decreased expression of Mapk6 (Table 3) in most arterioles may contribute to this decreased endothelin-1 signaling as this gene codes for a MAPK6 protein that is activated by insulin, leading to endothelin-1 production.
Vascular rarefaction, angiogenesis, and vascular remodeling.
Microvascular rarefaction (decreased numbers of microvessels) is a key pathogenic effect of T2D in skeletal muscle which may contribute to one of the most devastating effects of T2D, limited arteriogenesis and angiogenesis and blunted formation of collateralization in response to peripheral ischemia (16–18). Although Frisbee (16, 18) demonstrated in another rat model of T2D that exercise can prevent the development of microvascular rarefaction in gastrocnemius muscle, as have others (35, 36), mechanisms whereby exercise restores arteriogenic capacity in T2D are poorly understood. We examined our data base for evidence of altered expression of genes believed to code for proteins that are proangiogenic. Results indicate that SPRINT and/or EX caused increased expression of Bcl211 (which codes for a member of the VEGF signaling pathway) in arterioles. Also, results demonstrate that Andrd23 expression is increased in GFA, WG2a, and SFA by SPRINT and in WG2a by EX. Ankrd23 is a member of a conserved family of genes characterized by the presence of four ankyrin repeats harboring a binding site to the N2A region of the giant protein titin (19, 47). Ankrd1 was the first ankyrin repeat protein to be discovered and is predominately expressed in cardiac muscle (54). Ankrd2 is predominately expressed in skeletal muscle. Ankrd1 and Ankrd2 are known as muscle stretch proteins in cardiac and skeletal muscle that are induced under stress conditions and are proposed to have gene expression regulatory functions (37, 47). Thus Ankrd1 and Ankrd2 appear to serve as both nuclear transcriptional regulators, forming molecular links between myofibrillar stretch-induced signaling and muscle gene expression, and as structural proteins along with titin and contractile proteins. Ankrd23 was discovered in 2003 as a novel protein expressed in muscle and adipose tissue of diabetic mice (27). Obese Zucker rats also exhibit increased expression of Ankrd23 in cardiac and skeletal muscle (27). Given this literature we propose that Ankrd23 may serve as a muscle stretch sensing protein in vascular smooth muscle much like Ankrd1 and Ankrd2 do in striated muscle, and thereby participates in control of vascular gene expression in vascular remodeling. Expression of Abra, the gene coding for actin-binding Rho-activating protein, was also increased in GFA by SPRINT. ABRA (aka STARS) is a transcription activator of PGC1α and SRF that shifts skeletal muscle gene expression toward higher oxidative metabolism. It may also participate in signaling vascular remodeling in the GFA in response to SPRINT. Future research is needed to test the hypothesis that Ankrd23 and/or Abra play important roles in controlling vascular gene expression during exercise training-induced vascular adaptation in skeletal muscle vasculature.
A number of the pathways and networks altered by EX and/or SPRINT provided evidence of the involvement of the ubiquitin and ubiquitin-like proteins which can control many processes in the cell (63). For example EX decreased expression of Ubd in all arterioles examined, and many genes coding for proteins in the ubiquitin-proteasome system (UPS) were decreased in OLETF rat arterioles by EX and SPRINT (Table 7). Of interest, UBC was increased by obesity in SFA and GFA, and present results indicate that exercise may reverse these effects of obesity (31). We are not aware of other studies of the effects of exercise on expression of the UPS in skeletal muscle arterioles. However, Cunha et al. (13) reported that moderate exercise training attenuated skeletal muscle proteasome activity in parallel with improved aerobic capacity in mouse and human skeletal muscle. Also, Cullin 1, whose expression was significantly decreased by EX and SPRINT in a number of arterioles, is a core component of multiple cullin-RING-based E3 ubiquitin-protein ligase complexes, which mediate the ubiquitination of proteins involved in cell cycle progression, signal transduction, and transcription. These changes, if associated with comparable changes in protein content, may contribute to structural vascular adaptation. Also, available evidence is consistent with the conclusion that UPS is a modulator of endothelial function both by modulating eNOS expression and by phosphorylation of eNOS (63, 64). In addition there is evidence that UPS controls availability of cofactors and proteins involved in eNOS activation and modulates endothelium-derived contracting factors through oxidative stress. These results indicate that research is required to determine whether UPS plays a key role in decreasing the contribution of NO and increasing the contribution of ET-1 to the vascular response to insulin and ACh in T2D (11, 24, 48, 63, 64) and to the reversal of these effects by exercise training. Considering the decrease in expression of a number of genes coding for proteins in the protein ubiquitination pathway it may be important to keep in mind that these gene expression patterns are present in OLETF rats that have been training for 12 wk. Thus it is possible that this gene expression pattern is much different during the initial weeks of training. For example, expression of these genes may be increased during the active remodeling of the arteriolar tree but are downregulated in the fully trained state examined in the present study.
EX and SPRINT also appeared to alter expression of genes coding for the solute carrier group of membrane transport proteins (Slc) which includes over 386 protein-coding genes from 52 gene families(22, 25, 61). These proteins are involved in transporting solutes across membranes and some Slc proteins are PDZ scaffolding proteins that mediate cellular processes by binding to and regulating the membrane expression and protein-protein interactions of membrane receptors and transport proteins (6, 22, 25, 61). Results indicate that EX and/or SPRINT altered expression of 53 Slc genes (Table 8) and that EX produced the greatest changes in Slc gene expression in the S2a (8 increased and 12 decreased), RG2a (3 increased and 9 decreased), and WG2a (8 increased and 3 decreased) whereas SPRINT had the greatest effects on GFA (4 increased and 4 decreased), RG2a (3 increased and 9 decreased), and SFA (8 increased and 4 decreased). These results also support our conclusion that changes in vascular gene expression patterns differ in muscle depending on fiber type composition and along the arteriolar tree in a given muscle. The Slc gene whose expression was most influenced by EX/SPRINT was Slc9a3r2 with increased expression in four of five arterioles of both SPRINT and EX groups. Slc9a3r2 is a member of the Na+/H+ exchanger regulatory factor (NHERF) family (specifically NHERF2) of PDZ scaffolding proteins and inorganic cation/anion transporters (Na+/H+ exchanger) and has been reported to exhibit endothelial cell-specific expression (46, 67). NHERF2 is a negative regulator of endothelial cell proliferation (6). Thus Bhattacharya et al. (6) reported that knockdown of this gene in mice resulted in increased endothelial cell turnover and excessive angiogenesis. It seems possible that expression of this gene was depressed early on in the training programs, but at 10 wk of training when these tissues were harvested, structural adaptation is stable and endothelial cell turnover is decreased by increased expression of Slc9a3r2.
It is also interesting that six of the mitochondrial transport genes were changed in four of five arteriole samples (none of these genes had altered expression in the WG2a) and expression of nearly all of these genes was decreased (one exception was Slc25a24 which increased in S2a-EX and decreased in GFA-SPRINT). There are 43 gene-coding members of the Slc25 family including Ucp-1, Ucp-2, and Ucp-3 (Slc25a9). Slc25a25 exhibited decreased expression in GFA, RG2a, and S2a with EX and in RG2a with SPRINT (Table 8). The significance of changes in these genes coding for mitochondrial transport proteins is not apparent at this time nor is it clear why the WG2a arterioles did not exhibit any changes in expression of these genes.
We previously reported that SPRINT increased expression of Hspa12b (heat shock 70kDa protein 12B) mRNA in the SFA (57). Present results indicate that Hspa12b is also increased in WG2a of SPRINT rats. In the GFA, RG2a, and S2a, expression of this heat shock protein was not altered, but Hsp1, Hsp5 (HSP70), and Hsp90 were all increased in these arteries by SPRINT. SPRINT also increased expression of Hspa8 in the SFA, and EX increased expression of Hspa12b in SFA and WG2a. Hsp5 and Hsp90 were increased by EX in the SFA, S2a, and RG2a. Heat shock proteins protect cells when stressed, and these proteins are among the most highly expressed cellular proteins across all species. HSP90 assists proper folding of proteins in the cell, and HSP5 is also involved in the folding and assembly of proteins but is found primarily in the lumen of the endoplasmic reticulum. HSPA12B is a member of the HSP70 family of proteins that function as molecular chaperones, assist in protein synthesis, assembly, trafficking between cellular compartments, and degradation. HSPA12B is predominantly expressed in endothelial cells and required for angiogenesis, but the distribution of expression in various endothelia is heterogeneous (26, 65). Available evidence suggests that HSPA12B modulates angiogenesis by regulating endothelial cell adhesion and migration (65). The distribution of the altered expression of Hspa12b among arterioles examined in this study is intriguing. Both SPRINT and EX stimulated increased expression of Hspa12b in SFA and WG2a, but not in S2a, GFA, or RG2a. Basal expression of this gene is similar in all arterioles. Steagall et al. (65) report that the protein coded by Hspa12b (HSPA12B) is expressed in adipose tissue, brain, heart, kidney, and lung but not liver sinusoidal endothelial cells and that in the heart and brain all sizes of vessel express HSPA12B whereas in adipose tissue and lung it is primarily present in capillaries. Because of the role of HSPA12B in angiogenesis these results suggest regional differences in EX and/or SPRINT induced angiogenic signals in the soleus and white gastrocnemius muscle relative to the red gastrocnemius muscle. These observations make it apparent that it is important to determine the distribution of expression of genes throughout skeletal muscle arteriolar networks and whether different forms of exercise training have an influence on these expression patterns.
To summarize present results relative to signals for angiogenesis and structural vascular remodeling we observed that several genes in the VEGF signaling pathway exhibit increased expression in skeletal muscle arterioles after EX and SPRINT including Shc1, Akt, and Bcl2l1. Ankrd23 and Abra are also increased by EX and/or SPRINT in some arterioles while Ubc, Ubd, and Ups units are decreased by EX and/or SPRINT. EX and SPRINT also alter expression of eNOS/ET-1, Slc9a3r2, and Hspa12b genes, which have also been shown to affect angiogenesis and vascular remodeling. Understanding how all these factors may interact in T2D in modulating vascular adaptation to exercise training will require future work which promises to result in a major advance of our understanding of exercise training-induced vascular adaptation.
This study provides an RNA-Seq based characterization of the effects of exercise on the transcriptome of gastrocnemius and soleus muscle arterioles from obese rats. A significant finding of the study is that treadmill exercise in rats, both EX and SPRINT, alters gene expression patterns in WG2as and has greater effects in SFA and S2a than in gastrocnemius muscle arterioles. This finding is puzzling given the knowledge that treadmill bouts of exercise are associated with greater relative increases in muscle fiber recruitment/metabolism and blood flow to the gastrocnemius muscle compared with the soleus muscle.
One central hypothesis driving this series of experiments was that hemodynamic forces, including shear stress and wall stretch, are among the key signals for altered gene expression in the arteriolar network of skeletal muscle. Therefore our hypothesis was that training-induced changes in gene expression would be greatest in the arteries experiencing the greatest increases in blood flow during exercise training bouts. Although some results from this study are consistent with this conception of exercise-induced vascular adaptation, most of the genes whose expression was altered by SPRINT and EX are not considered shear stress-responsive genes (8, 12). Overall the number of genes with altered expression and the variety of biological processes controlled by these genes suggests that this conception of the signal for adaptation is dramatically oversimplified. There is no doubt that the effects of exercise training on vascular cell gene expression in the arteriolar network of skeletal muscle are complex. Our results are consistent with the conclusion that these effects differ with skeletal muscle fiber type and with location of the vascular cells in the vascular tree. Given the complex nature of changes in vascular gene expression reported herein, it appears unlikely that hemodynamic forces are the only exercise-induced signals mediating the regulation of vascular gene expression. It is important to determine what other exercise-induced signals mediate the altered vascular cell gene expression we report herein.
Caveats.
We analyzed and interpreted the results of this study from our perspective of a search for mechanisms responsible for vascular adaptation in skeletal muscle arterioles. We recognize that this is a limited view of the large amount of data obtained in this study. We anticipate that others who examine the results provided in the Supplemental Data, available with the online version of this article, will make equally important interpretations. Also, it is important that our results were obtained from whole arterioles so we cannot at this time establish which cell type in the arterioles is responsible for the altered gene expression. Future research is required to address this important question. Finally, in interpretation of our results we considered muscle fiber recruitment patterns, and blood flow distribution patterns within and between the gastrocnemius and soleus muscles obtained from normal rats. We have not made these measurements in OLETF rats and it is possible that recruitment/metabolism and blood flow are different in these obese rats. Also, because we only examined the treatment effects of EX and SPRINT in OLETF rats, the effects of these exercise training programs on vascular gene expression patterns may be different in nonobese rats.
GRANTS
This work was supported by National Institutes of Health (NIH) Grants RO1-HL-036088 (M. H. Laughlin and J. W. Davis), T32-AR-048523 (N. T. Jenkins and J. S. Martin), and VHA-CDA2 1299-02 (R. S. Rector). J. Padilla is currently supported by National Heart, Lung, and Blood Institute Grant K01-HL-125503. This work was also supported in part with resources and the use of facilities at the Harry S Truman Memorial Veterans Hospital in Columbia, MO.
DISCLOSURES
No conflicts of interest, financial or otherwise, are declared by the author(s).
AUTHOR CONTRIBUTIONS
Author contributions: M.H.L., J.P., N.T.J., J.S.M., and J.W.D. conception and design of research; M.H.L., J.P., N.T.J., P.K.T., J.S.M., and R.S.R. performed experiments; M.H.L., J.P., N.T.J., P.K.T., J.S.M., R.S.R., S.A., and J.W.D. analyzed data; M.H.L., J.P., N.T.J., P.K.T., J.S.M., R.S.R., and J.W.D. interpreted results of experiments; M.H.L., S.A., and J.W.D. prepared figures; M.H.L. drafted manuscript; M.H.L. approved final version of manuscript; J.P., N.T.J., P.K.T., J.S.M., R.S.R., S.A., and J.W.D. edited and revised manuscript.
Supplementary Material
ACKNOWLEDGMENTS
We thank N. Fleming, E. Gibson, K. Tacchi, and M. Brielmaier for assisting in the care of the rats and exercise training. S. Blake (Global Biologics) performed the RNA extractions, and RNA libraries were submitted to the University of Missouri DNA Core Facility for high-throughput sequencing services.
REFERENCES
- 1.Armstrong RB, Laughlin MH. Blood flows within and among rat muscles as a function of time during high speed treadmill exercise. J Physiol 344: 187–208, 1983. [DOI] [PMC free article] [PubMed] [Google Scholar]
- 2.Armstrong RB, Laughlin MH. Exercise blood flow patterns within and among rat muscles after training. Am J Physiol Heart Circ Physiol 246: H59–H68, 1984. [DOI] [PubMed] [Google Scholar]
- 3.American Diabetes Association. Standards of Medical Care in Diabetes—2014. Diabetes Care 37: s14–s80, 2014. [DOI] [PubMed] [Google Scholar]
- 4.Bender SB, Newcomer SC, Laughlin MH. Differential vulnerability of skeletal muscle feed arteries to dysfunction in insulin resistance: impact of fiber type and daily activity. Am J Physiol Heart Circ Physiol 300: H1434–H1441, 2011. [DOI] [PMC free article] [PubMed] [Google Scholar]
- 5.Benjamini Y, Hochberg Y. Controlling the false discovery rate: a practical and powerful approach to multiple testing. J Royal Statistical Soc 57: 289–300, 1995. [Google Scholar]
- 6.Bhattacharya R, Wang E, Dutta SK, Vohra PK, EG, Prakash YS, Mukhopadhyay D. NHERF-2 maintains endothelial homeostasis. Blood 119: 4798–4806, 2012. [DOI] [PMC free article] [PubMed] [Google Scholar]
- 7.Binder KW, Murfee WL, Song J, Laughlin MH, Price RJ. Computational network model prediction of hemodynamic alterations due to arteriolar remodeling in interval sprint trained skeletal muscle. Microcirculation 14: 181–192, 2007. [DOI] [PMC free article] [PubMed] [Google Scholar]
- 8.Björck HM, Renner J, Maleki S, Nilsson SFE, Kihlberg J, Folkersen L, Karlsson M, Ebbers T, Eriksson P, Länne T. Characterization of shear-sensitive genes in the normal rat aorta identifies hand2 as a major flow-responsive transcription factor. PloS one 7: e52227, 2012. [DOI] [PMC free article] [PubMed] [Google Scholar]
- 9.Blair SN, Church TS. The fitness, obesity, and health equation: is physical activity the common denominator? JAMA 292: 1232–1234, 2004. [DOI] [PubMed] [Google Scholar]
- 10.Bourgon R, Gentleman R, Huber W. Independent filtering increases detection power for high-throughput experiments. Proc Natl Acad Sci USA 107: 9546–9551, 2010. [DOI] [PMC free article] [PubMed] [Google Scholar]
- 11.Chitra S, Nalini G, Rajasekhar G. The ubiquitin proteasome system and efficacy of proteasome inhibitors in diseases. Int J Rheum Dis 15: 249–260, 2012. [DOI] [PubMed] [Google Scholar]
- 12.Chu TJ, Peters DG. Serial analysis of the vascular endothelial transcriptome under static and shear stress conditions. Physiol Genomics 34: 185–192, 2008. [DOI] [PubMed] [Google Scholar]
- 13.Cunha TF, Bacurau AV, Moreira JB, Paixão NA, Campos JC, Ferreira JC, Leal ML, Negrão CE, Moriscot AS, Wisløff U, Brum PC. Exercise training prevents oxidative stress and ubiquitin-proteasome system overactivity and reverse skeletal muscle atrophy in heart failure. PloS one 7: 1932–6203 (Electronic), 2012. [DOI] [PMC free article] [PubMed] [Google Scholar]
- 14.de Jonge HJM, Fehrmann RSN, de Bont ESJM, Hofstra RMW, Gerbens F, Kamps WA, de Vries EGE, van der Zee AGJ, te Meerman GJ, ter Elst A. Evidence-based selection of housekeeping genes. PloS one 2: e898, 2007. [DOI] [PMC free article] [PubMed] [Google Scholar]
- 15.Fogarty JA, Muller-Delp JM, Delp MD, Mattox ML, Laughlin MH, Parker JL. Exercise training enhances vasodilation responses to vascular endothelial growth factor in porcine coronary arterioles exposed to chronic coronary occlusion. Circulation 109: 664–670, 2004. [DOI] [PubMed] [Google Scholar]
- 16.Frisbee JC. Impaired skeletal muscle perfusion in obese Zucker rats. Am J Physiol Regul Integr Comp Physiol 285: R1124–R1134, 2003. [DOI] [PubMed] [Google Scholar]
- 17.Frisbee JC, Maier KG, Stepp DW. Oxidant stress-induced increase in myogenic activation of skeletal muscle resistance arteries in obese Zucker rats. Am J Physiol Heart Circ Physiol 283: H2160–H2168, 2002. [DOI] [PubMed] [Google Scholar]
- 18.Frisbee JC, Samora JB, Peterson J, Bryner R. Exercise training blunts microvascular rarefaction in the metabolic syndrome. Am J Physiol Heart Circ Physiol 291: H2483–H2492, 2006. [DOI] [PubMed] [Google Scholar]
- 19.Granzier H, Labeit S. Structure-function relations of the giant elastic protein titin in striated and smooth muscle cells. Muscle Nerve 36: 740–755, 2007. [DOI] [PubMed] [Google Scholar]
- 20.Gute D, Fraga C, Laughlin MH, Amann JF. Regional changes in capillary supply in skeletal muscle of high-intensity endurance-trained rats. J Appl Physiol 81: 619–626, 1996. [DOI] [PubMed] [Google Scholar]
- 21.Gute D, Laughlin MH, Amann JF. Regional changes in capillary supply in skeletal muscle of interval-sprint and low intensity, endurance trained rats. Microcirculation 1: 183–193, 1994. [DOI] [PubMed] [Google Scholar]
- 22.He L, Vasiliou K, Nebert DW. Analysis and update of the human solute carrier (SLC) gene superfamily. Hum Genomics 3: 195–206, 2009. [DOI] [PMC free article] [PubMed] [Google Scholar]
- 23.Henriksen EJ. Exercise effects of muscle insulin signaling and action: effects of acute exercise and exercise training on insulin resistance. J Appl Physiol 93: 788–796, 2002. [DOI] [PubMed] [Google Scholar]
- 24.Herrmann J, Lerman LO, Lerman A. Ubiquitin and ubiquitin-like proteins in protein regulation. Circ Res 100: 1276–1291, 2007. [DOI] [PubMed] [Google Scholar]
- 25.Höglund PJ, Nordström KJ, Schiöth HB, Fredriksson R. The solute carrier families have a remarkably long evolutionary history with the majority of the human families present before divergence of Bilaterian species. Mol Biol Evol 28: 1531–1541, 2010. [DOI] [PMC free article] [PubMed] [Google Scholar]
- 26.Hu G, Tang J, Zhang B, Lin Y, Hanai J, Galloway J, Bedell V, Bahary N, Han Z, Ramchandran R, Thisse B, Thisse C, Zon LI, Sukhatme VP. A novel endothelial-specific heat shock protein HspA12B is required in both zebrafish development and endothelial functions in vitro. J Cell Sci 119: 4117–4126, 2006. [DOI] [PubMed] [Google Scholar]
- 27.Ikeda K, Emoto N, Matsuo M, Yokoyama M. Molecular identification and characterization of a novel nuclear protein whose expression is up-regulated in insulin-resistant animals. J Biol Chem 278: 3514–3520, 2003. [DOI] [PubMed] [Google Scholar]
- 28.Jasperse JL, Laughlin MH. Vasomotor responses of soleus feed arteries from sedentary and exercise trained rats. J Appl Physiol 86: 441–449, 1999. [DOI] [PubMed] [Google Scholar]
- 29.Jenkins NT, Martin JS, Laughlin MH, Padilla J. Exercise-induced signals for vascular endothelial adaptations: implications for cardiovascular disease. Curr Cardiovasc Risk Rep 6: 331–346, 2012. [DOI] [PMC free article] [PubMed] [Google Scholar]
- 30.Jenkins NT, Padilla J, Martin JS, Crissey JM, Thyfault JP, Rector RS, Laughlin MH. Differential vasomotor effects of insulin on gastrocnemius and soleus feed arteries in the OLETF rat model: role of endothelin-1. Exp Physiol 99: 262–271, 2014. [DOI] [PMC free article] [PubMed] [Google Scholar]
- 31.Jenkins NT, Padilla J, Thorne PK, Martin JS, Rector RS, Davis JW, Laughlin MH. Transcriptome-wide RNA sequencing analysis of rat skeletal muscle feed arteries. I. Impact of obesity. J Appl Physiol (1985) 116: 1017–1032, 2014. [DOI] [PMC free article] [PubMed] [Google Scholar]
- 32.Kawano K, Hirashima T, Mori S, Saitoh Y, Kurosumi M, Natori T. Spontaneous long-term hyperglycemic rat with diabetic complications. Otsuka Long-Evans Tokushima Fatty (OLETF) strain. Diabetes 41: 1422–1428, 1992. [DOI] [PubMed] [Google Scholar]
- 33.Kelishadi R. Childhood overweight, obesity, and the metabolic syndrome in developing countries. Epidemiol Rev 29: 62–76, 2007. [DOI] [PubMed] [Google Scholar]
- 34.Kingwell BA, Formosa M, Muhlmann M, Bradley SJ, McConell GK. Type 2 diabetic individuals have impaired leg blood flow responses to exercise: role of endothelium-dependent vasodilation. Diabetes Care 26: 899–904, 2003. [DOI] [PubMed] [Google Scholar]
- 35.Kivela R, Silvennoinen M, Lehti M, Jalava S, Vihko V, Kainulainen H. Exercise-induced expression of angiogenic growth factors in skeletal muscle and in capillaries of healthy and diabetic mice. Cardiovasc Diabetol 7: 13, 2008. [DOI] [PMC free article] [PubMed] [Google Scholar]
- 36.Kivela R, Silvennoinen M, Touvra AM, Lehti TM, Kainulainen H, Vihko V. Effects of experimental type 1 diabetes and exercise training on angiogenic gene expression and capillarization in skeletal muscle. FASEB J 20: 1570–1572, 2006. [DOI] [PubMed] [Google Scholar]
- 37.Kojic S. MARP protein family: a possible role in molecular mechanisms of tumorigenesis. J Med Biochem 29: 157–164, 2010. [Google Scholar]
- 38.Lalande S, Gusso S, Hofman PL, Baldi JC. Reduced leg blood flow during submaximal exercise in type 2 diabetes. Med Sci Sports Exerc 40: 612–617, 2008. [DOI] [PubMed] [Google Scholar]
- 39.Laughlin MH, Armstrong RB. Muscular blood flow distribution patterns as a function of running speed in rats. Am J Physiol Heart Circ Physiol 243: H296–H306, 1982. [DOI] [PubMed] [Google Scholar]
- 40.Laughlin MH, Cook J, Tremble R, Ingram D, Colleran PN, Turk JR. Exercise training produces nonuniform increases in arteriolar density of rat soleus and gastrocnemius muscle. Microcirculation 13: 175–186, 2006. [DOI] [PMC free article] [PubMed] [Google Scholar]
- 40a.Laughlin MH, Padilla J, Jenkins NT, Thorne PK, Martin JS, Rector RS, Akter S, Davis JW. Exercise training causes differential changes in gene expression in diaphragm arteries and 2A arterioles of obese rats. J Appl Physiol; doi: 10.1152/japplphysiol.00317.2015. [DOI] [PMC free article] [PubMed] [Google Scholar]
- 41.Laughlin MH, Pollock JS, Amann JF, Hollis ML, Woodman CR, Price EM. Training induces nonuniform increases in eNOS content along the coronary arterial tree. J Appl Physiol 90: 501–510, 2001. [DOI] [PubMed] [Google Scholar]
- 42.Laughlin MH, Ripperger J. Vascular transport capacity of hindlimb muscles of exercise-trained rats. J Appl Physiol 62: 438–443, 1987. [DOI] [PubMed] [Google Scholar]
- 43.Laughlin MH, Roseguini B. Mechanisms for exercise training-induced increases in skeletal muscle blood flow capacity: differences with interval sprint training versus aerobic endurance training. J Physiol Pharmacol 59: 71–88, 2008. [PMC free article] [PubMed] [Google Scholar]
- 44.Laughlin MH, Rubin LJ, Rush JW, Price EM, Schrage WG, Woodman CR. Short-term training enhances endothelium-dependent dilation of coronary arteries, not arterioles. J Appl Physiol 94: 234–244, 2003. [DOI] [PubMed] [Google Scholar]
- 45.Laughlin MH, Woodman CR, Schrage WG, Gute D, Price EM. Interval sprint training enhances endothelial function and eNOS content in some arteries that perfuse white gastrocnemius muscle. J Appl Physiol 96: 233–244, 2004. [DOI] [PubMed] [Google Scholar]
- 46.Lee A, Rayfield A, Hryciw DH, Ma TA, Wang D, Pow D, Broer S, Yun C, Poronnik P. Na+-H+ exchanger regulatory factor 1 is a PDZ scaffold for the astroglial glutamate transporter GLAST. Glia 55: 119–129, 2007. [DOI] [PMC free article] [PubMed] [Google Scholar]
- 47.Linke WA. Sense and stretchability: the role of titin and titin-associated proteins in myocardial stress-sensing and mechanical dysfunction. Cardiovasc Res 77: 637–648, 2008. [DOI] [PubMed] [Google Scholar]
- 48.Martin JS, Padilla J, Jenkins NT, Crissey JM, Bender SB, Rector RS, Thyfault JP, Laughlin MH. Functional adaptations in the skeletal muscle microvasculature to endurance and interval sprint training in the type 2 diabetic OLETF rat. J Appl Physiol 113: 1223–1232, 2012. [DOI] [PMC free article] [PubMed] [Google Scholar]
- 49.McAllister RM, Jasperse JL, Laughlin MH. Nonuniform effects of endurance exercise training on vasodilation in rat skeletal muscle. J Appl Physiol 98: 753–761, 2005. [DOI] [PubMed] [Google Scholar]
- 50.McAllister RM, Newcomer SC, Laughlin MH. Vascular nitric oxide: effects of exercise training in animals. Appl Physiol Nutr Metab 33: 173–178, 2008. [DOI] [PMC free article] [PubMed] [Google Scholar]
- 51.McAuley PA, Artero EG, Sui X, Lee DC, Church TS, Lavie CJ, Myers JN, Espana-Romero V, Blair SN. The obesity paradox, cardiorespiratory fitness, and coronary heart disease. Mayo Clin Proc 87: 443–451, 2012. [DOI] [PMC free article] [PubMed] [Google Scholar]
- 52.Mikus CR, Rector RS, Arce-Esquivel AA, Libla JL, Booth FW, Ibdah JA, Laughlin MH, Thyfault JP. Daily physical activity enhances reactivity to insulin in skeletal muscle arterioles of hyperphagic Otsuka Long-Evans Tokushima Fatty rats. J Appl Physiol 109: 1203–1210, 2010. [DOI] [PMC free article] [PubMed] [Google Scholar]
- 53.Mikus CR, Roseguini BT, Uptergrove GM, Matthew Morris E, Scott Rector R, Libla JL, Oberlin DJ, Borengasser SJ, Taylor AM, Ibdah JA, Harold Laughlin M, Thyfault JP. Voluntary wheel running selectively augments insulin-stimulated vasodilation in arterioles from white skeletal muscle of insulin resistant rats. Microcirculation 19: 729–738, 2012. [DOI] [PMC free article] [PubMed] [Google Scholar]
- 54.Miller MK, Bang ML, Witt CC, Labeit D, Trombitas C, Watanabe K, Granzier H, McElhinny AS, Gregorio CC, Labeit S. The muscle ankyrin repeat proteins: CARP, ankrd2/Arpp and DARP as a family of titin filament-based stress response molecules. J Mol Biol 333: 951–964, 2003. [DOI] [PubMed] [Google Scholar]
- 55.Ortega FB, Lee DC, Katzmarzyk PT, Ruiz JR, Sui X, Church TS, Blair SN. The intriguing metabolically healthy but obese phenotype: cardiovascular prognosis and role of fitness. Eur Heart J 34: 389–397, 2013. [DOI] [PMC free article] [PubMed] [Google Scholar]
- 56.Ostergard T, Jessen N, Schmitz O, Mandarino LJ. The effect of exercise, training, and inactivity on insulin sensitivity in diabetics and their relatives: what is new? Appl Physiol Nutr Metab 32: 541–548, 2007. [DOI] [PubMed] [Google Scholar]
- 57.Padilla J, Jenkins NT, Thorne PK, Martin JS, Rector RS, Davis JW, Laughlin MH. Transcriptome-wide RNA sequencing analysis of rat skeletal muscle feed arteries. II. Impact of exercise training in Obesity. J Appl Physiol (1985) 116: 1033–1047, 2014. [DOI] [PMC free article] [PubMed] [Google Scholar]
- 58.Padilla J, Simmons GH, Davis JW, Whyte JJ, Zderic TW, Hamilton MT, Bowles DK, Laughlin MH. Impact of exercise training on endothelial transcriptional profiles in healthy swine: a genome-wide microarray analysis. Am J Physiol Heart Circ Physiol 301: H555–H564, 2011. [DOI] [PMC free article] [PubMed] [Google Scholar]
- 59.Reuland DJ, McCord JM, Hamilton KL. The role of Nrf2 in the attenuation of cardiovascular disease. Exerc Sport Sci Rev 41: 162–168, 2013. [DOI] [PubMed] [Google Scholar]
- 60.Reusch JE, Bridenstine M, Regensteiner JG. Type 2 diabetes mellitus and exercise impairment. Rev Endocr Metab Disord 14: 77–86, 2013. [DOI] [PMC free article] [PubMed] [Google Scholar]
- 61.Schlessinger A, Khuri N, Giacomini KM, Sali A. Molecular modeling and ligand docking for solute carrier (SLC) transporters. Curr Top Med Chem 13: 843–856, 2013. [DOI] [PMC free article] [PubMed] [Google Scholar]
- 62.Srere PA. Citrate synthase. Methods Enzymol 13: 3–5, 1969. [Google Scholar]
- 63.Stangl K, Stangl V. The ubiquitin-proteasome pathway and endothelial (dys)function. Cardiovasc Res 85: 281–290, 2010. [DOI] [PubMed] [Google Scholar]
- 64.Stangl V, Lorenz M, Meiners S, Ludwig A, Bartsch C, Moobed M, Vietzke A, Kinkel HT, Baumann G, Stangl K. Long-term up-regulation of eNOS and improvement of endothelial function by inhibition of the ubiquitin-proteasome pathway. FASEB J 18: 272–279, 2004. [DOI] [PubMed] [Google Scholar]
- 65.Steagall RJ, Rusinol AE, Truong QA, Han Z. HSPA12B is predominantly expressed in endothelial cells and required for angiogenesis. Arterioscler Thromb Vasc Biol 26: 2012–2018, 2006. [DOI] [PubMed] [Google Scholar]
- 66.Thyfault JP. Setting the stage: possible mechanisms by which acute contraction restores insulin sensitivity in muscle. Am J Physiol Regul Integr Comp Physiol 294: R1103–R1110, 2008. [DOI] [PubMed] [Google Scholar]
- 67.Wallgard E, Larsson E, He L, Hellström M, Armulik A, Nisancioglu MH, Genove G, Lindahl P, Betsholtz C. Identification of a core set of 58 gene transcripts with broad and specific expression in the microvasculature. Arterioscler Thromb Vasc Biol 28: 1469–1476, 2008. [DOI] [PubMed] [Google Scholar]
- 68.Watson JD. Type 2 diabetes as a redox disease. Lancet 383: 841–843, 2014. [DOI] [PubMed] [Google Scholar]
Associated Data
This section collects any data citations, data availability statements, or supplementary materials included in this article.