

Abstract
A major challenge for expanding specific types of hematopoietic cells ex vivo for the treatment of blood cell pathologies is identifying the combinations of cellular and matrix cues that direct hematopoietic stem cells (HSC) to self-renew or differentiate into cell populations ex vivo. Microscale screening platforms enable minimizing the number of rare HSCs required to screen the effects of numerous cues on HSC fate decisions. These platforms create a strong demand for label-free methods that accurately identify the fate decisions of individual hematopoietic cells at specific locations on the platform. We demonstrate the capacity to identify discrete cells along the HSC differentiation hierarchy via multivariate analysis of Raman spectra. Notably, cell state identification is accurate for individual cells and independent of the biophysical properties of the functionalized polyacrylamide gels upon which these cells are cultured. We report partial least-squares discriminant analysis (PLS-DA) models of single cell Raman spectra enable identifying four dissimilar hematopoietic cell populations across the HSC lineage specification. Successful discrimination was obtained for a population enriched for long-term repopulating HSCs (LT-HSCs) versus their more differentiated progeny, including closely-related short-term repopulating HSCs (ST-HSCs), and fully differentiated lymphoid (B cells) and myeloid (granulocytes) cells. The lineage-specific differentiation states of cells from these four sub-populations were accurately identified independent of the stiffness of the underlying biomaterial substrate, indicating subtle spectral variations that discriminated these populations were not masked by features from the culture substrate. This approach enables identifying the lineage-specific differentiation stages of hematopoietic cells on biomaterial substrates of differing composition, and may facilitate correlating hematopoietic cell fate decisions with the extrinsic cues that elicited them.
Introduction
The capacity of hematopoietic stem cells (HSCs) to self-renew or differentiate into the mature blood and immune cell lineages found in the body makes them potentially valuable for clinical therapies for blood and bone marrow diseases.1 The ability to direct HSCs in vitro to self-renew or differentiate into desired hematopoietic cell lineages is required to achieve this goal.2 A major challenge remains identifying ex vivo approaches to direct desired HSC fate specification events such as self-renewal versus differentiation.
The microenvironment surrounding each HSC in the bone marrow, known as the stem cell niche, influences HSC fate decisions to remain quiescent, self-renew, or differentiate into specific blood cell lineages.3 HSC fate specification is affected by extrinsic cues, such as matrix composition and stiffness.4 Thus, understanding the individual and combined effects of chemotactic and micromechanical cues on HSC self-renewal and differentiation is critical for efforts to direct HSC fate ex vivo.5 The scarcity of the long-term repopulating HSCs (LT-HSCs) that have the ability to self-renew in the body (<1:50,000 marrow cells)6 necessitates minimizing the number of bone marrow-extracted HSCs that are needed to screen HSC response to extrinsic cues.7–8 For this purpose, microscale screening platforms that contain a multitude of distinct environments have been produced by patterning biomaterial substrates with both biochemical and mechanical cues.2,9 However, to screen HSC response as a function of culture microenvironment, the differentiation state of individual cells at specific locations on the platform must be accurately identified. This creates an acute need for methods to accurately assess the lineage-specific differentiation stages of individual hematopoietic cells at specific locations within the culture. Functional assays, such as in vivo repopulation and colony forming unit (CFU) assays, are not suitable for in situ single cell analysis.10–11 Presently, whether an individual cell in situ belongs to one differentiation state or another may be identified via immunofluorescence using combinations of fluorescent antibodies targeting cell surface markers associated with each differentiation state. However, it is difficult to extend this approach to discriminate individual cells from multiple states on the same substrate due to the ambiguity of assessing the complex combinations of cell surface antigens that are required for identification,6 especially due to the nonspecific labeling, photobleaching, and spectral crosstalk that can arise when numerous labels are employed.12–13 Furthermore, the subjectivity of this approach produces substantial user variability, and antibody labeling may affect hematopoietic cell response.12
Ideally, the lineage-specific differentiation status of individual HSCs within engineered culture environments could be assessed with an objective, location-specific, and label-free approach. We recently described a label-free approach that used time-of-flight secondary ion mass spectrometry (TOF-SIMS) to discern discrete stages of B cell differentiation in primary, marrow-derived hematopoietic cells.14 We showed that individual hematopoietic stem and progenitor cells, common lymphoid progenitor cells, and differentiated B cells could be discriminated from one another and accurately classified with this approach, but did not examine the capacity to segment discrete hematopoietic stem and progenitor cell sub-populations. Though accurate, TOF-SIMS analysis cannot be performed on living cells, which limits its future applicability as a general tool to trace HSC response.
Raman microspectroscopy is a promising method for noninvasively acquiring biochemical data from individual, unlabeled, hematopoietic cells at distinct locations in a culture without compromising cell viability or differentiation potential when performed with a 785 nm laser.15–16 Due to the weak scattering efficiency of water, Raman spectroscopy is particularly useful for assessing the chemical constituents, such as proteins, nucleic acids, lipids, and carbohydrates, in living cells and tissue. Mesenchymal stem cell (MSC) differentiation into osteogenic and adipogenic lineages has been identified according to readily identifiable Raman signals associated with the characteristic bone minerals and lipid droplets, respectively, that these lineages produce.17–19 The differentiation states of human embryonic stem cells and MSCs have also been identified based on combinations of Raman spectral features, such as differences in DNA-to-protein-related peaks.15,18,20–27 Multivariate analysis has enabled monitoring stem cell differentiation and various differentiation-associated biomarkers based on changes over the cell fingerprint region in the Raman spectra.21,23,25–29 Unlike MSCs, whose differentiation can be tracked by changes in endogenously produced biomolecules with readily identifiable Raman signatures,17–19 such differentiation markers are not expected for HSCs. Consequently, subtle spectral features related to cell cycle status or the substrate beneath the cells may produce within-population spectral variation that masks the spectral differences related to hematopoietic cell differentiation stage and lineage. This concern is especially relevant to the use of Raman spectroscopy for identifying early HSC fate decisions in microscale screening platforms that contain spatial variations in substrate composition and stiffness.30
In this project, we examined the feasibility of using Raman spectroscopy and multivariate analysis techniques to discriminate the lineage-specification state of individual primary murine hematopoietic cells on substrates of varying stiffness. We focused on four populations isolated from murine bone marrow via conventional flow cytometry (Fig. 1): (1) a population enriched for LT-HSCs that do not express lineage antigens (Lin−) or CD34 but do express Sca1 and cKit (CD34−Lin−Sca1+cKit+ or CD34−LSK cells); (2) a populating enriched for closely-related short-term repopulating HSCs (ST-HSCs) that lack lineage antigens (Lin−) but do express CD34 (CD34+LSK); (3) a differentiated myeloid population, granulocytes (Lin+Gr-1+); and (4) a differentiated lymphoid population, B lymphocytes (Lin+IgM+B220+).31 These populations were chosen because the ability to discriminate closely related HSCs (LT vs. ST-HSCs) from a population enriched in differentiated cells represents a critical challenge for any analytical platform. We show that partial least-squares discriminate analysis (PLS-DA) models constructed from the Raman spectra enable the lineage-specific differentiation stages of individual LT-HSCs, ST-HSCs, granulocytes and B cells seeded on gels of varying stiffness to be accurately identified.
Figure 1.
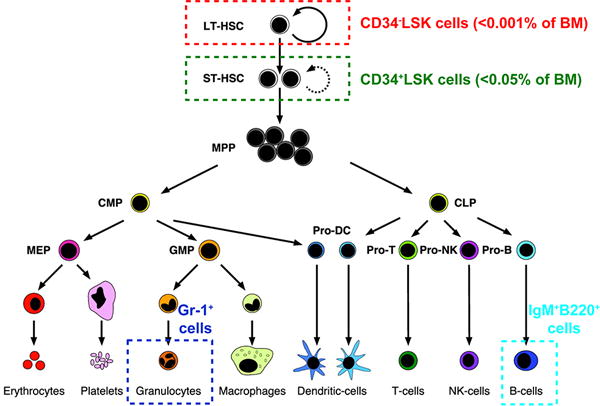
Diagram of hematopoiesis. Populations in analyzed in this study are circled, and cell-specific surface markers are noted. Adapted with permission from ref 31. Copyright 2003 National Academy of Sciences, U.S.A.
MATERIALS AND METHODS
All antibodies were purchased from eBiosciences (San Diego, CA). All other materials were purchased from Fisher Scientific (Hampton, NH) unless otherwise stated.
Substrate preparation
Polyacrylamide (PA) gels (12-mm diameter) were fabricated on of 12.7-mm diameter glass-protected gold mirrors (Thor Labs, Inc., Newton, NJ) and coated with fibronectin (BD Biosciences, San Jose, CA) using previously reported fabrication techniques.4,14,32 In brief, glass-protected gold mirrors were aminosilanized by reaction with 4 M NaOH followed by 3-aminopropyltrimethoxysilane and 0.5% glutaraldehyde. For this study, acrylamide/bisacrylamide concentrations of 5%/0.10% or 10%/0.3% were used to fabricate 3.70 ± 0.08 kPa (“soft”) or 44.2 ± 3.42 kPa (“stiff”) PA gels.4 Tetramethylethylenediamine (1/2,000 v/v) and 10% ammonium persulfate (1/200 v/v) were added to the specified acrylamide/bisacrylamide mixtures. These solutions were quickly placed on the aminosilanized gold mirrors and covered with chlorosilanized glass coverslips for polymerization. After polymerization, the coverslips were removed and the PA gels were thoroughly washed with deionized water. The PA gels were subsequently reacted with 50 mM sulfo-SANPAH under UV (365-nm; UVP, Upland, CA), rinsed with 50 mM HEPES buffer (pH 8.5), and exposed to a fibronectin solution (100 μg/mL in 50 mM HEPES solution, pH 8.5) overnight at 4 °C. This produced a fibronectin coating on the PA gel that promotes hematopoietic cell adherence.
Hematopoietic cell isolation
C57BL6 mice between 4 and 8 weeks of age (The Jackson Laboratory, Bar Harbor, ME) were euthanized with carbon dioxide in compliance with the University of Illinois Institutional Animal Care and Use Committee (IACUC) guidelines.4 Their femurs and tibias were collected, crushed with a mortar and pestle, and filtered through a 40-μm cell strainer to produce whole bone marrow cell suspension in PBS supplemented with 2% fetal bovine serum (FBS) (buffer). Upon lysing red blood cells with ammonium-chloride-potassium (ACK) lysis buffer (Life Technologies, Carlsbad, CA), cells were incubated with Fc receptor blocking antibody (CD16/CD32) to prevent nonspecific binding, and then with the appropriate fluorophore-conjugated antibodies to cell surface markers to isolate LT-HSCs, ST-HSCs, B cells, and granulocytes (Fig. 1). For LT-HSCs and ST-HSCs, marrow cells were incubated with a cocktail of FITC-conjugated lineage (Lin) antibodies (CD5, B220, CD11b, Ly-6G/C, 7-4, Ter-119) as well as phycoerythrin (PE)-conjugated Sca-1, allophycocyanin (APC)-Cy7-conjugated c-Kit, and APC-conjugated CD34 antibodies to isolate CD34−Lin−Sca1+cKit+ (CD34−LSK) LT-HSCs or CD34+LSK ST-HSCs.6,33–34 Alternatively, marrow cells were incubated with FITC-conjugated B220 and eFluor 450-conjugated IgM antibodies to isolate B220+IgM+ B cells, or FITC-conjugated Gr-1 antibody to isolate Gr-1+ granulocytes. For all cell populations, propidium idodide was used to exclude dead cells. Labeled cells were sorted via fluorescence-activated cell sorting (FACS; BD FACSAria™ cell sorter). The purity of the cell populations isolated by FACS is >95%. This high accuracy is critical because PLS-DA models the spectral variance in the calibration set.
Cell culture
Isolated cells were first seeded onto fibronectin-coated PA gels on glass-coated gold mirrors and allowed to settle for up to 3 h before analysis. HSCs were maintained in StemPro®-34 serum free medium (Life Technologies, Carlsbad, CA) supplemented with 10% FBS while B cells or granulocytes were kept in DMEM supplemented with 10% FBS. Although 3 h is likely insufficient to allow the cells to fully recover from the stress of harvesting and sorting, this short culture time was necessary to ensure that the HSCs did not differentiate into more mature progeny prior to analysis. Potential cell stress is not likely to bias the PLS-DA results because all of the cells were subjected to the same isolation procedure and allowed to recover in culture for the same time span.
Raman spectroscopy
Cells on PA gel-coated gold mirrors were fixed in 2% paraformaldehyde and 0.05% glutaraldehyde diluted in 0.2 M Hendry’s phosphate buffer (HPB) for 30 min. Then Raman spectra were acquired at room temperature with a Raman confocal microscope (Horiba LabRAM HR 3D confocal Raman imaging system, 500 μm pinhole, 100 μm slit size, 300 grooves per mm grating) using an Olympus 60×, NA 1.0, water-dipping objective (2mm working distance). A 350 mW 785 nm laser with a diffraction-limited spot size of approximately 1 μm, calculated as 1.22λ/NA, was used to collect the cell spectra; the working spot size appeared to be approximately 3 μm in diameter due to scattering induced by the relatively rough, rounded cell surface. To minimize potential spectral variance caused by the detection of different organelles in each cell, the Raman laser was focused on the central, nuclear region of each cell, and Raman scattering was measured from 600 to 1750 cm−1 for 20 s per cell. The laser spot was small enough that it only covered the cell of interest, and did not include adjacent non-cellular material or neighboring cells. No changes in cell spectra or morphology were observed during Raman imaging.
Spectral analysis
Spectral preprocessing was performed using LabSpec 5 (Horiba Scientific) and the PLS Toolbox (v.6.7.1, Eigenvector Research, Manson, WA) run in MATLAB (7.14.0.739, R2012a, MathWorks Inc., Matick, MA) prior to multivariate analysis. Cosmic spikes and inconsistent peaks were removed manually. The background, which consisted of a large sloping baseline due to autofluorescence and peaks associated with the PA gel, was removed using an automated background subtraction algorithm developed by Beier, et al.35 This eliminated bias caused by subtle differences in the background signals during multivariate analysis. Spectra were aligned using offset alignment (slack = 2) to account for instrumental variation and smoothed using a Sovitzky-Golay algorithm (3rd order polynomial, 13 points). Each spectrum was normalized to the spectral range of 1437 – 1465 cm−1 and mean centered to the data set. This range, which includes a strong peak at 1449 cm−1, is suitable for normalization because it includes various vibrational modes that are produced by numerous cellular protein and lipid components.23,36 Principal component analysis (PCA) and PLS-DA were performed on the preprocessed spectra using the PLS Toolbox run in MATLAB as previously described.14 PCA transforms the data set of Raman spectra into orthogonal principal components (PCs), which are linear combinations of Raman spectral features that capture the maximum variance between each cell spectrum. Spectra from 33, 33, 33, and 36 LT-HSCs, ST-HSCs, granulocytes, and B cells, respectively were used to construct a PCA model consisting of 3 principal components (PCs) that captured 90.6% of the variation in the spectra. Score plots were produced to visual the projections of the individual cells onto the new PCs.
For PLS-DA, the PLS Toolbox run in MATLAB was used to develop a partial least squares regression model that related the Raman peaks in the calibration spectra acquired from LT-HSCs, ST-HSCs, granulocytes, and B cells to a matrix of variables indicative of each sample’s classification (i.e., hematopoietic cell population). Samples that exhibited unusual spectral variance, characterized by Q residual statistics greater than the 95% confidence limit, were removed from the calibration set. The minimum number of latent variables (LVs), which are the linear combinations of Raman spectral features that are most useful for identifying cell type, required to capture at least 80% of the spectral variance were retained in each model. The resulting PLS-DA model was applied to the spectra of “test” cells that were on the same substrates but had not been used for model construction. The numerical prediction values for each hematopoietic cell population were calculated for each sample, and are shown in identification plots. Prediction values that exceed the Bayesian threshold determined for each hematopoietic cell population indicate the sample is a member of that population.
RESULTS
Raman microscopy of hematopoietic cells
A single Raman spectrum was acquired from individual hematopoietic cells of similar morphology and size (4 to 5 μm in diameter) that were seeded on fibronectin-coated PA gels of varying thickness (Fig. S1). Fig. 2a shows the average background-subtracted, baseline-corrected, and normalized spectra from fixed LT-HSCs, ST-HSCs, granulocytes, and B cells seeded on stiff polyacrylamide gels. A modified background-subtraction algorithm was used to remove the large peaks produced by the fibronectin-coated PA gel (Fig. S1) and the broad, sloping baseline that resulted from autofluorescence. Many well-defined peaks corresponding to nucleic acids, proteins, lipids, and carbohydrates are present in the spectra (Table S1). The similarities between the average spectra in Fig. 2a demonstrate the difficulty in identifying cell type by visual inspection of the Raman spectra, and consequently, the need for multivariate analysis. The average mean-centered Raman spectra reveal differences in peak heights between hematopoietic cell populations (Fig. 2b). The most visibly detectable differences in peak height are associated with nucleic acids, notably from the uracil (U), cytosine (C), and thymine (T) ring-breathing modes (782 cm−1), O-P-O stretch (788 cm−1), nucleic acid phosphate backbone (1095 cm−1), and guanine (G) and adenine (A) ring stretch (1575 cm−1). These peaks were generally more pronounced in the HSC spectra than in the more differentiated cell spectra. These peaks also had the highest variability in the spectra, which likely reflects changes in the nucleic acid content during the cell cycle. General protein-related peaks (e.g., C-C/C-N stretch, 1158 cm−1), lipid-related peaks (e.g., C-H deformation, 1437 cm−1), and peaks of unidentified origins (e.g., 711 cm−1 and 1395 cm−1) were pronounced in the mature cell spectra. However, not all protein-related peaks were higher in the spectra of the mature cells as compared to those of HSCs (i.e., C-C/C-N stretch at 1258 cm−1, CH deformation at 1337 cm−1, Phe symmetric ring breathing, 1005 cm−1). Consequently, the intensities of individual protein-related peaks are not reliable indicators of hematopoietic cell differentiation.
Figure 2.
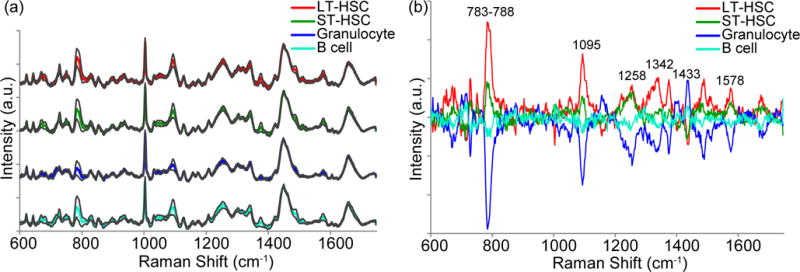
Average Raman spectra of hematopoietic cells and the corresponding mean-centered spectra. (a) Average spectra acquired from single LT-HSCs (red), ST-HSCs (green), granulocytes (blue), and B cells (cyan) using a 785 nm laser over the region 600–1750 cm−1 were baseline-subtracted, normalized to the area under the peak at 1437 – 1465 cm−1, and offset for clarity. Grey lines indicate standard deviation from the average spectra. The spectra were mean-centered (b) to emphasize major sources of spectral variance between the different cell types. Refer to SI for peak assignments.
PLS-DA of Raman spectra enables identifying hematopoietic cell differentiation stage
Multivariate analysis was used to identify lineage-specific features in the spectra from the HSCs and differentiated cells. Spectra from 17, 18, 17, and 18 LT-HSCs, ST-HSCs, granulocytes, and B cells, respectively were used to construct a PLS-DA model consisting of 7 latent variables (LVs) that captured 80.9% of the variation in the calibration spectra. This model was then applied to a test set of spectra acquired from different hematopoietic cells on the same substrates (16, 15, 16, 18 LT-HSCs, ST-HSCs, granulocytes, and B cells, respectively). The cells that exceeded the classification threshold set for each of the four hematopoietic cell populations (red dashed lines, Fig. 3) were identified as members of that population.
Figure 3.
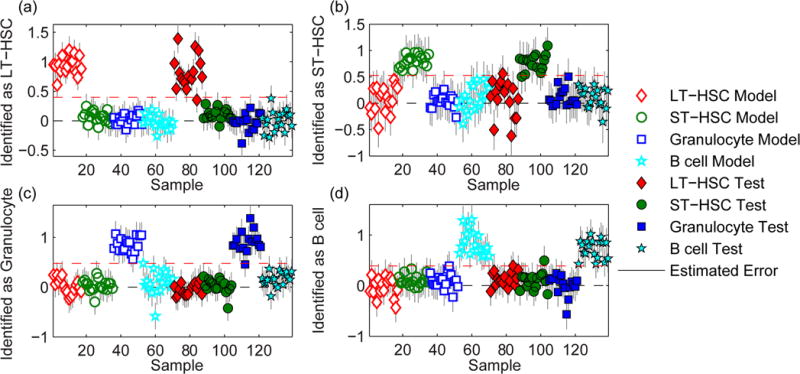
Identification plots for the PLS-DA models generated using Raman spectra of calibration hematopoietic cells that were seeded on the same stiff polyacrylamide gels as the cells in the test set. Cells located above the classification threshold (red dashed line) were identified as (a) LT-HSCs, (b) ST-HSCs, (c) granulocytes, and (d) B cells.
The differentiation stages of the cells in both the calibration and test sets were identified with high sensitivity (1.0 for all classes) and specificity (1.0 for all classes), which are defined as the fraction of cells that were correctly identified as the specified population, and not from the specified population, respectively. The class error of identification, which is the average of the false positive and false negative rates, was 0% for all hematopoietic cell populations in the calibration set, and 3%, 4%, 0%, and 2% for the LT-HSCs, ST-HSCs, granulocytes, and B cells respectively, in the test set. Control experiments excluded the possibility that these accurate cell identifications were based on spectral features produced by the antibody cocktails used to isolate each population by FACS (see Fig. S2 and supplemental experiment in the SI). Remarkably, the PLS-DA model accurately distinguished between not only the fully differentiated granulocytes and B cells, but also the two most immature and closely-related hematopoietic cell populations, LT-HSCs and ST-HSCs.
The spectral variance responsible for separating the four cell types are encoded in the PLS-DA model’s LVs and peak loadings (Fig. 4). Though multiple LVs are required to discriminate between the four cell populations, each population’s average score on an individual LV and the peak loadings for that LV provide insight into their biochemical differences. Such biochemical information can shed light on the process of HSC differentiation. For example, LV1, which captured 12.3% of the variance in the calibration spectra, helped to discriminate the two HSC populations from the mature granulocytes and B cells (Fig. 4a). Based on the LV1 peak loadings, the largely negative LV1 scores for the HSCs indicate they have relatively high nucleic acid-related peak intensities (U, C, T ring breathing, 782 cm−1; O-P-O stretch, 788 cm−1; PO2− stretch, 1095 cm−1; T, G, 669 cm−1; G, A, 1575 cm−1). Conversely, mature hematopoietic cells had primarily positive LV1 scores that denote lower intensities of nucleic acid-associated peaks. The higher DNA content in the two HSC populations may suggest that they have a higher nuclear to cytoplasmic ratio,37 or that they may be proliferating more rapidly than the fully differentiated hematopoietic cell populations.22 Furthermore, the negative LV1 loading of the RNA-related peak (O-P-O-C3′, 811 cm−1) and the positive LV1 loading of the protein-specific peak (Phe symmetric ring breathing, 1005 cm−1) indicate the populations with negative LV1 loadings have relatively higher mRNA to protein ratios than those with positive LV1 loadings.21 This implies that the ST-HSCs and LT-HSCs have higher levels of mRNA relative to proteins, which has been correlated with higher amounts of untranslated mRNA, than the granulocytes and B cells.21 This finding may also suggest that like embryonic stem cells, HSCs contain relatively higher amounts of stable mRNAs that are not being used for protein expression.21 Similarly, the relatively lower mRNA to protein ratio in the differentiated granulocytes and B cells may indicate that during differentiation, this dormant mRNA had been activated and translated into new proteins that were required for differentiation and specialized function.21
Figure 4.
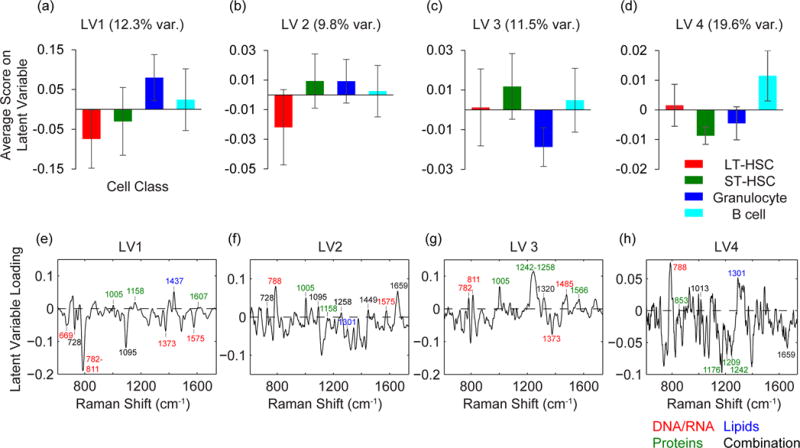
Average latent variable (LV) scores for the hematopoietic cell populations in the PLS-DA model presented in Figure 3. Average scores on LV1 (12.3% variance) (a), LV2 (9.8% variance) (b), LV3 (11.5% variance) (c), and LV4 (19.6% variance) (d) for the calibration LT-HSCs (red), ST-HSCs (green), granulocytes (blue), and B cells (cyan). The corresponding latent variable loadings for LV1 (e), LV2 (f), LV3 (g), and LV4 (h) contain combinations of cell-associated Raman peaks. Refer to SI for peak assignments.
The scores and loadings for the other LVs also helped to distinguish each cell population based on subtle differences in biochemical composition. LV2 captured 9.8% of the variance and indicated higher levels of lipids relative to total cell content in LT-HSCs compared to ST-HSCs and the two mature hematopoietic cell populations (Fig. 4b). LV3 and LV4 captured 11.5% and 19.6%, respectively, of the variance and helped to separate granulocytes and B cells from the other cell populations, respectively (Fig 4c, d). Assignments and interpretation of these LVs are discussed in detail in the supporting information.
Noteworthy, cell differentiation stage could not be accurately identified by using the more common multivariate analysis technique, PCA, to model the Raman spectra. In contrast to PLS-DA, which captures the maximum spectral variation between each population, PCA captures the maximum spectral variance between each cell in the data set. The PCA score plots show that the LT-HSCs, ST-HSCs, granulocytes, and B cells were not separated on the first three PCs, which captured 90.6% of the total variation in the cell spectra (Fig. 5). This inability to discriminate between the LT-HSCs, ST-HSCs, granulocytes, and B cells indicates the PCA model captured significant amounts of intra-population spectral variation that was not useful for identifying cell differentiation stage. Moreover, the standard deviation of each PC score did not vary significantly between the four cell populations, and was comparable to that of all populations combined (Fig. S3), indicating the intra-population spectral variance was substantial in comparison to that between populations. The intra-population spectral variation may arise due to differences in cell cycle phase and metabolism of cells at the same lineage-specific differentiation stage. In addition, it may also result from slight differences in laser centering on each cell during spectral acquisition, and natural deviations in the intracellular positions of the nucleus and other organelles.
Figure 5.
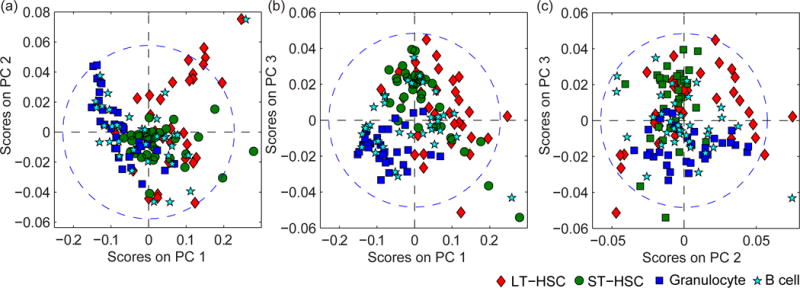
Score plots for the PCA model generated using Raman spectra of hematopoietic cells seeded on stiff polyacrylamide gels. Score plots for (a) PC1 (81.6% of variance) and PC2 (5.25% of variance), (b) PC1 and PC3 (3.67% of variance), and (c) PC2 and PC3 account for the majority of the spectral variance in the dataset. The ellipse in each PC model represents the border for the entire model at the 95% confidence limit.
Altogether, these results show that PLS-DA, but not PCA, of Raman spectra enables detecting subtle spectral variations between biochemically similar HSCs at the single cell level. Presently, this may be the only technique that can discriminate between multiple closely related cell populations in situ and on the single cell level.
Identification of the differentiation status of hematopoietic cells on substrates of differing composition
We assessed whether the differentiation status of hematopoietic cells seeded on PA gels of differing stiffness could be accurately identified by PLS-DA of background-corrected Raman spectra. To remove substrate-related intra-population variance, a PLS-DA model was constructed of spectra from cells seeded on both stiff (44.2 kPa) and soft (3.7 kPa) PA gels for each hematopoietic cell population. The resulting PLS-DA model, which consisted of 11 LVs that captured 81.3% of the variance in the calibration spectra, yielded class identification errors of 2%, 0%, 1%, and 1% for LT-HSCs, ST-HSCs, granulocytes, and B cells, respectively, in the calibration set, and 4%, 5%, 10%, and 3% for LT-HSCs, ST-HSCs, granulocytes, and B cells, respectively, in the test set (Fig. 6). This indicates that the differences in substrate stiffness, and thus, composition, did not interfere with accurately identifying hematopoietic cell lineage when the PLS-DA model was constructed from calibration spectra from cells seeded on each of the different substrates that supported the cells in the test set.
Figure 6.
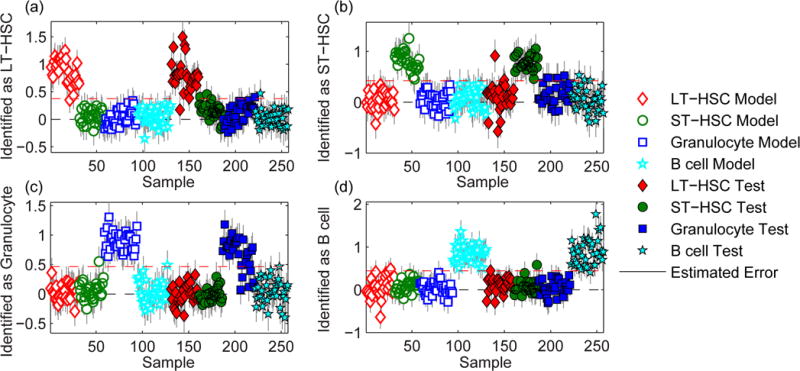
Identification plots for the PLS-DA models generated using Raman spectra of calibration hematopoietic cells seeded on stiff and soft polyacrylamide gels were used to classify a test set of hematopoietic cells seeded on stiff and soft polyacrylamide gels. Cells located above the classification threshold (red dashed line) were identified as (a) LT-HSCs, (b) ST-HSCs, (c) granulocytes, and (d) B cells.
DISCUSSION AND CONCLUSIONS
Here we addressed the demand for label-free methods to identify the lineage-specific differentiation status of individual hematopoietic cells with location specificity. We have shown that PLS-DA of Raman spectra enables objectively discriminating very closely related LT-HSC and ST-HSC populations, as well as their fully differentiated progeny despite the absence of phenotypic products with distinctive Raman signatures. In the absence of peaks characteristic of each cell type analyzed, PLS-DA pinpointed population-specific differences in the relative intensities of combinations of Raman peaks that were common to multiple cell populations. As cell lineage identification was based on a quantifiable threshold, and not the user’s opinion, we expect that this objective approach will decrease the intra- and inter-user variability of single cell identification as compared to single cell immunofluorescence measurements.
We carefully selected our data processing methods to unmask the subtle spectral differences that were related to hematopoietic cell differentiation status in the presence of potential within-population spectral variation arising from cell cycle status and substrate composition. We found that a published background selection technique35 reduced the contributions from the substrate in the cell spectra. Furthermore, we found that PLS-DA more accurately identified cell differentiation state than PCA, which is more frequently applied to Raman data in cell identification studies.15,25,29 As is evident in our model, PCA captures the maximum spectral variation between samples even if it is not useful for classification (i.e., peaks related to cell cycle status). PLS-DA is more useful for predicting sample identity because unlike PCA, PLS-DA captures the spectral variation between populations. Consequently, PLS-DA deemphasizes potential intra-population spectral variation that may arise due to differences in cell cycle status or the precise position of the laser on each cell in relation to intracellular components. Likewise, the use of spectra acquired from LT-HSCs, ST-HSCs, granulocytes and B cells supported on both stiff and soft substrates for PLS-DA model construction deemphasized the intra-population spectral variation related differences in substrate stiffness. This capacity for location-specific, accurate identification of cell fate independent of substrate-related spectral variance combined with our ability to fabricate biomaterials containing compositional gradients enables screening HSC response to a multitude of microenvironents on a single substrate.9
In this proof of concept work, we employed fixed cells in order to ensure they would not differentiate or otherwise change their functional state before analysis. We expect that analysis of living hematopoietic cells on screening platforms would yield similarly low errors of classification because our previous studies indicated our identification accuracy is similar for fixed and living cells.38 In addition, cell identification is not compromised by proximity to other cell types within a coculture system.38 Furthermore, others have shown that the repeated collection of Raman spectra from the same human embryonic stem cells using 785 nm laser did not affect the cells’ viability or differentiation potential.16 Thus, the noninvasive nature of this approach may allow observing the temporal development of cell fate decisions, which could enable dynamically adjusting the culture environment to steer HSC differentiation.
In summary, we have demonstrated the feasibility of utilizing Raman spectroscopy and PLS-DA to identify the lineage-specific differentiation stages of individual hematopoietic cells, including those from the rarest and most primitive LT-HSC and less primitive ST-HSC populations, on complex substrates. We expect that future efforts to include additional rare and primitive hematopoietic cell subpopulations or intermediate subpopulations during differentiation to a specific lineage, namely multipotent progenitors, common lymphoid progenitors and common myeloid progenitors, in our PLS-DA model would greatly facilitate efforts to identify the cellular and matrix cues that direct early HSC fate decisions.
Supplementary Material
Acknowledgments
Raman microspectroscopy was performed in the Microscopy Suite of the Imaging Technology Group at the Beckman Institute for Advanced Science and Technology, University of Illinois. The authors would like to acknowledge Barbara Pilas (Flow Cytometry Facility, UIUC) as well as Mr. Bhushan Mahadik (ChBE, UIUC) for assistance with bone marrow cell isolation and flow cytometry sorting. This material is based upon work supported by the National Science Foundation under Grant No. 1254738 (BACH). Research reported in this publication was supported by the National Institute of Diabetes and Digestive and Kidney Diseases of the National Institutes of Health under Award Number R01 DK099528 (BACH), R21 EB018481 (BACH, MLK), and the NIH Training Program in the Chemistry-Biology Interface T32 GM070421. The content is solely the responsibility of the authors and does not necessarily represent the official views of the National Institutes of Health. The authors wish to acknowledge additional funding provided by the Dept. of Chemical and Biomolecular Engineering at the University of Illinois.
Footnotes
Supporting information: Additional information as noted in text, including a table of Raman peak assignments, raw Raman spectra of stiff and soft polyacrylamide gels with and without ST-HSCs seeded on them, results of supplemental experiments, and additional information about the PCA and PLS-DA models are included in the supporting information. This material is available free of charge via the internet at http://pubs.acs.org.
References
- 1.Smith JN, Calvi LM. Stem Cells. 2013;31:1044–50. doi: 10.1002/stem.1370. [DOI] [PMC free article] [PubMed] [Google Scholar]
- 2.Lee-Thedieck C, Spatz JP. Macromol Rapid Commun. 2012;33:1432–1438. doi: 10.1002/marc.201200219. [DOI] [PubMed] [Google Scholar]
- 3.Lo Celso C, Scadden DT. J Cell Sci. 2011;124:3529–3535. doi: 10.1242/jcs.074112. [DOI] [PMC free article] [PubMed] [Google Scholar]
- 4.Choi JS, Harley BAC. Biomaterials. 2012;33:4460–4468. doi: 10.1016/j.biomaterials.2012.03.010. [DOI] [PubMed] [Google Scholar]
- 5.Dellatore SM, Garcia AS, Miller WM. Curr Opin Biotechnol. 2008;19:534–540. doi: 10.1016/j.copbio.2008.07.010. [DOI] [PMC free article] [PubMed] [Google Scholar]
- 6.Kiel MJ, Yilmaz OH, Iwashita T, Yilmaz OH, Terhorst C, Morrison SJ. Cell. 2005;121:1109–1121. doi: 10.1016/j.cell.2005.05.026. [DOI] [PubMed] [Google Scholar]
- 7.Ranga A, Lutolf MP. Curr Opin Cell Biol. 2012;24:236–244. doi: 10.1016/j.ceb.2012.01.006. [DOI] [PubMed] [Google Scholar]
- 8.Peerani R, Zandstra PW. J Clin Invest. 2010;120:60–70. doi: 10.1172/JCI41158. [DOI] [PMC free article] [PubMed] [Google Scholar]
- 9.Mahadik B, Wheeler T, Skertich LJ, Kenis PJA, Harley BA. Adv Healthcare Mater. 2014;3:449–458. doi: 10.1002/adhm.201300263. [DOI] [PubMed] [Google Scholar]
- 10.Purton LE, Scadden DT. Cell Stem Cell. 2007;1:263–270. doi: 10.1016/j.stem.2007.08.016. [DOI] [PubMed] [Google Scholar]
- 11.Perry JM, Li L. In: Cellular Programming and Reprogramming: Methods and Protocols. Ding S, editor. 2010. pp. 45–54. [Google Scholar]
- 12.Manos PD, Ratanasirintrawoot S, Loewer S, Daley GQ, Schlaeger TM. Curr Protoc Stem Cell Biol. John Wiley & Sons, Inc; 2007. pp. C.12.1–1C.12.14. [DOI] [PubMed] [Google Scholar]
- 13.Goldstein M, Watkins S. Curr Protoc Mol Biol. John Wiley & Sons, Inc; 2008. pp. 14.6.1–14.6.23. [DOI] [PubMed] [Google Scholar]
- 14.Frisz JF, Choi JS, Wilson RL, Harley BAC, Kraft ML. Anal Chem. 2012;84:4307–4313. doi: 10.1021/ac203329j. [DOI] [PMC free article] [PubMed] [Google Scholar]
- 15.Schulze HG, Konorov SO, Caron NJ, Piret JM, Blades MW, Turner RFB. Anal Chem. 2010;82:5020–5027. doi: 10.1021/ac902697q. [DOI] [PubMed] [Google Scholar]
- 16.Pascut FC, Kalra S, George V, Welch N, Denning C, Notingher I. Biochim Biophys Acta. 2013;1830:3517–3524. doi: 10.1016/j.bbagen.2013.01.030. [DOI] [PubMed] [Google Scholar]
- 17.Hung P-S, Kuo Y-C, Chen H-G, Chiang H-HK, Lee OK-S. PLoS One. 2013;8:e65438. doi: 10.1371/journal.pone.0065438. [DOI] [PMC free article] [PubMed] [Google Scholar]
- 18.McManus LL, Burke GA, McCafferty MM, O’Hare P, Modreanu M, Boyd AR, Meenan BJ. Analyst. 2011;136:2471–2481. doi: 10.1039/c1an15167c. [DOI] [PubMed] [Google Scholar]
- 19.Chiang HK, Peng F-Y, Hung S-C, Feng Y-C. J Raman Spectrosc. 2009;40:546–549. [Google Scholar]
- 20.Pascut FC, Goh HT, George V, Denning C, Notingher I. J Biomed Opt. 2011;16:045002. doi: 10.1117/1.3570302. [DOI] [PubMed] [Google Scholar]
- 21.Notingher I, Bisson I, Bishop AE, Randle WL, Polak JMP, Hench LL. Anal Chem. 2004;76:3185–3193. doi: 10.1021/ac0498720. [DOI] [PubMed] [Google Scholar]
- 22.Notingher I, Bisson I, Polak JM, Hench LL. Vib Spectrosc. 2004;35:199–203. [Google Scholar]
- 23.Chan JW, Lieu DK, Huser T, Li RA. Anal Chem. 2009;81:1324–1331. doi: 10.1021/ac801665m. [DOI] [PMC free article] [PubMed] [Google Scholar]
- 24.Azrad E, Zahor D, Vago R, Nevo Z, Doron R, Robinson D, Gheber LA, Rosenwaks S, Bar I. J Raman Spectrosc. 2006;37:480–486. [Google Scholar]
- 25.Kim BS, Lee CCI, Christensen JE, Huser TR, Chan JW, Tarantal AF. Stem Cells Dev. 2008;17:185–198. doi: 10.1089/scd.2007.0076. [DOI] [PubMed] [Google Scholar]
- 26.Ghita A, Pascut FC, Mather M, Sottile V, Notingher I. Anal Chem. 2012;84:3155–3162. doi: 10.1021/ac202994e. [DOI] [PubMed] [Google Scholar]
- 27.Konorov SO, Schulze HG, Gage BK, Kieffer TJ, Piret JM, Blades MW, Turner RFB. Anal Chem. 2015 doi: 10.1021/acs.analchem.5b03295. [DOI] [PubMed] [Google Scholar]
- 28.Ramoji A, Neugebauer U, Bocklitz T, Foerster M, Kiehntopf M, Bauer M, Popp J. Anal Chem. 2012;84:5335–5342. doi: 10.1021/ac3007363. [DOI] [PubMed] [Google Scholar]
- 29.Chan JW, Taylor DS, Zwerdling T, Lane SM, Ihara K, Huser T. Biophys J. 2006;90:648–656. doi: 10.1529/biophysj.105.066761. [DOI] [PMC free article] [PubMed] [Google Scholar]
- 30.Ilin Y, Kraft ML. Curr Opin Biotechnol. 2015;31:108–116. doi: 10.1016/j.copbio.2014.10.011. [DOI] [PMC free article] [PubMed] [Google Scholar]
- 31.Passegue E, Jamieson CH, Ailles LE, Weissman IL. Proc Natl Acad Sci USA. 2003;100(Suppl. 1):11842–9. doi: 10.1073/pnas.2034201100. [DOI] [PMC free article] [PubMed] [Google Scholar]
- 32.Tse JR, Engler AJ. Curr Protoc Cell Biol. 2010:16. doi: 10.1002/0471143030.cb1016s47. Chapter 10, Unit 10. [DOI] [PubMed] [Google Scholar]
- 33.van Galen P, Kreso A, Mbong N, Kent DG, Fitzmaurice T, Chambers JE, Xie S, Laurenti E, Hermans K, Eppert K, Marciniak SJ, Goodall JC, Green AR, Wouters BG, Wienholds E, Dick JE. Nature. 2014;510:268–272. doi: 10.1038/nature13228. [DOI] [PubMed] [Google Scholar]
- 34.Yang L, Bryder D, Adolfsson J, Nygren J, Mansson R, Sigvardsson M, Jacobsen SE. Blood. 2005;105:2717–2723. doi: 10.1182/blood-2004-06-2159. [DOI] [PubMed] [Google Scholar]
- 35.Beier BD, Berger AJ. Analyst. 2009;134:1198–1202. doi: 10.1039/b821856k. [DOI] [PubMed] [Google Scholar]
- 36.Notingher I, Verrier S, Haque S, Polak JM, Hench LL. Biopolymers. 2003;72:230–240. doi: 10.1002/bip.10378. [DOI] [PubMed] [Google Scholar]
- 37.Spangrude G, Heimfeld S, Weissman I. Science. 1988;241:58–62. doi: 10.1126/science.2898810. [DOI] [PubMed] [Google Scholar]
- 38.Ilin Y, Kraft ML. Analyst. 2014;139:2177–2185. doi: 10.1039/c3an02156d. [DOI] [PMC free article] [PubMed] [Google Scholar]
Associated Data
This section collects any data citations, data availability statements, or supplementary materials included in this article.