Abstract
The PLP-dependent transaminase (BioA) of Mycobacterium tuberculosis and other pathogens that catalyzes the second step of biotin biosynthesis is a now well-validated target for antibacterial development. Fragment screening by differential scanning fluorimetry has been performed to discover new chemical scaffolds and promote optimization of existing inhibitors. Calorimetry confirms binding of six molecules with high ligand efficiency. Thermodynamic data identifies which molecules bind with the enthalpy driven stabilization preferred in compounds that represent attractive starting points for future optimization. Crystallographic characterization of complexes with these molecules reveals the dynamic nature of the BioA active site. Different side chain conformational states are stabilized in response to binding by different molecules. A detailed analysis of conformational diversity in available BioA structures is presented, resulting in the identification of two states that might be targeted with molecular scaffolds incorporating well-defined conformational attributes. This new structural data can be used as part of a scaffold hopping strategy to further optimize existing inhibitors or create new small molecules with improved therapeutic potential.
INTRODUCTION
Tuberculosis (TB) caused by Mycobacterium tuberculosis (Mtb) and related Mycobacterium species remains a significant threat to global public health.1, 2 Mtb is among the most challenging bacterial infections to treat, requiring daily combination therapy of up to four drugs for at least six months in uncomplicated drug-sensitive infections.3 This extraordinarily long and complex treatment regimen is attributed to Mtb’s slow growth and ability to switch its metabolism to a nonreplicating state that is antibiotic tolerant.4, 5 As with other infectious diseases, drug resistance is also a serious problem that is compromising our ability to treat TB.2, 6 Consequently, there is a great need for new antitubercular agents effective against drug-resistant TB with novel mechanisms of action.7
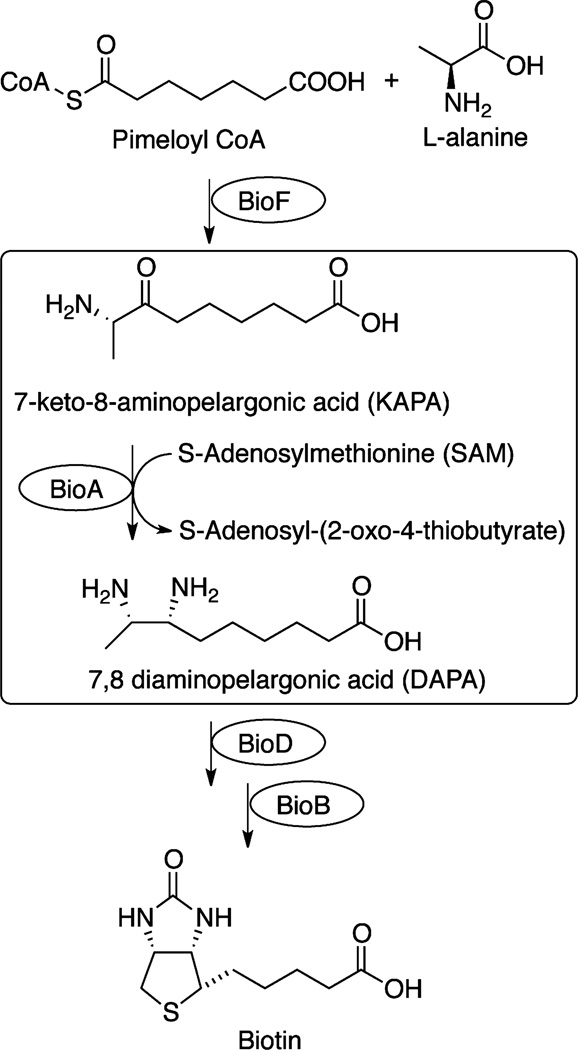
Biotin is an essential cofactor required for fatty acid metabolism, amino acid biosynthesis, and gluconeogenesis.8 Mtb synthesizes biotin de novo because the concentration of biotin available in human serum9 is too low to support bacterial colonization and growth. The first evidence for the importance of biotin biosynthesis in Mtb10 was provided from the landmark transposon mutagenesis study by Sassetti and Rubin, who showed that each gene in the biotin operon is essential for Mtb replication in vivo.10 Biotin biosynthesis from pimeloyl-CoA to biotin is accomplished in four well established steps (Scheme 1).11 The second step, resulting in the amination of 7-keto-8-aminopelargonic acid (KAPA) to 7,8-diaminopelargonic acid (DAPA), is carried out by a PLP-dependent transaminase (BioA) encoded by bioA.12 Phenotypic screening identified amiclenomycin as a potent and specific antitubercular agent, whose mechanism of action is due to inhibition of BioA.13–16 On the basis of the chemical validation provided by amiclenomycin, Schnappinger and co-workers, using a regulated gene expression system, also demonstrated that bioA is essential for persistence in a murine TB model.17 These results establish BioA as an extremely promising target for therapeutic development.
Scheme 1.
Biosynthesis of Biotin in Mtb
There has been considerable effort aimed at identifying small molecule inhibitors of BioA as potential antitubercular agents. These include compounds identified through conventional in vitro biochemical screening,19 an irreversible mechanism-based inhibitor inspired from amiclenomycin,20 and reversible covalent hydrazines.21, 22 Most recently, a collection of potent inhibitors of diverse chemotypes have been identified by a combination of high-throughput screening with a biochemical assay, followed by phenotypic assessment employing isogenic Mtb strains that under- and overexpress BioA.23 Significantly, these studies identified compounds with BioA- and biotin-dependent whole-cell activity. Many of these inhibitors have also been the subject of structural studies that have shown BioA is a particularly dynamic protein capable of adapting to ligand binding in a variety of ways.18, 20, 22, 23
Here, the results of a fragment-based campaign to identify new inhibitors are presented. A fragment-based approach offers a means to empirically identify molecules with high ligand efficiency that can be exceptional starting points in new inhibitor design.24 Structural characterizations of fragment binding can often reveal small conformational changes induced by ligands that expose previously unknown subsites or chemical group interactions that can be exploited in future inhibitor design. In this study, differential scanning fluorimetry (DSF) has been used to identify compounds from a diverse library of small molecules that shift the temperature of denaturation (the Tm) of BioA. Hits have been structurally characterized using crystallography and binding thermodynamics studied by isothermal titration calorimetry (ITC). These new structural studies further expand upon previously reported conformational diversity of the BioA enzyme. New fragment structures raise an awareness that structural features common to diverse inhibitor chemotypes may induce similar protein conformations.
RESULTS
Differential scanning fluorimetry (DSF) was used to screen the Maybridge Ro3 fragment library for compounds that shift the holo BioA Tm (85 °C) by greater than ±2 °C. This cutoff afforded a 2% hit rate for subsequent follow-up by crystallography. Of nearly 1000 compounds screened, 21 shifted the Tm in excess of this threshold; nine caused upward (stabilizing) Tm shifts averaging +3.8 °C, while 12 caused downward (destabilizing) Tm shifts averaging −13.8 °C. A complete list of molecules identified (F1−F21) is included as Supporting Information (Table S1).
An effort was made to obtain cocrystal structures of all 21 DSF hits with BioA to confirm binding. To evaluate compounds rapidly, initial soaking experiments were performed using preformed holo BioA crystals and a fixed small molecule concentration of 5 mM. By this method, complex structures with fragments F2, F3, F5, F7, and F10 could be obtained. Further increases of the compound concentration (to 10 mM) did not generate more complex structures. Later, cocrystallization methods were also applied to remaining compounds, and one more complex structure (F9) was obtained. The structures of crystallographically confirmed fragment hits and the corresponding Tm shifts are in Table 1. DSF melting curves acquired from these compounds during screening are collected in Supporting Information Figure S1.
Table 1.
Crystallographically Confirmed Fragment Hits
| ID | Structure | M.W. (Da) |
CLogP |
Tm
shift (°C) |
|---|---|---|---|---|
| F2 |  |
204.25 | 0.7 | +6.3±0.3 |
| F3 | 187.20 | 1.3 | +4.1±0.2 | |
| F5 |  |
201.27 | 1.6 | +5.3±0.3 |
| F5.1 |  |
221.69 | 1.9 | −11.9±2.1 |
| F7 |  |
189.25 | 1.2 | +3.6±0.2 |
| F9 |  |
189.21 | 1.2 | +3.6±0.2 |
| F10 |  |
164.23 | 1.0 | −6.5±0.3 |
Crystal structures for each complex have been determined at between 1.35 and 2.50 Å resolution (Supporting Information Table S2). The structure of the complex with F10 has been previously reported;22 it is included in this report only for comparison. All structures exist in the previously described orthorhombic (P212121) crystal form with two protein chains in the asymmetric unit, accept for the complex with F2. Nonequivalent binding by the ligand to different protein chains results in a breakdown of crystallographic symmetry in this complex, which exhibits only P21 space group symmetry.
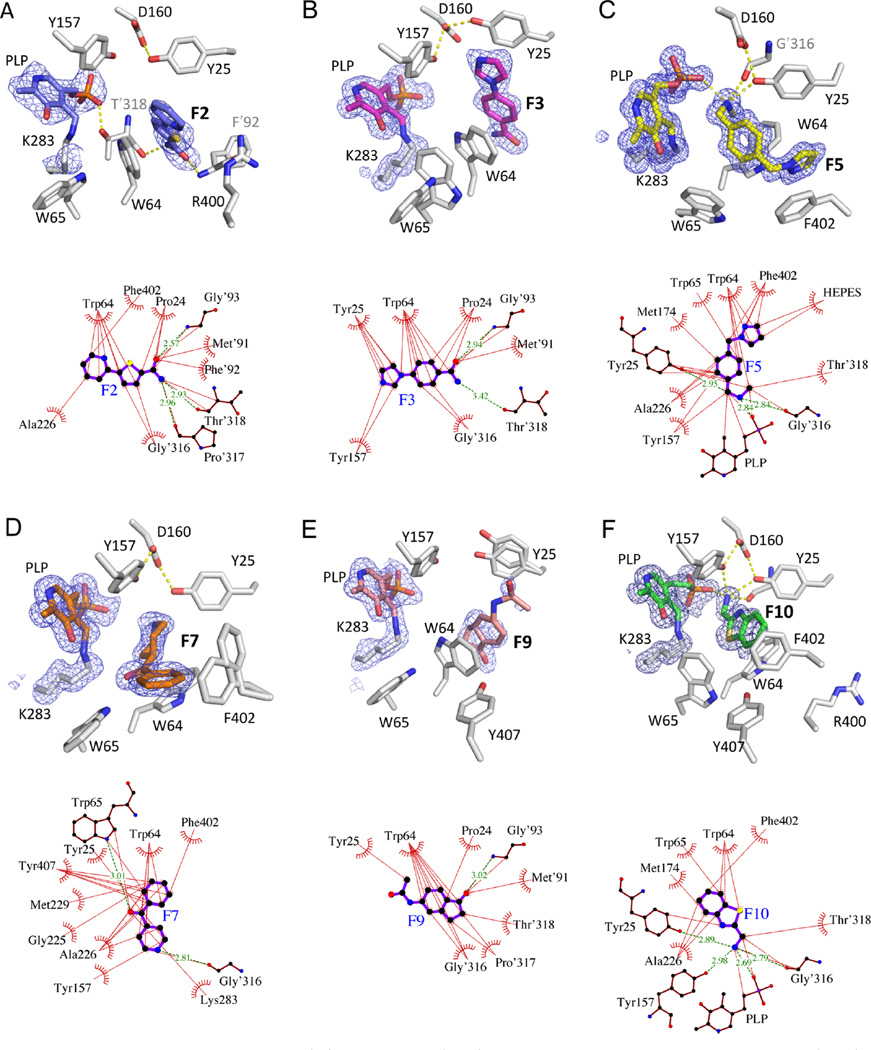
All fragment compounds bind in a hydrophobic pocket adjacent to the PLP cofactor of BioA but do not disrupt the internal aldimine that defines the resting state of the enzyme. Electron densities (Figure 1) clearly confirm that the covalent bond between Lys283 and the PLP in all complexes remains intact.
Figure 1.
Fragments in BioA active site. Omit Fo − Fc (3σ) electron density (mesh) is displayed about the PLP cofactor and bound ligand (above), and ligand interaction maps relating BioA and fragment molecules (below). (A) F2; (B) F3; (C) F5; (D) F7; (E) F9; (F) F10. Hydrogen bonds are shown as green dashed lines with distances (Å). Hydrophobic contacts shorter than 3.9 Å are identified by thin dashed lines. Interaction maps prepared with LigPlot+.31
The two active sites of Mtb BioA are formed at the interface between two monomers of a functional homodimer, composed of residues Pro24−Ser34, Ser62−Ala67, Arg156−Asp160, His171−Arg181, Gln224−Gly228, and Arg400−Arg403 of one chain, and Met′87−His′97 and Ala′307−Asn′322 of the other. (Here and after, residues marked with a prime are contributed by the other monomer chain). Our previous structural characterization of the prereaction complex of BioA with substrate KAPA has confirmed that substrates bind in a narrow tunnel that reaches inward toward the PLP cofactor with a very small exit toward solvent.22 The PLP and side chains of Tyr25, Trp64, Trp65, Arg401, and Phe402 dominate the surface area in the interior of this pocket, with lesser contributions from Ala226, Tyr157, Asp160, and Thr′318. The outer rim of the tunnel is composed of hydrophobic loops from both chains (His171− Arg181, Ala′307−Met′314, Arg400−Arg403, Met′87−His′97).
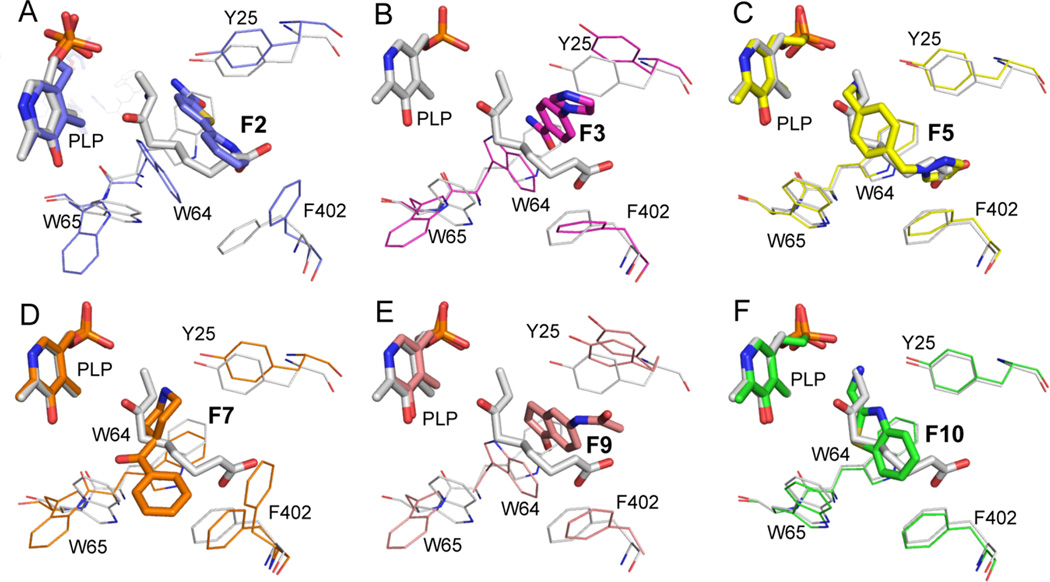
All six fragments bind in some portion of this active site. A summary of contacts that exist between each fragment and BioA is presented in the interaction diagrams of Figure 1. Ligand orientations are compared to KAPA in the panels of Figure 2. F2, F5, and F10 occupy much the same volume as KAPA (Figure 2), while F3, F7, and F9 induce a number of novel conformational changes to surrounding amino acid side chains, creating opportunities for nonpolar stacking that KAPA cannot exploit. The six fragments represent five distinct chemotypes with very different binding modes; only F2 and F3 bind similarly. A more detailed analysis of protein structural differences is presented in the discussion below.
Figure 2.
Fragment binding induces side chain conformational differences. The KAPA-bound reference structure (gray) is compared to a different structure in each panel: (A) F2; (B) F3; (C) F5; (D) F7; (E) F9; (F) F10. The common orientation of view of all complexes underscores the differences in the position and orientation seen in the binding of different fragments.
Some active sites are unoccupied in crystal structures (Supporting Information Table S2), and fragments F2 and F3 are found in different orientations in different asymmetric units. These are rigid, largely planar molecules that occupy one orientation in one binding site but flip end-to-end to occupy a different orientation in another binding site (Supporting Information Figure S2). In the flipped F2 complex, the pyridine replaces the amide and vice versa. In the case of F3, the amide replaces the imidazole. The common interactions anchoring both ligands arise from the orientation-independent stacking of the planar ligand against Trp64. Our discussion will be restricted to the orientation that emphasizes the coalignment of the amide functional group common to both fragments. In this position, the amide of both molecules makes H-bonds to the NH of Gly′93 and to the backbone carbonyl O of Thr′318.
Once active site binding was confirmed crystallographically, isothermal titration calorimetry (ITC) was conducted to determine binding affinities and ligand efficiencies for each fragment. Thermodynamic parameters determined by ITC are tabulated in Table 2, and raw injection profiles are illustrated in Supporting Information Figure S3. Binding affinities for fragments vary between 7 and 42 µM. These affinities translate into very good ligand efficiencies in the range of 0.43−0.55 (Table 2).
Table 2.
Thermodynamic Parameters of Ligand Association with BioA
| ID | ΔH, kcal mol−1 | KA, 104 M−1 | ΔG, kcal mol−1 | −TΔS, kcal mol−1 | KD, (μM) | ligand H-bonds | LEa |
|---|---|---|---|---|---|---|---|
| F2 | −5.4 ± 0.0 | 14.6 ± 1.3 | −7.0 ± 0.1 | −1.6 ± 0.1 | 6.9 ± 0.7 | 3 | 0.50 |
| F3 | −6.3 ± 0.2 | 6.8 ± 1.3 | −6.6 ± 0.1 | −0.2 ± 0.1 | 15.0 ± 2.7 | 2 | 0.47 |
| F5 | −12.9 ± 0.6 | 8.6 ± 0.1 | −6.7 ± 0.0 | 6.2 ± 0.6 | 11.7 ± 0.2 | 3 | 0.45 |
| F7 | −4.9 ± 0.2 | 2.4 ± 0.4 | −6.0 ± 0.1 | −1.1 ± 0.2 | 41.8 ± 6 | 2 | 0.43 |
| F9 | −3.3 ± 0.2 | 4.6 ± 0.3 | −6.3 ± 0.0 | −3.0 ± 0.2 | 21.7 ± 1.5 | 1 | 0.45 |
| F10 | −1.4 ± 0.2 | 3.3 ± 0.5 | −6.1 ± 0.1 | −4.8 ± 0.1 | 30.3 ± 4.0 | 3 | 0.55 |
| F5.1 | −11.3 ± 0.5 | 14.9 ± 1.7 | −7.0 ± 0.1 | 4.3 ± 0.5 | 6.8 ± 0.8 | 3 | 0.47 |
Ligand efficiency was calculated using the equation LE = (−ΔG)/N where N is the number of non-hydrogen atoms in the molecule.
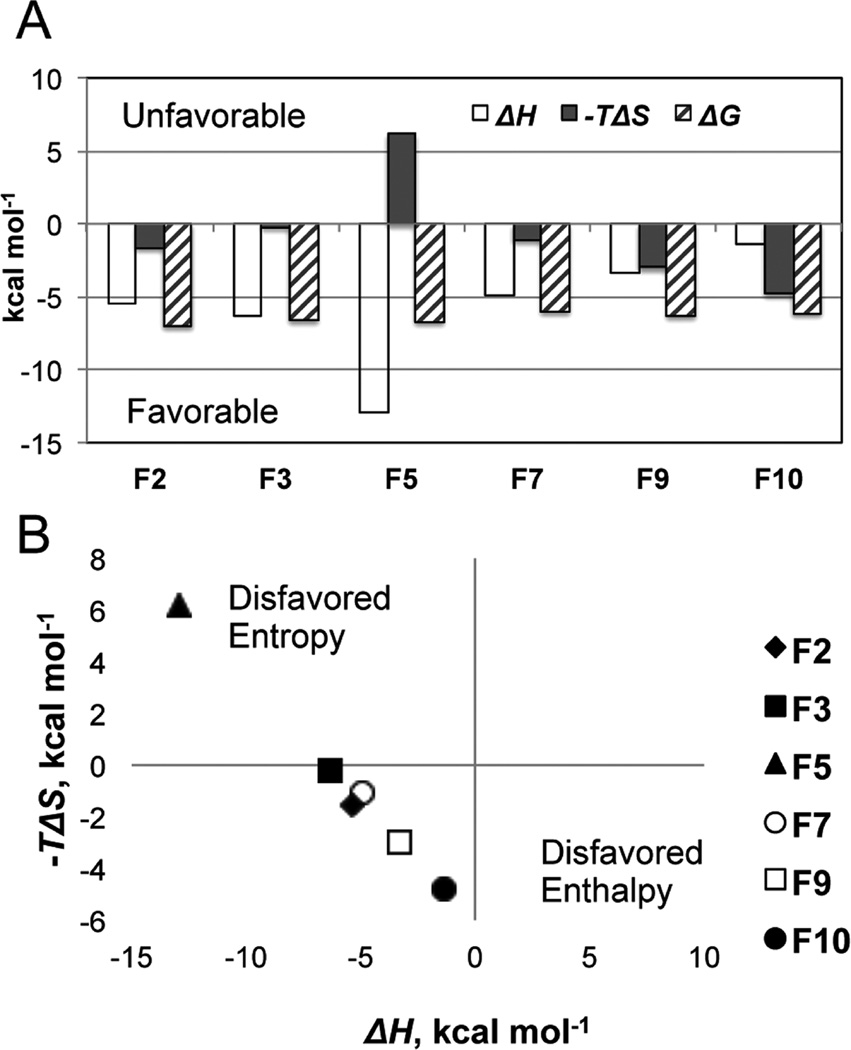
Calorimetry also permits determination of enthalpic and entropic contributions to the total free energy of binding, and some have argued that enthalpy driven binding represents a stronger starting point for structure-guided lead optimization.25 For most of these fragments, the overall ΔG arises from balanced contributions of both enthalpy and entropy (Figure 3). The one exception is F5, with binding that is clearly enthalpy driven. Of all the fragments identified, F5 has the greatest number of freely rotatable bonds (4) which must be immobilized upon binding, likely accounting for the unfavorable binding entropy (−TΔS = +6.2 kcal/mol). This fragment also makes good specific H-bonds with Tyr25 and the PLP phosphate, and numerous weaker nonpolar interactions, including effective stacking with both Trp64 and Phe402 that lead to a larger enthalpic stabilization (ΔH = −12.9 kcal/mol).
Figure 3.
Thermodynamic characterization of the fragment binding. (A) Histogram of the ΔH (open bars), −TΔS (filled bars), and ΔG (hatched bars). Negative values are favorable for binding. (B) Plot analyzing the enthalpic and entropic components of the binding energy and predictable enthalpy−entropy compensation. The binding of F5 is enthalpy driven; the binding of other fragments is enthalpy−entropy driven.
Finally, confirmed fragments were evaluated against a virulent Mycobacterium tuberculosis wild-type (WT) strain (H37Rv) in a standard 96-well plate assay to assess potential inhibition of cell growth as previously described.23 Compounds were also tested against an Mtb strain that underexpresses BioA (Mtb BioA-UE) relative to WT Mtb and is thus more sensitive to BioA inhibition. BioA is only required for growth of Mtb in media that do not contain biotin.17 Inhibition of bacterial growth was therefore measured in media containing 0 nM biotin (for WT and BioA-UE) and 1000 nM biotin (for WT). The measurements with WT Mtb in biotin-supplemented media serves as a target-specific control. All six fragment hits were studied at concentrations ranging from 4 to 1000 µM. Growth curves are illustrated in Supporting Information Figure S4, and IC50 values against each strain are summarized in Supporting Information Table S3. Only fragment F2 showed significant inhibition of growth in a BioA-specific manner. Against the more sensitive Mtb BioA-UE strain, the IC50 was 39 µM. Measurable inhibition of WT Mtb was also observed (249 µM) but only in biotin-free media. F2 therefore appears to have a modest but measurable antitubercular activity with origins in the inhibition of biotin biosynthesis.
Commercially available analogues of F5 and F10 were obtained and characterized. The analysis of analogues of F10 (the fragment with highest ligand efficiency) led to the identification of a series of aryl hydrazines and hydrazides that are reversible covalent modifiers of the PLP cofactor that have been described elsewhere.22
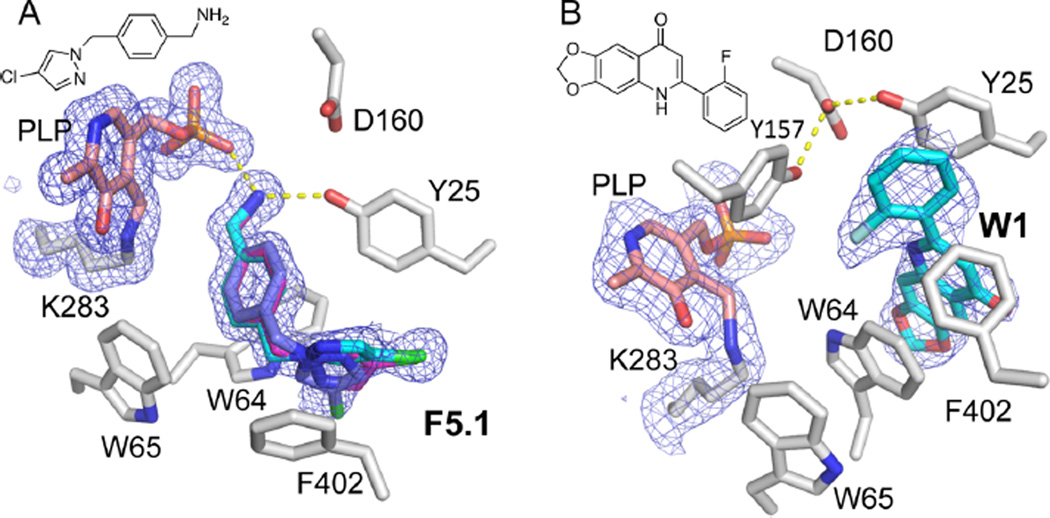
Compound F5.1 was investigated as an analogue of F5. This molecule incorporates a primary amine in place of the secondary amine of F5 and a halide substitution on the imidazole. By ITC, F5.1 exhibits a KD for BioA of 6.8 µM, a modest (1.7-fold) improvement over the parent fragment F5. Thermodynamic parameters indicate that binding is also enthalpy-driven with an improved ligand efficiency (Table 2). Interestingly, by DSF, F5.1 induces a destabilizing Tm shift to 73 °C (ΔTm = −12 °C). This is quite unexpected given the +5 °C shift induced by F5.
A crystal structure of the complex with F5.1 has been determined at 1.62 Å resolution (Supporting Information Table S2) and is illustrated in Figure 4A. The compound appears to occupy the binding site in three discrete conformations that differ in rotation about the imidazole plane, but binding otherwise closely resembles that seen by F5. The conformations of the key residues (Tyr25, Trp64, Trp65, Phe402) in the BioA active site are also unchanged from the F5 complex.
Figure 4.
A comparison of BioA complexes with compounds F5.1 and W1. (A) Complex with compound F5.1 and (B) with W1. Electron density (3σ Fo − Fc omit) for the ligand, Lys383, and the PLP is shown for each complex (mesh). F5.1 is modeled in three discrete conformations that differ in the orientation of the fluoropyrazole.
The structures of only three other noncovalent inhibitors of Mtb BioA have been previously reported.23 To add further to the collection of BioA−inhibitor complexes available for comparative analysis, a complex with a compound previously reported to inhibit Mtb BioA with an IC50 of 0.44 µM following an in vitro biochemical screen19 (and here called W1; Figure 4B) has been investigated. The structure has been determined at 2.47 Å resolution (Supporting Information Table S2). Like other higher potency compounds that have been charactererized,23 W1 induces changes to the KAPA binding pocket that enable it to make extensive nonpolar stacking interactions with Trp64 and Tyr25.
DISCUSSION
DSF-Based Fragment Screening
DSF proved quite effective as a tool to identify small molecules that bind to Mtb BioA. Nearly 30% of molecules found to shift the Tm by more than ±2 °C were confirmed to bind by crystallography, and all six of these bind within the active site. There seems to be little correlation between the magnitude of the Tm shift and a positive confirmation by cocrystallization; compounds close to the threshold cutoff were just as likely to be confirmed as those that induce larger shifts, and both stabilizing and destabilizing compounds were confirmed. More stabilizing (5 of 9) than destabilizing (1 of 12) hits have been confirmed, but had destabilizing hits been ignored, F10 and the series of reversible covalent inhibitors it inspired22 would have gone unidentified.
There is also no apparent correlation between the magnitude of the Tm shift and the ITC-measured association constant. It should also be noted that small differences in ligands can produce large changes in the Tm. Only two non-hydrogen atoms separate F5, a compound that is stabilizing (ΔTm = +5 °C), and F5.1, a compound that appears destabilizing (ΔTm = −12 °C). There are no obvious differences in interactions or protein conformation to explain this difference, and F5.1 binds with higher affinity at room temperature by ITC. We cannot discount that melting point suppression by F5.1 may be occurring through some other mechanism. Eleven of 12 compounds found that sharply reduce the BioA Tm (including F5.1) incorporate a primary amine functional group. Primary amines are known to react with the PLP26, 27 and could free the cofactor from the enzyme, resulting in a Tm shifted toward that of apo BioA (67 °C).28 While no apparent reactivity with the PLP has been observed with these compounds at the low-temperature of crystallization, reactivity may be facilitated by elevated temperatures during the DSF experiment. Regardless, this example compels us to caution that the magnitude or sign of a Tm shift may not always be directly correlated to changes in binding affinity.
BioA Conformational Flexibility
Prior structural studies with BioA inhibitors have all revealed protein conformational changes that occur upon binding.20, 22, 23 Larger, more potent inhibitors such as those identified by screening,23 induce collective changes that result in a transformation of the binding site from a narrow tunnel that surrounds a largely aliphatic substrate (KAPA) into a pocket that can accommodate larger, aromatic heterocycles. Because many changes in BioA conformation occur in concert, however, it is difficult to attribute specific conformational changes to ligand molecular features that drive these changes. The fragment molecules characterized in this study bind with lower affinity, but the simpler molecules induce specific conformational changes in different combinations, revealing an ensemble of possible conformational states.
Fragment structures sample four distinct conformational “microstates” of BioA that differ in the conformation of amino acid side chains that can flip between rotamers in response to ligands. The protein backbone conformation does not change. In one state, exemplified by complexes with F5 and F10, Trp64 adopts rotamer m0 (χ1 ≈ −85°; χ2 ≈ −20°), Trp65 adopts rotamer m0 (χ1 ≈ −40°; χ2 ≈ −20°), and Phe402 adopts rotamer p90 (χ1 ≈ 70°; χ2 ≈ 80°). When in this configuration, these side chains combine to surround a narrow binding tunnel; Trp64, Trp65, and Phe402 each contribute one face of an aromatic side chain to the surface of this tunnel, and Tyr25 contributes an edge that includes the para OH. The substrate KAPA also binds to this same conformational microstate, and all three of these ligands place an amino group in the same position where it can bridge between Tyr25 OH and the PLP with multivalent H-bonding. F5 and KAPA fully occupy this binding tunnel.
F7 induces an upward shift of Trp65 to the m95 rotamer (χ1 ≈ −55°; χ2 ≈ 85°) (the shift of Trp65 must be accompanied by a concomitant shift of Met409, but Met409 does not contact ligands). As Trp65 flips up, the edge of the indole (CD1, NE1, and CE2) is repositioned along the interior of the binding pocket, affording an opportunity for F7 to H-bond to the indole NH. As Trp65 moves, space between Gly225, Ala226, and the PLP C3 OH is opened for ligands.
F2 induces a more dramatic remodeling of the active site, where Trp64 shifts to rotamer t-105 (χ1≈−150°; χ2≈−115°), and Phe402 flips to rotamer t80 (χ1≈−170°; χ2 ≈60°). The flip of Trp64 has the effect of opening the tube-shaped site into a longer cleft, where ligand molecules that can π-stack against the exposed flat face of Trp64. F2 abuts Phe402 in the t80 rotamer with a CH−π hydrogen bond that may contribute as much as −1.4 kcal/mol or more to the stabilization of binding.29, 30 Phe402 frequently acts as a boundary at one end of the cleft occupied by flat ligands like F2 that stack against Trp64.
Fragments F3 and F9 induce these same Trp64 and Trp65 changes to widen the binding site, but they also perturb Tyr25. In all fragment complexes, Tyr25 adopts the m-85 rotamer (χ1 ≈ −75°; χ2 ≈ −80°). In most of these complexes, the para OH is H-bonded to Tyr157 OH from above and to one of the two Asp160 carboxylate oxygens. This conformation is further rigidified by ligands (KAPA, F5, F10) that can make another H-bond to the para OH of Tyr25. However, Tyr25 can adopt an alternate conformation (frequently seen in complexes with covalent inhibitors),20, 22 where the para OH on the tyrosine side chain is shifted 3.5 Å or more by a combined rotation of χ1and χ2 to make H-bonds to the other Asp160 carboxylate oxygen and to Tyr157 from below. This Tyr25 shift also changes the angle of the plane of the tyrosine aromatic ring, and ligands such as F3 and F9 that can effectively stack alongside the tyrosine aromatic ring appear to stabilize the alternate conformation. F9 serves as a simple prototype for the shape of molecules that can π-stack with Trp64 above and Tyr25 below. The indenone of F9 is nearly perfectly stacked against the indole of Trp64 in the t-105 conformation. A ~45° twist about the F9 rotatable bond positions the planar amide to stack alongside the Tyr25 aromatic ring.
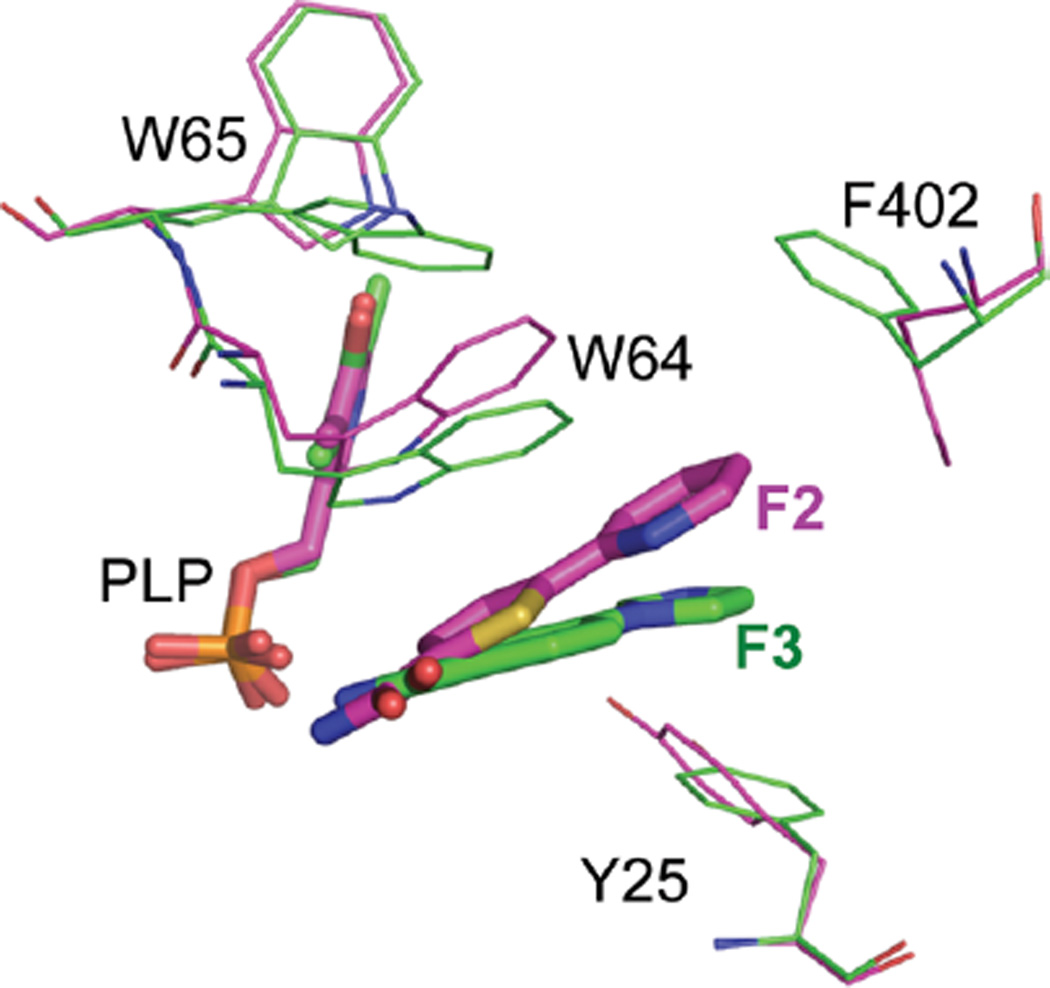
It should be noted that rotamer conformations are not rigid but may undergo more subtle adaptations, even in response to very similar ligands. A comparison of F2 and F3 provides an example. F2 and F3 coincide at the inside edge but diverge at a relative angle of ~25° at the outside (Figure 5) so that F3 can stack against Tyr25, while F2 does not. Trp64 is sufficiently flexible to track with this difference to maintain good π stacking; even in the context of a single conformational microstate, the BioA active site appears to be quite capable of adaptation to facilitate inhibitor binding.
Figure 5.
Comparison of F2 and F3 complexes. F2 is magenta; F3 is green. In the F3 complex, Trp64 drops to maintain coplanar stacking with the six-membered ring, and Tyr25 is nearly coplanar to the imidazole.
Generalized Inhibitor Scaffolds
The flexibility of the BioA binding site clearly needs to be taken into account during the optimization of any lead inhibitors. It is prudent to target a specific receptor conformation during inhibitor optimization in order to avoid sharp discontinuities in SAR that would accompany unexpected conformational change, but the relatively flat thermodynamics reflected in fragment binding cannot recommend one conformation as a preferred target over another. Two observed conformations appear to serve as bookends to the full range of accessible conformations: the tightly wrapped state to which KAPA, F5, and F10 bind, and the broad more open binding cleft represented in the complex with F3 and F9. Recurring features in the available structures provide the basis for a sketch of broadly outlined molecular scaffolds consistent with these protein conformational states.
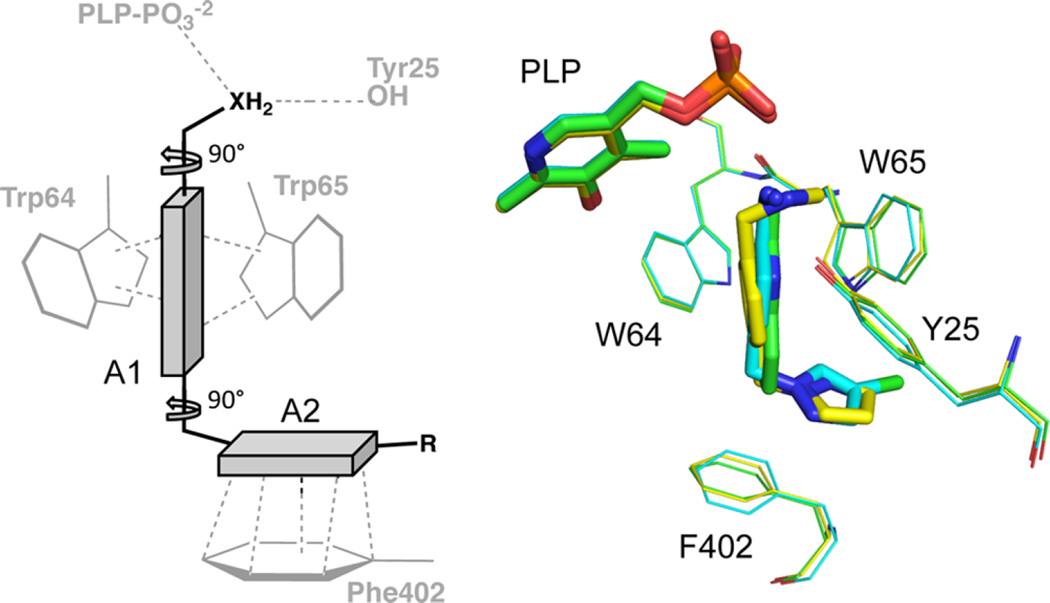
The first scaffold can be defined minimally as an aromatic ring joined to another aromatic ring by a methylene linker with a multivalent H-bond donor at one end (Figure 6). This pharmacophore is exemplified by fragment F5 and analogue F5.1, and it capitalizes on many of the interaction features that afford the F5 series with strong enthalpy of binding and F10 with very high ligand efficiency. The H-bond donor is needed to interact with Tyr-25 and/or Tyr157, and one six-membered ring can bind inserted into the hydrophobic niche formed between the m0 rotamer of Trp 64 and the m0 rotamer of Trp65. The other aromatic ring can stack effectively against Phe402 in the p90 rotamer. Molecules that conform to this pharmacophore should be optimized to the KAPA-bound protein conformation, best captured in the high-resolution structure of the F5 complex (PDB ID 4wyd). Opportunities for further optimization of such a scaffold may be limited, however, by the narrow confines of the binding site in this state, which is nearly completely filled by F5.1. The narrow exit from the binding tunnel extends from C4 of the pyrazole of F5.
Figure 6.
Generalized inhibitor scaffold 1. The chemotype consisting of two planar chemical moieties (A1 and A2) joined by a methylene with an H-bond donor emanating from A1. A2 is positioned to stack beside Phe402. Preferred torsional geometry is shown. Structures shown include F5 (yellow), F5.1 (cyan), and F10 (green).
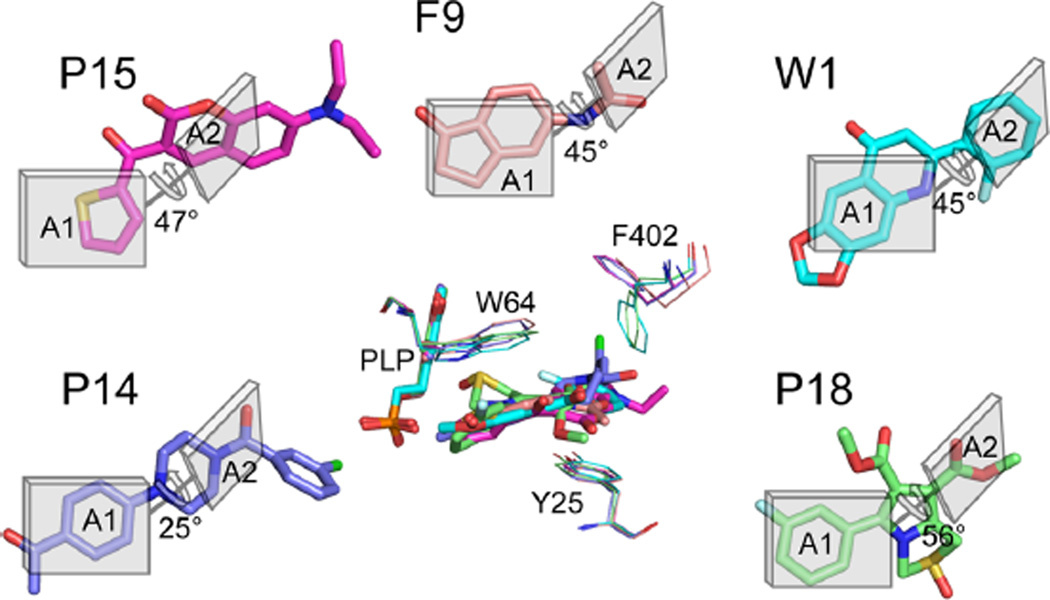
A second conceptual scaffold is inspired by the complex with fragment F9, which appears to be stabilized only by stacking interactions with the aromatic faces of Trp64 and Tyr25 in the more open conformational states. In its most generalized representation, a suitable pharmacophore will embed two planar or aromatic groups with a twist between them (Figure 7). One of these groups (A1) stacks beneath Trp64 in the t-105 rotamer, while a second aromatic group (A2) lays upon the Tyr25 aromatic ring. This most open binding site configuration is induced by fragments F3 and F9 only, but it is also the predominant configuration of the binding site observed in complexes with more potent inhibitors that have been reported by Park et al.23 (These compounds are here identified as P14− Cl, P15, and P18; See Supporting Information Figure S5 for chemical structures). It is also here revealed to be the conformation to which W1 is bound. With the recognition of this generic pharmacophore in F9, it can also now be perceived to exist in every other Mtb BioA inhibitor that induces this most open conformational configuration (Figure 7), although the chemical manifestation of the pharmacophore can be quite diverse.
Figure 7.
Generalized inhibitor scaffold 2. The chemotype consisting of two planar chemical moieties (A1 and A2) joined by a linker conferring a ~45° twist permit packing against Trp64 (above) and Tyr25 (below), inducing the most open configuration of the binding site. Structures exist where A1 is one (P15; magenta), two (F9; orange), or three (W1; cyan) heterocycles, and the linker (L) is one (W1, F9) or two (P15) bonds in length. In more diverse manifestations of the pharmacophore-(P18, green; P14, blue), complex heterocycles effect a more variable angle between planar groups.
In known inhibitors, the A1 component can consist of three (W1), two (F9), or just one (P15) fused heterocycles. A2 may be as small as an acetyl group (F9) or as large as coumarin (P15). Linkers may be one (F9, W1) or two (P15) rotatable bonds. In more complex instances, the twist between planar elements is accomplished with an embedded heterocycle. In the case of P18, the central pyrrole represents A1, and one of the methyl esters is A2. In P14-Cl, a piperazine provides the twist between the acetobenzyl group (A1) and planar amide (A2). The twist tolerated in these complexes can deviate from the apparent ideal of ~45° because of the flexibility of Trp64 and Tyr25 already noted. Opportunities for further development from this scaffold abound, in part because molecules can extend outward past Phe402 and into the gap between BioA monomers. Designs should target either the conformation of the P15 complex (PDB ID 4w1w) or the conformation of P18 (PDB ID 4w1v), which differ mostly in the conformation of Phe402.
CONCLUSIONS
Fragment library biophysical screening using DSF and crystallography has been used to identify small molecules that bind in the active site of Mtb BioA. A calorimetric determination of the binding affinity confirms that six molecules bind with high ligand efficiency. Significant enthalpy of binding stabilizes all of these complexes (ΔH < 0), although most also benefit from some entropic stabilization (−TΔS < 0 at room temperature). The binding of only one compound (F5) is purely enthalpy driven, but the preferred stabilization by specific interactions makes this an attractive starting point for future optimization. One compound (F2) can inhibit the growth of virulent Mtb strains in a biotin-deprived media, confirming inhibition of essential biotin biosynthesis in whole cells.
Structural analysis of the complexes with these fragments reveals the dynamic nature of the BioA active site. Different side chain conformational states are stabilized in response to binding by different molecules; in the conduct of future structure-driven design around these structures, care should be taken to specifically target conformational states that are compatible with the corresponding chemical scaffolds and with an awareness that small changes in ligand can induce further side chain movement.
Two molecular scaffolds are suggested that incorporate recurrent molecular features, help to explain the origins of potency in existing inhibitors, and might prove helpful in the design of new molecules. These scaffolds target either a tightly closed enzyme conformation observed in the binding of substrates or a more open state receptive to larger, conjugated inhibitors. By being mindful of both the conformational diversity of the binding site and the principle ligand interactions that lead to conformational change, it should be possible to effectively employ new structural data as part of a scaffold hopping strategy to further optimize existing inhibitors or create new ones with improved therapeutic potential.
EXPERIMENTAL METHODS
Compound Sources
Compound F5.1 was acquired from Chembridge (hit2lead.com). W1 was obtained from Sigma. Purity of all purchased compounds (>95%) was confirmed by LC-MS.
BioA Protein Expression and Purification
N-Terminally His-tagged BioA was overexpressed in Escherichia coli and purified using Ni-affinity and size exclusion chromatography as thoroughly described elsewhere.28 Full saturation by the PLP cofactor was ensured by adding 1 mM PLP to pooled protein as eluted from the SEC column and confirmed using differential scanning fluorimetry as previously described.28
Fragment Library
The Maybridge Ro3 1000 Diversity library was acquired from Thermo Fisher Scientific in 2010. Most of the 1000 compounds in this library comply with the “rule-of-three”; each compound has MW ≤ 300 D, cLogP ≤ 3, and 3 or fewer H-bond acceptors, donors, and rotatable bonds. Compound solids were dissolved in 100% DMSO to a final fragment concentration of 200 mM and stored at −20 °C.
Fragment Screening by DSF
Screening was conducted in white Bio-Rad PCR plates (Thermo Fischer Scientific). Each well contained 40 µL of solution consisting of BioA (0.05 mg/mL), 25 mM HEPES (pH 7.5), 50 mM NaCl, 5× SYPRO Orange (Life Sciences), and 5 mM final fragment compound diluted from 200 mM DMSO stock. The first and last column of each row served as DMSO-only controls. Plates were sealed, and the fluorescence response was measured using a Bio-Rad CFX96 real-time C1000 thermo cycler across a temperature range from 55 to 100 °C using one-degree steps and 30 s dwell times as recommended in established protocols.32 Calculations were performed using the Bio-Rad CFX Manager software, with the Tm determined by the peak of the first derivative of the fluorescence curve. Melting curve plots were generated using R (http://www.R-project.org).
To obtain more precise thermal shifts for cocrystallized compounds (Table 1), melting curves were reproduced in quadruplicate as described above, only using 60 s dwell time at each 0.5 °C step. Transition points from each curve were compared to the mean of DMSO-only controls on the same plate (also in quadruplicate). Mean values are tabulated with standard errors computed from four replicates. When an identical Tm was measured in each replicate, a standard error is assigned an upper limit of 0.2 °C.
Isothermal Titration Calorimetry (ITC)
ITC was conducted on a MicroCal Auto-iTC200 microcalorimeter (Malvern Instruments Ltd., UK) with a cell volume of 200 µL and a syringe volume of 40 µL. All experiments were performed at 25 °C in ITC buffer (25 mM HEPES [pH 7.5], and 50 mM NaCl). BioA was exchanged into this buffer using an Amicon Ultra concentrator, and the final enzyme concentration was determined using a NanoDrop instrument with the calculated extinction coefficient ε280. The protein concentration was optimized beginning with 10 µM previously used to evaluate high-affinity screening hits,23 and gradually increased to achieve better signal-to-noise with lower potency fragment hits. A final concentration of 100 µM BioA was selected. Ligand solutions were prepared by diluting 200 mM DMSO stock to the buffer. Each ligand was evaluated a 1.0 mM, 1.5 mM, and 2.0 mM concentrations. DMSO was added to the corresponding BioA protein solution so the ligand solution and the protein solution used for titration have the same DMSO concentration. All titrations were performed with stirring speed of 750 rpm and a 150 s interval between 2 µL injections. The initial injection was not used for data fitting. Titrations were run past the point of enzyme saturation to determine and correct for heats of dilution. Data were fit to a theoretical titration curve using the Origin software package (version 7.0) provided with the instrument to obtain KA (the association constant in M−1), n (the number of binding sites per monomer), and ΔH (enthalpy) of binding. The thermodynamic parameters (ΔG and −TΔS) are calculated using eq 1:
| (1) |
where ΔG, ΔH, and ΔS are the changes in free energy, enthalpy, and entropy of binding, respectively, R = 1.98 cal mol−1 K−1, and T is the absolute temperature. The affinity of the fragments for BioA is provided as the dissociation constant (KD = 1/KA). Average thermodynamic parameters and standard errors (Table 2) were computed from all three replicates.
Crystallography
BioA holo crystals used in soaking experiments with potential ligands were obtained as described in detail by Dai et al.22 Hanging drops composed of 2 µL of protein solution containing 10 mg/mL BioA in 100 mM HEPES (pH 7.5), 50 mM NaCl, 0.1 mM TCEP, 1.5 µL of reservoir solution containing 9−14% PEG 8000, 100 mM HEPES (pH 7.5), 100 mM MgCl2, and 0.5 µL of a seed solution (a reservoir solution containing crushed BioA crystals) were suspended over 1mL of reservoir solution and sealed. Crystals appeared in the drop within 24 h and grew to their full size in 72 h. Crystals of complexes with small molecules were obtained using either soaking (F2, F3, F5, F7) or cocrystallization (F9, F5.1, W1) methods. By soaking, preformed holo crystals were transferred into a modified reservoir solution to which compound from DMSO stocks was added to achieve a final compound concentration of 5 mM. Crystals were soaked for 5−60 min at 20 °C before harvesting. By cocrystallization, small molecule (5 mM) was added to each reservoir solution prior to assembling the components of hanging drops. Holo BioA crystallization conditions provided seeds. All crystals harvested for diffractometry were briefly transferred into a solution (15% PEG400, 15% PEG 8000, 100 mM HEPES pH 7.5, 100 mM MgCl2, and 5 mM compound) using an appropriately sized fiber loop of a cryo pin from Hampton Research before being flash vitrified in liquid nitrogen.
Diffraction data for complexes with fragments F3, F5, F7, F9, and F5.1 were collected from crystals at 100 K using synchrotron radiation at beamline 17-ID (IMCA-CAT) of the Advanced Photon Source (Argonne, IL, U.S.A.) equipped with a Dectris Pilatus 6 M pixel detector. These data were processed, integrated, and scaled with XDS33 and SCALA34 using auto PROC scripts available at IMCA-CAT. Diffraction data for the F2 and W1 complexes were taken on an in-house Rigaku High Flux MicroMax-007 rotating anode using a Saturn 944+ CCD detector. These data were integrated and scaled with d*TREK.35 The structures were solved by molecular replacement using Phaser36 in the CCP4 package37 using atomic coordinates of the dimer from PDB code 3TFT as a search model.20 Refinement and model building was done using REFMAC538 and Coot.39 The figures were prepared with PyMOL (The PyMOL Molecular Graphics System, version 1.5.0.4; Schrödinger, LLC). Structures were superimposed for analysis and displayed using the shared BioA-PLP overlay method of the DrugSite server.40
Atomic coordinates and diffraction data have been deposited in the Protein Data Bank41 with accession codes 4wya, 4wyc, 4wyd, 4wye, 4wyf, 4wyg, and 4xew as identified in Supporting Information Table S2.
Whole Cell Growth Assay
Whole-cell growth assays to assess potential inhibition of cell growth were performed as previously described.23 Mtb WT and Mtb BioA-UE strains were grown in Sauton’s medium containing 1000 nM biotin to an OD580 nm of 1.0−1.2, harvested by centrifugation, washed twice with biotin-free Sauton’s medium, and diluted in 96-well plates with a starting OD580 nm of 0.03. The compounds were added to give final concentrations of 1000 to 3.9 µM using 2-fold serial dilutions. Compound W1 was employed as a positive control in these experiments.23 Wells containing no compound were used as controls. Then 1000 nM biotin was used for biotin-supplemented media and 200 ng/mL of anhydrotetracycline were added to a Mtb BioA-UE strain to express the desired level of BioA. Plates were incubated at 37 °C, and optical density was measured after nine days. All growth assays were performed in triplicate. MIC values were calculated by Prism (version 5.01).
Supplementary Material
ACKNOWLEDGMENTS
This work was funded in part by grants from the National Institutes of Health (R01AI091790 to D.S.). Isothermal titration calorimetry was carried out using an ITC-200 microcalorimeter, funded in part by the NIH Shared Instrumentation Grant S10-OD017982. We also gratefully acknowledge support from the University of Minnesota Bighley Graduate fellowship (to R.D.) and resources from the University of Minnesota Supercomputing Institute. Use of the IMCA-CAT beamline 17-ID at the Advanced Photon Source was supported by the companies of the Industrial Macromolecular Crystallography Association through a contract with Hauptman−Woodward Medical Research Institute.
ABBREVIATIONS USED
- DAPA
7,8-diaminopelargonic acid
- DSF
differential scanning fluorimetry
- KAPA
7-keto-8-aminopelargonic acid
- ITC
isothermal titration calorimetry
- Mtb
Mycobacterium tuberculosis
- PLP
pyridoxal 5′-phosphate
- SAM
S-adenosylmethionine
- TB
tuberculosis
- WT
wild-type
Footnotes
ASSOCIATED CONTENT
Supporting Information
Supplemental experimental data including a complete list of compounds producing Tm shifts, DSF melting curves, crystallographic diffraction and refinement parameters, ITC injection curves, whole-cell assay results, and a table of inhibitor structures referenced in the discussion (PDF, CSV). The Supporting Information is available free of charge on the ACS Publications website at DOI: 10.1021/acs.jmedchem.5b00092.
Accession Codes
PDB ID codes: 4wya, 4wyc, 4wyd, 4wye, 4wyf, 4wyg, and 4xew
The authors declare no competing financial interest.
REFERENCES
- 1.Dye C, Williams BG. The population dynamics and control of tuberculosis. Science. 2010;328:856–861. doi: 10.1126/science.1185449. [DOI] [PubMed] [Google Scholar]
- 2.Global Tuberculosis Report 2014. Geneva: World Health Organization; 2014. [Google Scholar]
- 3.Mitchison DA. Role of individual drugs in the chemotherapy of tuberculosis. Int. J. Tubercosis Lung Dis. 2000;4:796–806. [PubMed] [Google Scholar]
- 4.Mitchison DA. The action of antituberculosis drugs in short-course chemotherapy. Tubercle. 1985;66:219–225. doi: 10.1016/0041-3879(85)90040-6. [DOI] [PubMed] [Google Scholar]
- 5.Barry CE, III, Boshoff HI, Dartois V, Dick T, Ehrt S, Flynn J, Schnappinger D, Wilkinson RJ, Young D. The spectrum of latent tuberculosis: rethinking the biology and intervention strategies. Nature Rev. Microbiol. 2009;7:845–855. doi: 10.1038/nrmicro2236. [DOI] [PMC free article] [PubMed] [Google Scholar]
- 6.Günther G. Multidrug-resistant and extensively drug-resistant tuberculosis: a review of current concepts and future challenges. Clin. Med. 2014;14:279–285. doi: 10.7861/clinmedicine.14-3-279. [DOI] [PMC free article] [PubMed] [Google Scholar]
- 7.Dartois V, Barry CE., III A medicinal chemists’ guide to the unique difficulties of lead optimization for tuberculosis. Bioorg. Med. Chem. Lett. 2013;23:4741–4750. doi: 10.1016/j.bmcl.2013.07.006. [DOI] [PMC free article] [PubMed] [Google Scholar]
- 8.Knowles JR. The mechanism of biotin-dependent enzymes. Annu. Rev. Biochem. 1989;58:195–221. doi: 10.1146/annurev.bi.58.070189.001211. [DOI] [PubMed] [Google Scholar]
- 9.Hayakawa K, Oizumi J. Determination of free biotin in plasma by liquid chromatography with fluorimetric detection. J. Chromatogr. 1987;413:247–250. doi: 10.1016/0378-4347(87)80234-7. [DOI] [PubMed] [Google Scholar]
- 10.Sassetti CM, Rubin EJ. Genetic requirements for mycobacterial survival during infection. Proc. Natl. Acad. Sci. U. S. A. 2003;100:12989–12994. doi: 10.1073/pnas.2134250100. [DOI] [PMC free article] [PubMed] [Google Scholar]
- 11.Salaemae W, Azhar A, Booker GW, Polyak SW. Biotin biosynthesis in Mycobacterium tuberculosis: physiology, biochemistry and molecular intervention. Protein Cell. 2011;2:691–695. doi: 10.1007/s13238-011-1100-8. [DOI] [PMC free article] [PubMed] [Google Scholar]
- 12.Mann S, Ploux O. 7,8-Diaminoperlargonic acid aminotransferase from Mycobacterium tuberculosis, a potential therapeutic target. Characterization and inhibition studies. FEBS J. 2006;273:4778–4789. doi: 10.1111/j.1742-4658.2006.05479.x. [DOI] [PubMed] [Google Scholar]
- 13.Okami Y, Kitahara T, Hamada M, Naganawa H, Kondo S. Studies on a new amino acid antibiotic, amiclenomycin. J. Antibiot. 1974;27:656–664. doi: 10.7164/antibiotics.27.656. [DOI] [PubMed] [Google Scholar]
- 14.Kitahara T, Hotta K, Yoshida M, Okami Y. Biological studies of amiclenomycin. J. Antibiot. 1975;28:215–221. doi: 10.7164/antibiotics.28.215. [DOI] [PubMed] [Google Scholar]
- 15.Hotta K, Kitahara T, Okami Y. Studies of the mode of action of amiclenomycin. J. Antibiot. 1975;28:222–228. doi: 10.7164/antibiotics.28.222. [DOI] [PubMed] [Google Scholar]
- 16.Sandmark J, Mann S, Marquet A, Schneider G. Structural basis for the inhibition of the biosynthesis of biotin by the antibiotic amiclenomycin. J. Biol. Chem. 2002;277:43352–43358. doi: 10.1074/jbc.M207239200. [DOI] [PubMed] [Google Scholar]
- 17.Park SW, Klotzsche M, Wilson DJ, Boshoff HI, Eoh H, Manjunatha U, Blumenthal A, Rhee K, Barry CE, Aldrich CC, Ehrt S, Schnappinger D. Evaluating the sensitivity of Mycobacterium tuberculosis to biotin deprivation using regulated gene expression. PLoS Pathog. 2011;7:e1002264. doi: 10.1371/journal.ppat.1002264. [DOI] [PMC free article] [PubMed] [Google Scholar]
- 18.Dey S, Lane JM, Lee RE, Rubin EJ, Sacchettini JC. Structural characterization of the Mycobacterium tuberculosis biotin biosynthesis enzymes 7,8-diaminopelargonic acid synthase and dethiobiotin synthetase. Biochemistry. 2010;49:6746–6760. doi: 10.1021/bi902097j. [DOI] [PMC free article] [PubMed] [Google Scholar]
- 19.Wilson DJ, Shi C, Duckworth BP, Muretta JM, Manjunatha U, Sham YY, Thomas DD, Aldrich CC. A continuous fluorescence displacement assay for BioA: an enzyme involved in biotin biosynthesis. Anal. Biochem. 2011;416:27–38. doi: 10.1016/j.ab.2011.05.003. [DOI] [PMC free article] [PubMed] [Google Scholar]
- 20.Shi C, Geders TW, Park SW, Wilson DJ, Boshoff HI, Abayomi O, Barry CE, 3rd, Schnappinger D, Finzel BC, Aldrich CC. Mechanism-Based Inactivation by Aromatization of the Transaminase BioA Involved in Biotin Biosynthesis in Mycobacterium tuberculosis. J. Am. Chem. Soc. 2011;133:18194–18201. doi: 10.1021/ja204036t. [DOI] [PMC free article] [PubMed] [Google Scholar]
- 21.Zlitni S, Ferruccio LF, Brown ED. Metabolic suppression identifies new antibacterial inhibitors under nutrient limitation. Nature Chem. Biol. 2013;9:796–804. doi: 10.1038/nchembio.1361. [DOI] [PMC free article] [PubMed] [Google Scholar]
- 22.Dai R, Wilson DJ, Geders TW, Aldrich CC, Finzel BC. Inhibition of Mycobacterium tuberculosis transaminase BioA by aryl hydrazines and hydrazides. ChemBioChem. 2014;15:575–586. doi: 10.1002/cbic.201300748. [DOI] [PMC free article] [PubMed] [Google Scholar]
- 23.Park SW, Casalena DE, Wilson DJ, Dai R, Nag PP, Liu F, Boyce JP, Bittker JA, Schreiber SL, Finzel BC, Schnappinger D, Aldrich CC. Target-Based Identification of Whole-Cell Active Inhibitors of Biotin Biosynthesis in Mycobacterium tuberculosis. Chem. Biol. 2015;22:76–86. doi: 10.1016/j.chembiol.2014.11.012. [DOI] [PMC free article] [PubMed] [Google Scholar]
- 24.Erlanson DA. Introduction to fragment-based drug discovery. Top Curr. Chem. 2012;317:1–32. doi: 10.1007/128_2011_180. [DOI] [PubMed] [Google Scholar]
- 25.Ferenczy GG, Keserű GM. Thermodynamics of Fragment Binding. J. Chem. Inf. Model. 2012;52:1039–1045. doi: 10.1021/ci200608b. [DOI] [PubMed] [Google Scholar]
- 26.Matsuo Y. Pyridoxal Catalysis of Non-enzymatic Transamination in Ethanol Solution1. J. Am. Chem. Soc. 1957;79:2016–2019. [Google Scholar]
- 27.Mitra J, Metzler D. Schiff bases of pyridoxal 5′-phosphate with Tris and glycine. Biochim. Biophys. Acta, Gen. Subj. 1988;965:93–96. [Google Scholar]
- 28.Geders TW, Gustafson K, Finzel BC. Use of differential scanning fluorimetry to optimize the purification and crystallization of PLP-dependent enzymes. Acta Crystallographr, Sect. F: Struct. Biol. Cryst. Commun. 2012;68:596–600. doi: 10.1107/S1744309112012912. [DOI] [PMC free article] [PubMed] [Google Scholar]
- 29.Lovell SC, Word JM, Richardson JS, Richardson DC. The penultimate rotamer library. Proteins. 2000;40:389–408. [PubMed] [Google Scholar]
- 30.Williams MA, Ladbury JE. In: Protein-Ligand Interactions: From Molecular Recognition to Drug Design. Bohm H-J, Schneider G, editors. Weinheim, Germany: Wiley-VCH; 2003. pp. 137–161. [Google Scholar]
- 31.Laskowski RA, Swindells MB. LigPlot+: multiple ligand– protein interaction diagrams for drug discovery. J. Chem. Inf. Model. 2011;51:2778–2786. doi: 10.1021/ci200227u. [DOI] [PubMed] [Google Scholar]
- 32.Niesen FH, Berglund H, Vedadi M. The use of differential scanning fluorimetry to detect ligand interactions that promote protein stability. Nature Protoc. 2007;2:2212–2221. doi: 10.1038/nprot.2007.321. [DOI] [PubMed] [Google Scholar]
- 33.Kabsch W. XDS. Acta Crystallogr, Sect. D: Biol. Crystallogr. 2010;66:125–132. doi: 10.1107/S0907444909047337. [DOI] [PMC free article] [PubMed] [Google Scholar]
- 34.Evans P. Scaling and assessment of data quality. Acta Crystallogr., Sect. D: Biol. Crystallogr. 2006;62:72–82. doi: 10.1107/S0907444905036693. [DOI] [PubMed] [Google Scholar]
- 35.Pflugrath JW. The finer things in X-ray diffraction data collection. Acta Crystallogr., Sect. D: Biol. Crystallogr. 1999;55:1718–1725. doi: 10.1107/s090744499900935x. [DOI] [PubMed] [Google Scholar]
- 36.McCoy AJ, Grosse-Kunstleve RW, Adams PD, Winn MD, Storoni LC, Read RJ. Phaser crystallographic software. J. Appl. Crystallogr. 2007;40:658–674. doi: 10.1107/S0021889807021206. [DOI] [PMC free article] [PubMed] [Google Scholar]
- 37.Winn MD, Ballard CC, Cowtan KD, Dodson EJ, Emsley P, Evans PR, Keegan RM, Krissinel EB, Leslie AGW, McCoy A, McNicholas SJ, Murshudov GN, Pannu NS, Potterton EA, Powell HR, Read RJ, Vagin A, Wilson KS. Overview of the CCP4 suite and current developments. Acta. Crystallogr., Sect. D: Biol. Crystallogr. 2011;67:235–242. doi: 10.1107/S0907444910045749. [DOI] [PMC free article] [PubMed] [Google Scholar]
- 38.Murshudov GN, Skubák P, Lebedev AA, Pannu NS, Steiner RA, Nicholls RA, Winn MD, Long F, Vagin AA. REFMAC5 for the refinement of macromolecular crystal structures. Acta Crystallogr., Sect. D: Biol. Crystallogr. 2011;67:355–367. doi: 10.1107/S0907444911001314. [DOI] [PMC free article] [PubMed] [Google Scholar]
- 39.Emsley P, Cowtan K. Coot: model-building tools for molecular graphics. Acta Crystallogr., Sect. D: Biol. Crystallogr. 2004;60:2126–2132. doi: 10.1107/S0907444904019158. [DOI] [PubMed] [Google Scholar]
- 40.Finzel BC, Akavaram R, Ragipindi A, Van Voorst JR, Cahn M, Davis ME, Pokross ME, Sheriff S, Baldwin ET. Conserved core substructures in the overlay of protein-ligand complexes. J. Chem. Inf. Model. 2011;51:1931–1941. doi: 10.1021/ci100475y. [DOI] [PubMed] [Google Scholar]
- 41.Berman HM, Westbrook J, Feng Z, Gilliland G, Bhat TN, Weissig H, Shindyalov IN, Bourne PE. The Protein Data Bank. Nucleic Acids Res. 2000;28:235–242. doi: 10.1093/nar/28.1.235. [DOI] [PMC free article] [PubMed] [Google Scholar]
Associated Data
This section collects any data citations, data availability statements, or supplementary materials included in this article.


