

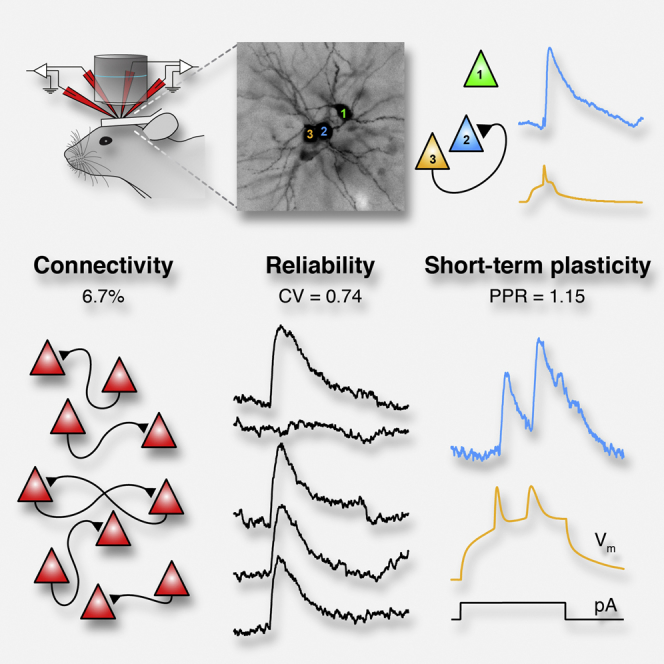
Summary
Little is known about the properties of monosynaptic connections between identified neurons in vivo. We made multiple (two to four) two-photon targeted whole-cell recordings from neighboring layer 2 mouse somatosensory barrel cortex pyramidal neurons in vivo to investigate excitatory monosynaptic transmission in the hyperpolarized downstate. We report that pyramidal neurons form a sparsely connected (6.7% connectivity) network with an overrepresentation of bidirectional connections. The majority of unitary excitatory postsynaptic potentials were small in amplitude (<0.5 mV), with a small minority >1 mV. The coefficient of variation (CV = 0.74) could largely be explained by the presence of synaptic failures (22%). Both the CV and failure rates were reduced with increasing amplitude. The mean paired-pulse ratio was 1.15 and positively correlated with the CV. Our approach will help bridge the gap between connectivity and function and allow investigations into the impact of brain state on monosynaptic transmission and integration.
Graphical Abstract
Highlights
-
•
Targeted whole-cell recordings from monosynaptically connected neurons in vivo
-
•
Sparse but non-random connectivity between layer 2 pyramidal neurons in vivo
-
•
Reduced failure rate and trial-by-trial reliability with increasing uEPSP amplitude
-
•
Weak short-term synaptic plasticity
Jouhanneau et al. use multiple in vivo two-photon targeted whole-cell recordings to measure the rates of connectivity, amplitude, kinetics, reliability, and short-term plasticity of monosynaptic excitatory connections between layer 2 cortical pyramidal neurons.
Introduction
Local excitatory synaptic connections between cortical pyramidal neurons are critical for sensory perception, cognition, and memory and form the backbone of massive-scale modeling and mapping efforts of the mammalian brain. Fundamental properties of monosynaptic excitatory glutamatergic transmission have been well characterized in cortical slice studies (Feldmeyer et al., 2006, Holmgren et al., 2003, Lefort et al., 2009, Markram et al., 1997, Silver et al., 2003, Song et al., 2005, Thomson and Lamy, 2007). In vitro work has demonstrated that monosynaptic connections between neighboring pyramidal neurons are typically small in amplitude, are highly reliable with little synaptic failure, and show short-term depression. The probability of finding a connection between two neighboring pyramidal neurons is low, about 10% in somatosensory cortex (Holmgren et al., 2003, Lefort et al., 2009, Markram et al., 1997) and 10%–20% in visual cortex (Cossell et al., 2015, Ko et al., 2011, Song et al., 2005, Yoshimura et al., 2005), and previous studies have identified non-random patterns of connectivity between pyramidal neurons in some cortical regions (Cossell et al., 2015, Ko et al., 2011, Markram et al., 1997, Perin et al., 2011, Song et al., 2005). However, because of axonal slicing and dendritic spine growth (Kirov et al., 1999), as well as differences in firing rates, extracellular calcium (Borst, 2010), and neuromodulator concentrations in brain slices, it is unclear whether these features of cortical excitatory monosynaptic connections are also found in vivo.
Little is known about properties of cortical synaptic transmission in vivo, in part because of the technical difficulty of performing membrane potential (Vm) recordings from multiple, neighboring neurons. Cortical slice work has shown that the probability of identifying a connected pair of pyramidal neurons is higher if the cells’ somata are within ∼200 μm of each other (Holmgren et al., 2003, Perin et al., 2011). Thus, to identify a connection without prior knowledge of which cells are connected, recordings should ideally be targeted to nearby cell somata. Previous in vivo studies of synaptic connectivity, however, have used blind recording methods including: dual extracellular recordings (Fujisawa et al., 2008, Reid and Alonso, 1995, Swadlow and Gusev, 2002), a combination of extracellular and intracellular recordings (Bruno and Sakmann, 2006, London et al., 2010, Matsumura et al., 1996, Yu and Ferster, 2013), or sharp microelectrode recordings (Crochet et al., 2005). More recently, optogenetics with targeted whole-cell recordings was used to identify excitatory connections to cortical GABAergic interneurons (Pala and Petersen, 2015).
Here, we used in vivo two-photon targeted whole-cell recordings from two to four neighboring, layer 2 (L2) pyramidal neurons in primary somatosensory cortex of anesthetized mice. Our approach allowed us to test for unidirectional and bidirectional connections and examine fundamental properties of unitary excitatory connections between pyramidal neurons.
Results
In Vivo Two-Photon Targeted Whole-Cell Recordings from Monosynaptically Connected L2 Excitatory Pyramidal Neurons
We made 185 dual, 84 triple, and 2 quadruple Vm recordings from 630 neighboring (horizontal distance between soma centers, 41.01 ± 0.74 μm; n = 878 tested connections) pyramidal neurons in the primary somatosensory whisker cortex (S1) of urethane anesthetized mice (age, postnatal day 22 ± 0.2 days; n = 188 mice) (Figure 1A). All recordings were targeted to L2 pyramidal neurons within the first dense layer of pyramidal neurons below the pial surface (mean depth, −177.13 ± 0.89 μm; range, −111.41 to −256.77 μm). The lower border of L2 in mouse barrel cortex is ∼269 μm (Lefort et al., 2009).
Figure 1.

In Vivo Monosynaptic Connectivity between L2 Primary Somatosensory Cortex Excitatory Pyramidal Neurons
(A) Cartoon schematic illustrating the experimental setup with the position of four recording pipettes.
(B) In vivo two-photon z stack after a simultaneous whole-cell recording from three L2 pyramidal neurons filled with Alexa Fluor 594.
(C) Anatomical reconstruction of the biocytin fill of the same three neurons as in (B), with barrels row labeled; color corresponds to cell numbers in (B). Lighter cell shading indicates the axon.
(D) Example averaged downstate synaptic connection from cell 3 to cell 2 in (B).
(E) A triple whole-cell recording showing the 0.5-Hz stimulation paradigm used to test for a synaptic connection.
(F) Averaging the postsynaptic responses to single APs in downstates from the recordings in (E) revealed a bidirectionally connected pair of neurons.
(G) Cartoon schematic and pie chart showing the proportion of tested connections that were unconnected (gray) or part of a unidirectionally connected (orange) or bidirectionally connected (green) pair. See also Experimental Procedures for n number description.
(H) Histogram of the numbers of unconnected, unidirectional, and bidirectional connections found as a function of the somatic distance; color coding in the inset is the same as in (G). Red line shows linear regression between connection probability and somatic distance with no significant relationship.
(I) Same as in (H) for depth of recording.
See also Figure S1.
L2 pyramidal neurons were visually targeted either by fluorescent genetic labeling or by shadowpatching (Kitamura et al., 2008), where cell somata appeared as dark shadows against the extracellular space filled with a fluorescent dye (Figure S1). All neurons recorded in wild-type mice showed a regular spiking firing pattern. Furthermore, 71% (150/212) of wild-type neurons were identified as pyramidal neurons by in vivo visualization of dendritic spines and/or post hoc biocytin staining (Figures 1B and 1C).
To identify a synaptic connection, we injected 10 to 20 ms depolarizing current steps into each cell to trigger single action potentials (APs) at 0.5 or 1 Hz (Figures 1D and 1E). Under urethane anesthesia, cortical neurons oscillate between epochs of depolarized, synaptically active upstates and hyperpolarized downstates with low levels of excitatory input (Steriade et al., 1993) that are thought to resemble the quiescent synaptic activity in cortical slices. We restricted our analysis to downstates and averaged the postsynaptic responses triggered by single APs. Across our entire dataset, 59 unitary excitatory postsynaptic potentials (uEPSPs) were identified from 878 tested connections, giving an overall connectivity probability of 6.7%, a significantly lower rate than reported by a previous in vitro study of L2 pyramidal neurons in mouse barrel cortex (9.3%, 88 connections/950 tested, p < 0.01; Lefort et al., 2009). Notably, 14 of the 59 identified connections were part of a bidirectionally connected pair of cells, a proportion higher than expected from a randomly connected network (seven identified bidirectional pairs, 6.7% × 6.7% × 858 = 3.85 expected bidirectional pairs, p < 0.005, see also Experimental Procedures) (Figures 1F and 1G). There was no correlation between the probability of identifying a connection and the distance between the cell somata in pairs 10–80 μm apart (n = 878 connections, p = 0.542; Figure 1H). Likewise, there was no significant correlation between connectivity rate and depth of recording between 100 and 230 μm from the pial surface (n = 878 connections, p = 0.084; Figure 1I).
Kinetics and Amplitude of uEPSPs
The strength and time course of subthreshold inputs are fundamental to synaptic integration. Therefore, we next determined the kinetics and amplitude of the averaged downstate uEPSPs (Figures 2A and 2B; Table S1; n = 59). The mean latency was 1.47 ± 0.14 ms (Figure 2C). Two connections, however, exhibited a latency >4 ms (Figure S2), which may result from a disynaptic input, as observed between L4 pairs in rats (Feldmeyer et al., 1999) and between L2/3 human cortical neurons (Molnár et al., 2008), or from a very distal synaptic contact. The population uEPSP had a rise time of 1.97 ± 0.13 ms (Figure 2D), peaked in amplitude at 6.66 ± 0.31 ms after the presynaptic AP (Figure 2E), and had a half-width of 15.52 ± 0.97 ms (Figure 2F) and decay time of 16.22 ± 1.24 ms (Figure 2G).
Figure 2.

Amplitude and Kinetics of Monosynaptic Excitatory Connections In Vivo
(A) Example averaged uEPSP; Vm mark shows −68.2 mV.
(B) Grand average uEPSP evoked by a single presynaptic AP; Vm mark shows −60.4 mV.
(C–H) Population distributions of uEPSP kinetics showing: (C) latency, (D) rise time, (E) peak time, (F) half-width, (G) decay time, and (H) amplitude. Corresponding mean value ± SEM is written below each title.
See also Figure S2.
Across our entire dataset, uEPSP amplitude ranged from 0.05 to 2.59 mV, with a mean value (0.43 ± 0.07 mV) lower than that in in vitro studies (Feldmeyer et al., 2006, Holmgren et al., 2003, Lefort et al., 2009). Plotting a histogram of mean amplitudes revealed a skewed distribution, with the majority (76.3%) of uEPSPs being <0.5 mV and a small minority (10.2%) being >1 mV (Figure 2H). This resembled the distribution of the amplitude of excitatory connections in vitro in different cortical areas both within L2/3 (Cossell et al., 2015, Feldmeyer et al., 2006, Holmgren et al., 2003, Lefort et al., 2009) and between pyramidal neurons within and across other layers (Feldmeyer et al., 2006, Frick et al., 2008, Lefort et al., 2009, Song et al., 2005). Bidirectional connections were not significantly larger in amplitude than unidirectional connections (bidirectional, 0.53 ± 0.18 mV, n = 14; unidirectional, 0.40 ± 0.07 mV, n = 45; p = 0.120).
Reliability of a Unitary Excitatory Synaptic Input Is Correlated to Its Amplitude
The reliability of a synaptic connection will profoundly influence subthreshold response and information flow across the network. Cortical slice work has shown that synaptic failures are extremely rare and that reliability is high (Feldmeyer et al., 2006, Frick et al., 2008, Lefort et al., 2009). However, one recent study, using a modified extracellular solution, showed higher failure rates between L2/3 pyramidal neurons (Urban-Ciecko et al., 2015). To measure the reliability of synaptic transmission, we quantified the coefficient of variation (CV) and the synaptic failure rate (Figures 3A–3D). The mean CV was 0.74 ± 0.06, and the mean failure rate was 21.91 ± 0.30%. The mean amplitude and Vm was stable over a longer time course (Figure S3), suggesting that our stimulus protocol was not inducing long-lasting synaptic change during the testing period. Together, these measurements show that, in vivo, during cortical downstates, excitatory connections were reliable. However, our measurements of CV and failure rate were higher than in in vitro studies.
Figure 3.

Reliability of Excitatory Monosynaptic Connections In Vivo
(A) Nine representative single trial uEPSPs from a reliable connection; the bottom trace shows the averaged uEPSP. Vm mark shows −60.2 mV.
(B) Same as (A) but for a smaller amplitude connection with lower reliability. Vm mark shows −70.7 mV.
(C and D) Population distribution of the (C) CV and (D) failure rate.
(E and F) The (E) CV and (F) failure rates plotted as a function of the uEPSP amplitude show a reduction for larger amplitude connections; each circle represents one connection.
(G) Population distribution of the CV after removal of trials with synaptic failures.
(H) The CV plotted as a function of the uEPSP amplitude after removal of trials with synaptic failures.
See also Figure S3.
A clear relationship between the amplitude and both the CV and failure rate has been observed in many cortical slice studies (Feldmeyer et al., 2006, Frick et al., 2008, Lefort et al., 2009, Markram et al., 1997). Therefore, we next plotted the CV and failure rate as functions of the amplitude of the connection (Figures 3E and 3F). We observed a significant inverse relationship between amplitude and CV and between amplitude and failure rate (CV versus amplitude, p < 0.0001; failure versus amplitude, p < 0.0001). Interestingly, removing the failure trials from the dataset significantly reduced the mean CV (CV with failure, 0.74 ± 0.06; CV without failure, 0.42 ± 0.03; n = 59 connections, p < 0.0001) and the correlation between CV and amplitude (Figures 3G and 3H). Thus, our data show that while smaller amplitude connections are less reliable than larger amplitude connections, the CV is largely accounted for by failure trials.
Short-Term Synaptic Plasticity
In vivo, L2/3 pyramidal neurons often fire in bursts of two APs, with an inter-spike interval (ISI) of <20 ms (Poulet and Petersen, 2008). Short-term synaptic depression of the second of two uEPSPs to consecutive APs with a “paired-pulse ratio” (PPR) of <1 is a hallmark of cortical synaptic transmission in quiescent cortical slices and consistent with a high probability of presynaptic release (Feldmeyer et al., 2006, Markram et al., 1997, Thomson and Lamy, 2007). In contrast, paired-pulse extracellular cortical stimulation in vivo during downstates triggers synaptic responses in neighboring cortical neurons with a PPR of ∼1 (Crochet et al., 2005, Reig and Sanchez-Vives, 2007). Extracellular electrical stimulation, however, could evoke APs in axons from multiple neurons, so it is unclear whether short-term synaptic depression is present in vivo at the level of a monosynaptic connection.
To examine the PPR in vivo, we evoked doublets of APs with a mean ISI of 14.00 ± 0.84 ms and low jitter (SD of the ISI, n = 16 connections, 1.88 ± 0.21 ms) (Figure S4). Next, we averaged the synaptic response from AP1 and AP2 separately and measured the PPR (Figures 4A–4G). We observed a range of PPRs from facilitation (PPR > 1; Figure 4C) through no change (PPR ∼1; Figure 4D) to depression (PPR < 1; Figure 4E). Overall, there was no significant difference in the amplitude of responses to AP1 and AP2 (uEPSP1, 0.78 ± 0.20 mV; uEPSP2, 0.77 ± 0.16 mV; n = 16 connections, p = 0.744), and the mean PPR was 1.15 ± 0.09 mV. Thus, in vivo excitatory connections between L2 pyramidal neurons in barrel cortex show less depression than prior in vitro measurements (Feldmeyer et al., 2006, Urban-Ciecko et al., 2015). The correlation of EPSP1 amplitude and PPR had a negative slope (r = −0.48) but was not significant (p = 0.055; Figure 4H). We did, however, observe a significant positive correlation between the CV and the PPR (r = 0.54, p = 0.030; Figure 4I); i.e., more reliable connections had a lower PPR than less reliable connections. Overall, while monosynaptic excitatory connections in vivo have a population average PPR near unity, individual connections exhibit short-term plasticity.
Figure 4.

Short-Term Synaptic Dynamics of Excitatory Monosynaptic Connections In Vivo
(A and B) In vivo z stack image (A) and biocytin reconstruction (B) from a triplet of pyramidal neurons. Colors in (B) correspond to cell numbers in (A). Lighter cell shading represents axons.
(C) Example averaged synaptic response from cell 1 to cell 2 shown in (A) and (B). Left: average response triggered by the first AP (AP1) of a doublet evoked by current injection. Red number 1 highlights uEPSP1 evoked by AP1. Dashed lines show points of measurement of the amplitude of uEPSP1. Middle: averaged synaptic response triggered by the second AP (AP2) of the doublet. Blue number 2 indicates uEPSP2 evoked by AP2. Dashed line from uEPSP1 shows part of the overlaid decay phase of the normalized response to a single uEPSP from the same connection averaged with the same inter-spike intervals (see also Experimental Procedures); vertical dashed line shows time point used to measure amplitude of uEPSP2. Right: overlay of uEPSP1 and uEPSP2 centered at their peak response; this example shows paired-pulse facilitation. Vm mark shows −60.8 mV.
(D and E) Same as in (C) but for different example connections showing (D) a PPR of nearly 1 and (E) an example connection with paired-pulse depression. Vm mark in (D) shows −66.0 mV; in (E), it shows −60.0 mV.
(F) Population analysis shows that there is no difference in amplitude of uEPSP1 and uEPSP2. Gray lines show individual examples, and filled circles indicate the mean ± SEM. Red indicates uEPSP1, and blue indicates uEPSP2.
(G) Graph of the PPR with circles showing individual connections; bar shows population mean with SEM.
(H) The PPR plotted as a function of the amplitude of uEPSP1.
(I) The PPR plotted as a function of the CV calculated from the trial-by-trial amplitude of uEPSP1.
See also Figure S4.
Discussion
We used multiple in vivo two-photon targeted whole-cell recordings to investigate excitatory monosynaptic transmission between L2 pyramidal neurons in anesthetized mouse somatosensory cortex. In agreement with previous measurements of pyramid-to-pyramid connections in cortical slices, our data show a sparsely connected network linked by mostly small but occasionally large amplitude connections. However, we observed a higher synaptic failure rate and less synaptic depression than typically observed in vitro.
Identifying Monosynaptic Connections In Vivo with Targeted Multiple Whole-Cell Recordings
A critical step to routinely identify monosynaptic connections in vivo was to visually target multiple recordings to neighboring neurons. Two-photon microscopy allowed visualization of genetically identified pyramidal neurons, and whole-cell recordings provided a tool to control presynaptic AP timing and record small-amplitude, subthreshold synaptic inputs. Moreover, to increase the number of testable connections, a value that increases exponentially with the number of recorded cells, we developed a configuration to insert up to four pipettes per recording attempt. In the future, multiple targeted patch-clamp recordings in vivo will allow investigations into the link between monosynaptic connectivity, subthreshold correlations, and synaptic computation during sensory processing, which are not yet possible with extracellular recording methods.
Synaptic Connectivity Rates In Vivo
We hypothesized that connection rates in vivo would be greater than rates in vitro, since the preparation of acute brain slices truncates projections between neurons. Thus, it was surprising that the probability of two pyramidal neurons forming a connection in vivo (6.7%) was slightly lower than the rate determined from in vitro measurements of the same neuronal population in mouse barrel cortex (9.3%) (Lefort et al., 2009). It was also lower than the connectivity rates identified between L2/3 neurons in cortical slice studies of mouse visual cortex (Cossell et al., 2015, Ko et al., 2011, Yoshimura et al., 2005), but similar to that in a study including data from visual and somatosensory cortex (6.2%) (Holmgren et al., 2003). This difference may be due to a lower number of synaptic contacts in vivo or reflect the higher failure rates, leading to an underestimation of connectivity.
A higher number of connections than expected were bidirectional, in agreement with in vitro recordings in visual cortex (Cossell et al., 2015, Ko et al., 2011, Song et al., 2005) and somatosensory cortex (Markram et al., 1997, Perin et al., 2011), but in contrast to findings from a study of barrel cortex (Lefort et al., 2009). Interestingly, bidirectional connections are more prominent between pyramidal neurons with similar functional response properties (Cossell et al., 2015), suggesting that connected L2 neurons may share receptive field properties (Jouhanneau et al., 2014). It will be intriguing to compare bidirectional connectivity in vivo across cortical regions to see whether their formation is correlated to distinct temporal coding strategies (Clopath et al., 2010).
Amplitude and Kinetics of Synaptic Connections between Pyramidal Neurons In Vivo
The kinetics of uEPSPs underlies the temporal coding characteristics of neurons. The mean uEPSP latency, rise, and peak time had values similar to those measured in cortical slice studies of monosynaptic connections between somatosensory cortex L2/3 pyramidal neurons, but with broader distributions (Feldmeyer et al., 2006, Lefort et al., 2009). The half-width and decay time in vivo were slightly shorter than some in vitro measurements (Holmgren et al., 2003, Lefort et al., 2009, Markram et al., 1997), which could reflect differences in the level of background synaptic activity or neuromodulator tone. Identification of the location of dendritic synaptic contacts between connected pairs or dendritic stimulation will help us understand whether the synaptic location site determines the in vivo kinetic properties.
Similar to many in vitro and in vivo studies, synaptic connections were mostly small in amplitude, with infrequent, larger amplitude connections forming a skewed distribution with a long tail (Cossell et al., 2015, Crochet et al., 2005, Feldmeyer et al., 2006, Frick et al., 2008, Holmgren et al., 2003, Lefort et al., 2009, Markram et al., 1997, Pala and Petersen, 2015, Perin et al., 2011, Song et al., 2005). However, the mean connection amplitude in vivo (0.43 mV) was lower than prior slice work on L2/3 pyramidal neurons (Feldmeyer et al., 2006, Lefort et al., 2009). This could result from higher postsynaptic levels of synaptic activity and shunting conductances, reduced presynaptic release probability, or differences in the number of synaptic contacts.
Cortical slice measurements in somatosensory cortex have shown that unitary excitatory connections between pyramidal neurons typically have very low failure rates and low trial-by-trial variability with a CV <0.6 (Feldmeyer et al., 2006, Frick et al., 2008, Lefort et al., 2009, Markram et al., 1997). In contrast, we found a higher CV of 0.7 and a failure rate of 22%. As described previously for in vitro findings (Feldmeyer et al., 2006, Lefort et al., 2009, Markram et al., 1997), the CV and failure rate were negatively correlated with the amplitude of the connection. Interestingly, we never observed a failure in connections >1 mV. When synaptic failure trials were removed, the CV was smaller (0.4) and the correlation of CV with amplitude was weaker, showing that most of the CV could be accounted for by synaptic failures. While transmission between L2 neurons can fail, it is reliable once it occurs. The higher failure rates and CV in vivo may result from postsynaptic changes to the propagation of subthreshold activity along dendrites due to shunting conductances, or may result from a reduction in the probability of presynaptic glutamate release (Borst, 2010, Crochet et al., 2005, Urban-Ciecko et al., 2015).
An indirect way of assessing the probability of presynaptic release is through measurement of the PPR. A PPR <1, indicating short-term synaptic depression, is typical of excitatory synaptic connections between pyramidal neurons in cortical slices (Feldmeyer et al., 2006, Holmgren et al., 2003, Markram et al., 1997). This is thought to result from a high probability of presynaptic release of glutamate to the first of two APs that depletes the glutamatergic vesicle pool, leading to reduced release and a smaller EPSP to the second AP. Here, we made the first measurements of the PPR between monosynaptically connected excitatory pyramidal neurons in vivo and show an overall PPR of 1.15. Moreover, we observed a correlation between the CV and the PPR, showing that more reliable connections are more likely to show synaptic depression.
Other in vivo studies of synaptic connections that are known to depress in vitro, including the calyx of Held (Lorteije et al., 2009), cortical pyramidal neurons (Crochet et al., 2005, Reig and Sanchez-Vives, 2007), and excitatory connections to parvalbumin-expressing GABAergic interneurons (Pala and Petersen, 2015), have also observed less depression and a PPR near or above 1. This has been attributed to a reduction in presynaptic release of glutamate in vivo, which may result from lower extracellular Ca2+ concentrations (Borst, 2010, Crochet et al., 2005), higher in vivo firing rates, differences in preparation (e.g., age, temperature), or active suppression of release through GABAB and other metabotropic receptors (Urban-Ciecko et al., 2015). Whole-cell recordings, axonal and dendritic functional imaging, and direct optogenetic or glutamatergic stimulation of postsynaptic structures could now be used to address the relative contribution of presynaptic release and postsynaptic integration on the higher PPR and failure rate values observed in vivo.
Future Perspectives
What drives AP firing in L2/3 pyramidal neurons in vivo? Somatic whole-cell recordings have revealed that APs in L2/3 pyramidal neurons in awake mice are triggered by large-amplitude, cell-specific, depolarizing synaptic input (Poulet and Petersen, 2008). Is this input the result of the summation of synchronous small-amplitude uEPSPs or sparse but large-amplitude inputs? Interestingly, in visual cortex, the amplitude of a connection is correlated with the similarity of sensory tuning between two pyramidal neurons (Cossell et al., 2015). Furthermore, modeling suggests that reliable, large-amplitude connections play an important role in cortical computation (Cossell et al., 2015, Lefort et al., 2009). Our approach provides a way to investigate monosynaptic transmission in genetically identified cell types in vivo and to assess the impact of uEPSPs of different amplitudes on the sensory response and AP generation.
In vivo synaptic transmission occurs on a background of depolarized synaptic activity during active brain states, which has been suggested to alter synaptic transmission to different degrees (Destexhe and Paré, 1999, Waters and Helmchen, 2006). Thus, a next critical step will be to investigate how synaptic transmission, integration, and plasticity are modified by brain state, sensory input, and neuromodulators in vivo.
Experimental Procedures
Animal Surgery
All experimental procedures were carried out in accordance with German regulations on animal welfare and the Berlin Animal Welfare Office (Landesamt für Gesundheit und Soziales; LAGeSo). P18–P30 male C57BL6J (212 neurons recorded; 20 connections/288 tested), NEX-Cre (Goebbels et al., 2006) × Ai9 (Madisen et al., 2010) (238 neurons recorded; 22 connections identified/364 connections tested), fosGFP (Barth et al., 2004) (92 neurons recorded; 11 connections identified/106 connections tested), or GAD67-GFP (Tamamaki et al., 2003) (88 neurons recorded; 6 connections identified/120 connections tested) mice were anesthetized with 1.5 g/kg urethane or 1.5%–2% isoflurane. Mouse core body temperature was constantly monitored with a rectal probe and kept at 37°C with a heating pad. A lightweight metal head support was implanted onto the skull with glue and dental cement. The skull was covered with Ringer’s solution (in mM): 135 NaCl, 5 KCl, 5 HEPES, 1.8 CaCl2, 1 MgCl2; and a small craniotomy (about 1 mm in diameter) was drilled over primary somatosensory whisker barrel cortex identified either with intrinsic optical imaging during stimulation of the C2 whisker or stereotactic coordinates (1.2 mm posterior, 3.5 mm lateral to bregma) to expose the brain. The dura was carefully removed with a needle. All recordings were made under urethane anesthesia.
Two-Photon Targeted Whole-Cell Patch-Clamp Recordings
Mice were placed under a Femto2D in vivo two-photon laser-scanning microscope (Femtonics) and illuminated with a Chameleon Ultra II (Coherent) pulsed laser-light source at 820 nm (for shadowpatching and GAD67-GFP) and 950 nm (for NEX-Cre × Ai9 imaging) via a 40× Olympus water immersion objective (LUMPLFLN 40XW, NA 0.8, working distance 3.3 mm). Laser power was 5–10 mW measured under the objective. Imaging was controlled with MES software (Femtonics) running in MATLAB (MathWorks). Whole-cell patch-clamp recordings were made with 2 mm diameter borosilicate glass pipettes (Hilgenberg) with a resistance of 5–7 MΩ. Three to four pipettes were filled with intracellular solution containing the following, in millimolar: 135 potassium gluconate, 4 KCl, 10 HEPES, 10 phosphocreatine, 4 MgATP, 0.3 Na3GTP (adjusted to a pH of 7.3 with KOH), 30 μM Alexa Fluor 594 (Invitrogen), and 2 mg/ml biocytin for anatomical reconstruction. Whole-cell recordings were made from an Axon Multiclamp 700B amplifier (Molecular Devices) in current clamp mode. An Ag/AgCl ground electrode was placed in the recording chamber. Recordings were not compensated for liquid junction potential.
Three or four pipettes were inserted through the pia at 150–190 mbar, avoiding blood vessels. Next, at ∼5–10 μm depth, the pressure was reduced to 100 mbar, and the pipettes were moved to ∼100 μm depth. At this point, the pressure was reduced again to 50 mbar until reaching the L1/2 border, at which point, the pressure was reduced to 30 mbar. Three or four pyramidal somata were then approached to within 20 μm. The red fluorescent somatic signal in NEX-Cre × Ai9 mice was used to visually target excitatory neurons. In wild-type mice, pyramidal somata were targeted using the shadowpatch method, whereby Alexa Fluor 594 was puffed out of the recording electrodes to fill the extracellular space, leaving cell somata as dark “shadows.” In GAD67-GFP mice, the GFP label of the GABA-ergic interneurons was used alongside the shadow signal to target pyramidal neurons. Then, we contacted each neuron and formed a gigaseal between the patch electrode and the cell membrane one cell at a time. Contact was monitored by resistance changes visualized on an oscilloscope (Tektronix TDS2024C) and live two-photon images. Finally, we ruptured each cell membrane with negative pressure to achieve whole-cell configuration. This sequence reduced tissue movement during the final stages of patching and helped achieve a successful multiple recording (Figure S1).
Recordings were digitized at 20 kHz, filtered at 10 kHz, and recorded via an ITC-18 (Heka Elektronik) analog-to-digital converter connected to a PC under the control of IgorPro (Wavemetrics). To test for a synaptic connection, first, the current threshold needed to trigger a single spike in each recorded cell was found manually using the Multiclamp stimulus command. Next, under the control of IgorPro, square current pulses with a duration of 10–20 ms and an amplitude of 100–400 pA were injected into each cell at 0.5 or 1 Hz in sweeps of 60 s to trigger single APs. In some experiments, single-current pulses of longer duration, 20–50 ms, were used to evoke a doublet of spikes. In vivo z stack images (2 μm per slice) were made after the termination of the recording to check for the presence of dendritic spines. Depth and cell soma distance were calculated using images of targeted cells taken before the recording.
Histology
After recording, mice were deeply anesthetized by an additional intraperitoneal (i.p.) injection of urethane and transcardially perfused with 4% paraformaldehdye (PFA). The brain was removed, fixed in 4% PFA overnight, and stored in phosphate buffer at 4°C before histological processing for all brains. Subsequently, 100-μm-thick tangential slices were made using a Leica VT1000 S vibrating microtome. Slices were stained for cytochrome oxidase to reveal the barrel cortex map and then for biocytin with a standard ABC kit (Vectastain), with DAB enhancement to reveal the recorded neurons. Slices were mounted in Moviol and stored at 4°C. Pyramidal cells were identified using the in vivo z stack images showing dendritic spines and the post hoc biocytin fill. Neurons were photographed and reconstructed using NeuroLucida software (MicroBrightField).
Data Analysis
A tested connection was included in the dataset if the postsynaptic downstate Vm was less than −50 mV. Of a possible 898 connections, we could theoretically test (from 185 dual, 84 triple, and 2 quadruple recordings), in 20 cases, one cell in the pair had a resting Vm greater than −50 mV, so it was excluded as postsynaptic recipient but was kept as a presynaptic partner, as we were able to trigger APs. In more detail, connections from six pairs in 185 dual recordings were only tested one way (instead of two), and connections from seven pairs in 84 triple recordings were only tested four ways (instead of six). As a result, we tested 878 connections in total and identified 59 synaptic connections. Only data from pairs of cells that we could test for connections both ways were included in the test for overrepresentation of bilateral connectivity and shown in Figure 1G (i.e., 858 connections).
Current evoked APs and the corresponding postsynaptic response were selected and separated based on the Vm of the postsynaptic cell in two time windows, 10–20 ms before and 100–150 ms after the peak time of the presynaptic spike. Downstate responses were identified as those where the mean Vm was not more than 3–4 mV more depolarized than the most negative Vm value. Downstate sweeps were visually inspected to confirm the automatic sorting. All further analysis was performed on downstate responses.
To identify a connection, first, the average response to all single-current evoked APs was made. Then, response amplitudes were measured from each trial as the difference between the average Vm ± 0.5 ms around the peak response and the average Vm ± 0.5 ms around latency. Next, shuffled amplitude measurements were made with the same time interval apart as in the response trials (i.e., peak time − latency) during the downstate. Statistical significance of a postsynaptic response was finally assessed by comparing amplitudes of the response and shuffled measurements using a one-tailed Wilcoxon-Mann-Whitney two-sample rank test and a bootstrap test (see “Statistical Analysis”).
Kinetics of the uEPSPs were measured and visually confirmed from the averaged downstate response. We measured latency as the crossing point of the extrapolation of two linear fits: the first, from −5 ms to −2 ms prior to the presynaptic spike; and the second, between time points on the rising phase of the uEPSP corresponding to 20% and 80% of the uEPSP amplitude. In some cases, we removed a presynaptic spike artifact in the postsynaptic response by subtracting the averaged response to downstate synaptic failures with low noise. Rise time was calculated as the difference in time between 20% and 80% of the peak of the uEPSP on the rising phase. The half-width was calculated as the difference in time between the rising phase and falling phase of the uEPSP at 50% of peak response amplitude. Decay time was defined as the difference in time on the decay phase between 20% and 80% of the peak amplitude, as measured on the rising phase. Amplitude was calculated as described earlier. Time to peak was measured as the time difference between peak amplitude and latency.
To calculate the CV, we first measured the amplitude of the trial-by-trial downstate uEPSPs. Next, we measured the amplitude between two random time points during the downstate (background uEPSP) with the time difference between these two points being the same as for the uEPSPs. This was repeated for every downstate uEPSP and for background uEPSPs. We then subtracted the mean variance of the background uEPSPs from the uEPSP variance and divided the result by the mean uEPSP amplitude. This calculation was repeated 100 times, and an average value taken for the final CV value.
A synaptic failure was defined as a subthreshold response to a presynaptic AP that was smaller than 1.5 × the SD of the baseline Vm. The averaged response of failure events in a connection was visually inspected and resulted in a flat Vm trace.
To measure the PPR, we had to measure the amplitude of two EPSPs (uEPSP1 and uEPSP2) evoked in response to the first and second AP (AP1 and AP2) in the doublet. First, the postsynaptic Vm was averaged at the time of AP1. Then, the amplitude of EPSP1 was measured as the difference between the average Vm in a ±0.5 ms window around the AP1 peak response and the Vm at latency. Next, the data were averaged from AP2 to calculate the amplitude of uEPSP2. However, uEPSP2 is riding on top of the decaying phase of uEPSP1, so, to calculate the amplitude of uEPSP2, we first measured the postsynaptic response to single AP responses from the same connection. Then, we used the ISIs between AP1 and AP2 to shift the averaging process of the single-spike response and construct a model synaptic response (uEPSP1m) with the same decay dynamics as for uEPSP1 when centered on AP2. uEPSP1m was then overlaid with the postsynaptic response to AP2 and normalized to the amplitude of uEPSP1. Decay phases of uEPSP1m are shown as dashed lines in Figures 4C–4E (middle columns). The amplitude of uEPSP2 was finally taken as the difference between the average Vm in a ±0.5 ms window around the uEPSP2 peak response and the average uEPSP1m Vm in a ±0.5 ms window at the same time point.
Statistical Analysis
We used the non-parametric Wilcoxon Mann-Whitney two-sample rank test for unpaired data or a non-parametric Wilcoxon signed-rank test for paired data. All tests were two-tailed except where stated. Bootstrapping to test for significance of a connection was performed by randomly selecting, with replacement, amplitudes from the trial-by-trial response amplitudes and from the shuffled amplitude measurements. Then, we calculated the average response amplitude and the average noise amplitude from this bootstrapped dataset and repeated this process 10,000 times to obtain the 95% confidence intervals. To compare connectivity rates between in vivo and in vitro and to test whether bidirectional connections are overrepresented (i.e., non-random connectivity), we performed two-tailed chi-square tests. To test for correlations between features of uEPSPs, we used Pearson’s correlation coefficient r with t statistics. Data were correlated on a normal scale in Figures 1H and 1I. Correlations in Figures 3E, 3F, and 3H, Figures 4H and 4I, and Figure S4D were analyzed on a log scale. Values are given as mean ± SEM in figures and in the text.
Author Contributions
J.-S.J. and J.F.A.P. designed the project. J.-S.J. performed experiments and cell reconstructions. A.L.D. and J.F.A.P. carried out early experiments. J.-S.J., J.K., and J.F.A.P. analyzed the data. J.F.A.P. wrote the manuscript, with comments from all coauthors.
Acknowledgments
We would like to thank Janett König for technical assistance. We thank Evgeny Bobrov, Dietmar Schmitz, and Christian Wozny for constructive comments on earlier versions of the manuscript; and we thank Alison Barth and Sylvain Crochet for discussions. J.K. is funded by the Humboldt-Universität zu Berlin in the framework of the Excellence Initiative of the BMBF and Deutsche Forschungsgemeinschaft (DFG). J.F.A.P. is funded by a European Research Council starting grant (ERC-2010-StG-260590), the European Union (3x3Dimaging 323945), the DFG (Exc 257 NeuroCure, FOR 1341, FOR 2143), and the Helmholtz Society.
Published: December 3, 2015
Footnotes
This is an open access article under the CC BY-NC-ND license (http://creativecommons.org/licenses/by-nc-nd/4.0/).
Supplemental Information includes four figures and one table and can be found with this article online at http://dx.doi.org/10.1016/j.celrep.2015.11.011.
Supplemental Information
References
- Barth A.L., Gerkin R.C., Dean K.L. Alteration of neuronal firing properties after in vivo experience in a FosGFP transgenic mouse. J. Neurosci. 2004;24:6466–6475. doi: 10.1523/JNEUROSCI.4737-03.2004. [DOI] [PMC free article] [PubMed] [Google Scholar]
- Borst J.G.G. The low synaptic release probability in vivo. Trends Neurosci. 2010;33:259–266. doi: 10.1016/j.tins.2010.03.003. [DOI] [PubMed] [Google Scholar]
- Bruno R.M., Sakmann B. Cortex is driven by weak but synchronously active thalamocortical synapses. Science. 2006;312:1622–1627. doi: 10.1126/science.1124593. [DOI] [PubMed] [Google Scholar]
- Clopath C., Büsing L., Vasilaki E., Gerstner W. Connectivity reflects coding: a model of voltage-based STDP with homeostasis. Nat. Neurosci. 2010;13:344–352. doi: 10.1038/nn.2479. [DOI] [PubMed] [Google Scholar]
- Cossell L., Iacaruso M.F., Muir D.R., Houlton R., Sader E.N., Ko H., Hofer S.B., Mrsic-Flogel T.D. Functional organization of excitatory synaptic strength in primary visual cortex. Nature. 2015;518:399–403. doi: 10.1038/nature14182. [DOI] [PMC free article] [PubMed] [Google Scholar]
- Crochet S., Chauvette S., Boucetta S., Timofeev I. Modulation of synaptic transmission in neocortex by network activities. Eur. J. Neurosci. 2005;21:1030–1044. doi: 10.1111/j.1460-9568.2005.03932.x. [DOI] [PubMed] [Google Scholar]
- Destexhe A., Paré D. Impact of network activity on the integrative properties of neocortical pyramidal neurons in vivo. J. Neurophysiol. 1999;81:1531–1547. doi: 10.1152/jn.1999.81.4.1531. [DOI] [PubMed] [Google Scholar]
- Feldmeyer D., Egger V., Lübke J., Sakmann B. Reliable synaptic connections between pairs of excitatory layer 4 neurones within a single ‘barrel’ of developing rat somatosensory cortex. J. Physiol. 1999;521:169–190. doi: 10.1111/j.1469-7793.1999.00169.x. [DOI] [PMC free article] [PubMed] [Google Scholar]
- Feldmeyer D., Lübke J., Sakmann B. Efficacy and connectivity of intracolumnar pairs of layer 2/3 pyramidal cells in the barrel cortex of juvenile rats. J. Physiol. 2006;575:583–602. doi: 10.1113/jphysiol.2006.105106. [DOI] [PMC free article] [PubMed] [Google Scholar]
- Frick A., Feldmeyer D., Helmstaedter M., Sakmann B. Monosynaptic connections between pairs of L5A pyramidal neurons in columns of juvenile rat somatosensory cortex. Cereb. Cortex. 2008;18:397–406. doi: 10.1093/cercor/bhm074. [DOI] [PubMed] [Google Scholar]
- Fujisawa S., Amarasingham A., Harrison M.T., Buzsáki G. Behavior-dependent short-term assembly dynamics in the medial prefrontal cortex. Nat. Neurosci. 2008;11:823–833. doi: 10.1038/nn.2134. [DOI] [PMC free article] [PubMed] [Google Scholar]
- Goebbels S., Bormuth I., Bode U., Hermanson O., Schwab M.H., Nave K.-A. Genetic targeting of principal neurons in neocortex and hippocampus of NEX-Cre mice. Genesis. 2006;44:611–621. doi: 10.1002/dvg.20256. [DOI] [PubMed] [Google Scholar]
- Holmgren C., Harkany T., Svennenfors B., Zilberter Y. Pyramidal cell communication within local networks in layer 2/3 of rat neocortex. J. Physiol. 2003;551:139–153. doi: 10.1113/jphysiol.2003.044784. [DOI] [PMC free article] [PubMed] [Google Scholar]
- Jouhanneau J.-S., Ferrarese L., Estebanez L., Audette N.J., Brecht M., Barth A.L., Poulet J.F.A. Cortical fosGFP expression reveals broad receptive field excitatory neurons targeted by POm. Neuron. 2014;84:1065–1078. doi: 10.1016/j.neuron.2014.10.014. [DOI] [PubMed] [Google Scholar]
- Kirov S.A., Sorra K.E., Harris K.M. Slices have more synapses than perfusion-fixed hippocampus from both young and mature rats. J. Neurosci. 1999;19:2876–2886. doi: 10.1523/JNEUROSCI.19-08-02876.1999. [DOI] [PMC free article] [PubMed] [Google Scholar]
- Kitamura K., Judkewitz B., Kano M., Denk W., Häusser M. Targeted patch-clamp recordings and single-cell electroporation of unlabeled neurons in vivo. Nat. Methods. 2008;5:61–67. doi: 10.1038/nmeth1150. [DOI] [PubMed] [Google Scholar]
- Ko H., Hofer S.B., Pichler B., Buchanan K.A., Sjöström P.J., Mrsic-Flogel T.D. Functional specificity of local synaptic connections in neocortical networks. Nature. 2011;473:87–91. doi: 10.1038/nature09880. [DOI] [PMC free article] [PubMed] [Google Scholar]
- Lefort S., Tomm C., Floyd Sarria J.-C., Petersen C.C.H. The excitatory neuronal network of the C2 barrel column in mouse primary somatosensory cortex. Neuron. 2009;61:301–316. doi: 10.1016/j.neuron.2008.12.020. [DOI] [PubMed] [Google Scholar]
- London M., Roth A., Beeren L., Häusser M., Latham P.E. Sensitivity to perturbations in vivo implies high noise and suggests rate coding in cortex. Nature. 2010;466:123–127. doi: 10.1038/nature09086. [DOI] [PMC free article] [PubMed] [Google Scholar]
- Lorteije J.A.M., Rusu S.I., Kushmerick C., Borst J.G.G. Reliability and precision of the mouse calyx of Held synapse. J. Neurosci. 2009;29:13770–13784. doi: 10.1523/JNEUROSCI.3285-09.2009. [DOI] [PMC free article] [PubMed] [Google Scholar]
- Madisen L., Zwingman T.A., Sunkin S.M., Oh S.W., Zariwala H.A., Gu H., Ng L.L., Palmiter R.D., Hawrylycz M.J., Jones A.R. A robust and high-throughput Cre reporting and characterization system for the whole mouse brain. Nat. Neurosci. 2010;13:133–140. doi: 10.1038/nn.2467. [DOI] [PMC free article] [PubMed] [Google Scholar]
- Markram H., Lübke J., Frotscher M., Roth A., Sakmann B. Physiology and anatomy of synaptic connections between thick tufted pyramidal neurones in the developing rat neocortex. J. Physiol. 1997;500:409–440. doi: 10.1113/jphysiol.1997.sp022031. [DOI] [PMC free article] [PubMed] [Google Scholar]
- Matsumura M., Chen D., Sawaguchi T., Kubota K., Fetz E.E. Synaptic interactions between primate precentral cortex neurons revealed by spike-triggered averaging of intracellular membrane potentials in vivo. J. Neurosci. 1996;16:7757–7767. doi: 10.1523/JNEUROSCI.16-23-07757.1996. [DOI] [PMC free article] [PubMed] [Google Scholar]
- Molnár G., Oláh S., Komlósi G., Füle M., Szabadics J., Varga C., Barzó P., Tamás G. Complex events initiated by individual spikes in the human cerebral cortex. PLoS Biol. 2008;6:e222. doi: 10.1371/journal.pbio.0060222. [DOI] [PMC free article] [PubMed] [Google Scholar]
- Pala A., Petersen C.C.H. In vivo measurement of cell-type-specific synaptic connectivity and synaptic transmission in layer 2/3 mouse barrel cortex. Neuron. 2015;85:68–75. doi: 10.1016/j.neuron.2014.11.025. [DOI] [PMC free article] [PubMed] [Google Scholar]
- Perin R., Berger T.K., Markram H. A synaptic organizing principle for cortical neuronal groups. Proc. Natl. Acad. Sci. USA. 2011;108:5419–5424. doi: 10.1073/pnas.1016051108. [DOI] [PMC free article] [PubMed] [Google Scholar]
- Poulet J.F.A., Petersen C.C.H. Internal brain state regulates membrane potential synchrony in barrel cortex of behaving mice. Nature. 2008;454:881–885. doi: 10.1038/nature07150. [DOI] [PubMed] [Google Scholar]
- Reid R.C., Alonso J.M. Specificity of monosynaptic connections from thalamus to visual cortex. Nature. 1995;378:281–284. doi: 10.1038/378281a0. [DOI] [PubMed] [Google Scholar]
- Reig R., Sanchez-Vives M.V. Synaptic transmission and plasticity in an active cortical network. PLoS ONE. 2007;2:e670. doi: 10.1371/journal.pone.0000670. [DOI] [PMC free article] [PubMed] [Google Scholar]
- Silver R.A., Lübke J., Sakmann B., Feldmeyer D. High-probability uniquantal transmission at excitatory synapses in barrel cortex. Science. 2003;302:1981–1984. doi: 10.1126/science.1087160. [DOI] [PubMed] [Google Scholar]
- Song S., Sjöström P.J., Reigl M., Nelson S., Chklovskii D.B. Highly nonrandom features of synaptic connectivity in local cortical circuits. PLoS Biol. 2005;3:e68. doi: 10.1371/journal.pbio.0030068. [DOI] [PMC free article] [PubMed] [Google Scholar]
- Steriade M., Nuñez A., Amzica F. A novel slow (< 1 Hz) oscillation of neocortical neurons in vivo: depolarizing and hyperpolarizing components. J. Neurosci. 1993;13:3252–3265. doi: 10.1523/JNEUROSCI.13-08-03252.1993. [DOI] [PMC free article] [PubMed] [Google Scholar]
- Swadlow H.A., Gusev A.G. Receptive-field construction in cortical inhibitory interneurons. Nat. Neurosci. 2002;5:403–404. doi: 10.1038/nn847. [DOI] [PubMed] [Google Scholar]
- Tamamaki N., Yanagawa Y., Tomioka R., Miyazaki J., Obata K., Kaneko T. Green fluorescent protein expression and colocalization with calretinin, parvalbumin, and somatostatin in the GAD67-GFP knock-in mouse. J. Comp. Neurol. 2003;467:60–79. doi: 10.1002/cne.10905. [DOI] [PubMed] [Google Scholar]
- Thomson A.M., Lamy C. Functional maps of neocortical local circuitry. Front. Neurosci. 2007;1:19–42. doi: 10.3389/neuro.01.1.1.002.2007. [DOI] [PMC free article] [PubMed] [Google Scholar]
- Urban-Ciecko J., Fanselow E.E., Barth A.L. Neocortical somatostatin neurons reversibly silence excitatory transmission via GABAb receptors. Curr. Biol. 2015;25:722–731. doi: 10.1016/j.cub.2015.01.035. [DOI] [PMC free article] [PubMed] [Google Scholar]
- Waters J., Helmchen F. Background synaptic activity is sparse in neocortex. J. Neurosci. 2006;26:8267–8277. doi: 10.1523/JNEUROSCI.2152-06.2006. [DOI] [PMC free article] [PubMed] [Google Scholar]
- Yoshimura Y., Dantzker J.L.M., Callaway E.M. Excitatory cortical neurons form fine-scale functional networks. Nature. 2005;433:868–873. doi: 10.1038/nature03252. [DOI] [PubMed] [Google Scholar]
- Yu J., Ferster D. Functional coupling from simple to complex cells in the visually driven cortical circuit. J. Neurosci. 2013;33:18855–18866. doi: 10.1523/JNEUROSCI.2665-13.2013. [DOI] [PMC free article] [PubMed] [Google Scholar]
Associated Data
This section collects any data citations, data availability statements, or supplementary materials included in this article.