Abstract
Existing methods to measure nanomedicine drug release in biological matrices are inadequate. A novel drug release method utilizing a stable isotope tracer has been developed. Stable isotopelabeled drug is spiked into plasma containing nanomedicine. The labeled drug equilibrates with plasma components identical to the normoisotopic drug released from the nanomedicine formulation. Therefore, the ultrafilterable fraction of the isotope-labeled drug represents a reliable measure of free normoisotopic drug fraction in plasma, and can be used to calculate nanomedicine encapsulated and unencapsulated drug fractions. To demonstrate the utility of this method, we performed a plasma drug release study with both a fast releasing commercial docetaxel formulation, Taxotere®, and a delayed releasing nanomicellar formulation of a docetaxel prodrug, Procet 8. The instability of the unencapsulated prodrug in plasma allowed us to compare our calculated prodrug release and docetaxel conversion with the actual docetaxel concentration measured directly without fractionation. Drug release estimates for the fast releasing Taxotere formulation demonstrated accuracy deviation and precision (%CV) of <15%. For the controlled release Procet 8 formulation, we calculated a slow release and conversion of the prodrug in rat plasma that was highly correlated with the direct docetaxel measurement (R2=0.98). We believe this method will have tremendous utility in development and regulatory evaluation of nanomedicines, and aid in determination of generic bioequivalence.
Keywords: Drug release method, Stable isotope dilution, Nanomedicine, Nanotechnology, Fractionation in biological matrix
1 Introduction
Due to the complexity of separating and quantifying encapsulated and unencapsulated drug fractions in biological matrix, nanomedicine pharmacokinetics is often based solely on total drug profiles, but this can give an incomplete understanding of the underlying pharmacokinetics. Similarly, in vitro evaluation of nanomedicine drug release is often conducted in buffer systems as opposed to biological matrices such as blood and plasma, due to the difficulties in quantifying drug fractions. Since buffer systems are unable to mimic the physiological environment in vivo, these in vitro systems often do not accurately predict actual nanomedicine stability [1]. Since the nanomedicine encapsulated drug fraction acts as a systemic depot releasing the active unencapsulated form of the drug, it is important to quantify each of these drug fractions separately in order to comprehensively define nanomedicine pharmacokinetics [2]. Correspondingly, regulators require that the bioequivalence of generic nanomedicines in comparison to the reference products be based upon the pharmacokinetics of the total, encapsulated and unencapsulated drug [3]. There is an urgent need for bioanalytical methods that can accurately and precisely differentiate nanomedicine encapsulated and unencapsulated drug fractions in biological matrix, in order to better characterize nanomedicines currently under development and facilitate regulatory review of generic nanomedicines.
The bioanalytical methods currently available to process biological samples, and allow quantification of nanomedicine encapsulated and unencapsulated drug fractions, suffer from many inherent flaws [3]. Since these methods were originally used for extraction of small molecules from biological samples, or for small molecule protein binding assessment, they require optimization in order to be repurposed for nanomedicine fractionation [4, 5]. This optimization requires an advanced understanding of the underlying separation mechanisms. Common sample processing artifacts that must be addressed include the loss of nanomedicine integrity that results in contamination of the unencapsulated drug fraction, as well as the influence of formulation components on the underlying fractionation mechanism. Importantly, proper controls must be used to establish the accuracy and precision of the fractionation method.
The most common methods used to fractionate nanomedicine samples are membrane filtration (e.g. dialysis, ultrafiltration), ultracentrifugation, chromatographic techniques (size-exclusion, ion-exchange, solid phase extraction), and liquid-liquid extraction [3]. Ultrafiltration, equilibrium dialysis, and ultracentrifugation are actually small molecule protein binding methods that have been adapted to assess drug release from nanomedicine formulations. These repurposed protein binding methods can be referred to as equilibrium techniques, because unlike the other methods listed above, the measured unbound drug is in equilibrium with plasma protein and formulation components. A primary concern with non-equilibrium methods that alter the matrix environment, such as chromatographic and liquid-liquid extraction techniques, is the greater potential for process-induced drug release as a result of sample dilution or exposure to destabilizing extraction chemistries [3]. There is also the concern regarding what the extracted fraction actually represents with these non-equilibrium methods, free drug, protein bound drug, or some combination [4]?
Of the equilibrium methods available, the faster sample processing speed for ultrafiltration is a clear advantage over the much slower dialysis and ultracentrifugation techniques that can often lag nanomedicine drug release kinetics [5]. While ultrafiltration relies on a gentle physical mode of fraction separation that is in theory less prone to process-induced artifacts, it has its own unique challenges. For example, Bekersky et al. adapted the ultrafiltration method for fractionation of amphotericin B nanoliposome in plasma samples [6]. Using Bekersky’s ultrafiltration method, the protein-bound drug fraction was interpolated from an established correlation between free (ultrafilterable) drug concentration and protein-binding. The encapsulated amphotericin B fraction was then measured by subtracting the ultrafilterable and protein-bound amphotericin B concentrations from the total amphotericin B concentration. A serious problem with this method is that formulation-induced alterations in protein binding, and equilibrium binding of free drug to the formulation itself, are not addressed as the free drug-protein binding correlations are established under formulation-free conditions. There are many cases in which formulation components have been shown to dramatically alter protein binding [7], as well as cases in which free drug was found to bind to the formulation in equilibrium and decrease drug free fraction [8]. These points are very important, as formulation-induced alterations in free fraction will result in an inaccurate bound fraction estimate, and thus inaccurate calculation of unencapsulated and encapsulated drug fractions [6].
Our laboratory has recently developed a novel ultrafiltration method to measure encapsulated and unencapsulated nanomedicine in plasma, and assess nanomedicine drug release. This method utilizes a stable isotope of the drug to account for formulation-induced changes in protein-binding, as well as equilibrium binding of the drug to formulation components (Fig. 1).
Fig. 1.
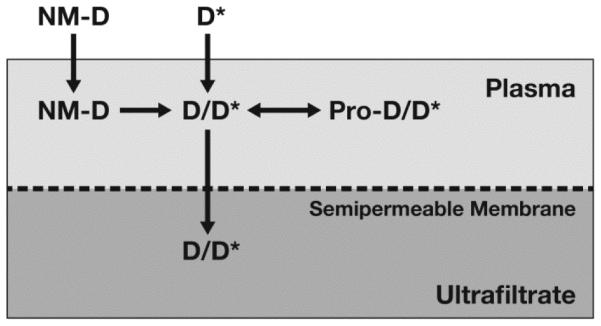
Stable isotope drug release method. In this method, the stable isotopically labeled drug (D*) equilibrates with protein (Pro) and formulation components identical to the unlabeled, normoisotopic drug (D) released from the nanomedicine (NM) formulation. Therefore, the ultrafilterable fraction of the isotopically labeled drug represents a reliable measurement of free drug fraction, and plasma protein bound fraction can be calculated from equation (i) in the text. The unencapsulated and encapsulated nanomedicine fractions can then be easily calculated, using equations (ii) and (iii) in the text, respectively.
In this method, stable isotopically labeled drug is spiked into a plasma sample containing the nanomedicine formulation. This can be a plasma sample from an in vitro incubation or in vivo pharmacokinetic study. The sample is incubated for a predefined time to allow isotope equilibration, an aliquot of the sample is taken, and the remaining sample is then filtered using an ultrafiltration apparatus. Both the sample aliquot and the ultrafiltrate are analyzed by liquid chromatography-mass spectrometry (LC-MS) to determine concentrations of the normoisotopic and isotopically labeled drug.
Since the stable isotopically labeled drug (D*) equilibrates with protein and formulation components identical to the unlabeled, normoisotopic drug (D) released from the nanomedicine formulation, the ultrafilterable fraction of the isotopically labeled drug represents a reliable measurement of free drug fraction. The protein bound fraction can be calculated from equation (i):
| (i) |
The encapsulated and unencapsulated nanomedicine fractions can then be easily calculated using equations (ii) and (iii):
| (ii) |
| (iii) |
In order to evaluate this drug release method, we initially determined if the stable isotope-labeled docetaxel-d5 (DTX-d5) tracer behaved identically to normoisotopic docetaxel (DTX) with regard to protein binding in plasma. Next we evaluated the ability of the stable isotope method to measure DTX release from a fast releasing commercial micelle formulation, Taxotere®, and acetonitrile solvent solubilized DTX. Lastly, we used the stable isotope method to measure controlled release and conversion of a DTX prodrug from a nanomicelle formulation in plasma, and compared the calculated values with direct measurement of the prodrug converted DTX without fractionation to further evaluate method accuracy.
2 Materials and methods
2.2 Materials
DTX was purchased from LC Laboratories, Woburn, MA (Catalog# D-1000). DTX-d9 was purchased from Medical Isotopes, Inc., Pelham, NH (Catalog# D4555). DTX-d5 was purchased from Santa Cruz Biotechnology, Inc., Dallas, Texas (Catalog# sc-218257). Acetonitrile was purchased from VWR, Radnor, PA (Catalog# BJLC015-1). Formic acid was purchased from Thermo Fisher Scientific, Waltham, MA (Catalog# 28905). ZORBAX-SB-C18, 3.5 μm particle, 2.1 × 100 mm HPLC column was purchased from Agilent Technologies, Inc., Columbia, MD (Catalog #861753-902). Sunfire C18 3.5 μm particle, 2.1 × 10 mm guard column was purchased from Waters, Inc., Charlotte, NC (Catalog # 186002530). Microcon®, 0.5 mL, 10 kDa cellulose membrane ultrafiltration device was purchased from Millipore Corporation, Billerica, MA (Product # MRCPRT010, MRCF0R030). Taxotere®, 20 mg/mL docetaxel, was purchased from Sanofi-Aventis Corporation, Bridgewater, NJ. The nanomicellar DTX prodrug formulation was obtained from Celator Pharmaceuticals, Inc., Vancouver, BC.
2.3 Research donor blood
Healthy human volunteer blood specimens were drawn under NCI at Frederick Protocol OH99-C-N046. Human plasma (pooled) was collected fresh from 6 human donors, collected in K2-EDTA tubes.
2.4 Husbandry
Sprague Dawley rats (10 week old female) were purchased from Charles River, Inc., Wilmington, MA. Animal rooms were kept at 50% relative humidity, 68–72°F with 12 h light/dark cycles. Rats were housed with two animals/cage (Rat polycarbonate cage type), with ¼″corncob bedding. Animals were allowed ad libitum access to Purina 18% NIH Block and chlorinated tap water. NCI at Frederick is accredited by AAALAC International and follows the Public Health Service Policy for the Care and Use of Laboratory Animals. Animal care was provided in accordance with the procedures outlined in the Guide for Care and Use of Laboratory Animals (National Research Council, 1996; National Academy Press, Washington, D.C.).
2.5 Protein Binding Comparison
Plasma was prepared from the pooled human blood by centrifugation at 2500xg for 10 min. HEPES buffer (50 μL) was added for every 2 mL of plasma, and the pH adjusted to 7.4. Prewarmed (37°C) plasma samples were spiked with acetonitrile solubilized DTX to yield final concentrations of 0.5, 1, 2, 5, and 10 μg /mL, and DTX-d5 to yield a constant final concentration of 500 ng/mL, in triplicate. Plasma samples were then added to prewarmed (37°C) Microcon 10 kDa MWCO centrifuge devices and incubated for 10 min at 37°C. This incubation time was determined to be sufficient for equilibration of DTX and the stable isotope with protein, and the Microcon ultrafiltration device was determined to have low nonspecific binding to DTX (<20%) (data not shown). The proper equilibration time for the stable isotope spike and DTX was determined by incubation for 5, 10, 15 and 30 min, and determining the earliest time at which protein binding stabilized. This equilibration time was found to be 10 min for both DTX and the stable isotope. The 500 ng/mL DTX-d5 spike concentration was determined to be the limit of detection for the unbound stable isotope, with unbound concentration approximately 30 ng/mL (~6% unbound). Since this method is based on the tracer stable isotope having equivalent binding as the normoisotopic drug, at equivalent binding the calculated amount should equal free normoisotopic drug. Samples were spun at 6000xg for 10 min, and 50 μL of the ultrafiltrate was analyzed by LC-MS. Stock solutions were also analyzed by LC-MS to determine total drug concentration. The percent protein bound drug was calculated from equation (i).
2.6 Taxotere and Solvent Drug Release in Human Plasma
Plasma was prepared from freshly pooled human blood collected in K2-EDTA tubes by centrifugation at 2500xg for 10 min. HEPES buffer (50 μL) was added for every 2 mL of plasma, and the pH adjusted to 7.4. Prewarmed (37°C) plasma samples were spiked with commercial Taxotere or acetonitrile solubilized DTX in triplicate to yield final concentrations of 5 and 10 μg/mL in glass vials, and incubated for 0-230 min at 37°C with agitation. At specified time points, aliquots (450 μL) of the plasma samples were spiked with DTX-d5 at a final concentration of 0.5 μg/mL, vortexed, and 50 μL reserved for total drug analysis and the remaining 400 μL transferred to Microcon 10 kDa MWCO centrifuge devices, and incubated for 10 min at 37°C with agitation. Samples were then centrifuged at 6000xg for 10 min, and 50 μL of the ultrafiltrate analyzed by LC-MS. Released and unreleased drug fractions were determined according to equations (ii) and (iii), respectively.
2.7 Procet 8 Drug Release in Rat Plasma
Blood from Sprague Dawley rats was collected fresh in K2-EDTA tubes. Blood was centrifuged at 2500xg for 10min, plasma collected and pooled. HEPES buffer (50 μL) was added for every 2 mL of plasma, and the pH adjusted to 7.4. Prewarmed plasma samples were spiked with nanomicellar docetaxel prodrug, Procet 8, in triplicate to yield final concentrations of 10, 50, 100 ug/mL Procet 8 (6.4, 32, and 64 ug/mL DTX equivalents), vortexed, and incubated for 0-24 h at 37°C with agitation. At specified time points, aliquots (450 μL) of the plasma samples were spiked with DTX-d5 at a final concentration of 0.5 μg/mL, vortexed, and 50 μL reserved for total drug analysis and the remaining 400 μL transferred to Microcon 10 kDa MWCO centrifuge devices, and incubated for 10 min at 37°C with agitation. Samples were then centrifuged at 6000xg for 10 min, and 50 μL of the ultrafiltrate analyzed by LC-MS. Released and unreleased drug fractions were determined according to equations (ii) and (iii), respectively.
2.8 Docetaxel and Docetaxel-d5 LC-MS Methods
The LC system consisted of a LC/MS 2020 single quad, LC-20AT pump, SPD-20AC auto injector, and C-R3A integrator (Shimadzu Scientific Instruments, Inc., Columbia, MD). The HPLC conditions included a 10 μL injection volume, flow rate of 0.35 mL/min, and a column temperature of 32°C. A water-acetonitrile (ACN) gradient was used for elution: 30% ACN/0.1% formic acid from 0-1.5 min; linear increase to 80% ACN/0.1% formic acid from 1.5-4.5 min; hold at 80% ACN/0.1% formic acid from 4.5-8.5 min; and linear decrease to 30% ACN/0.1% formic acid from 8.5-10.5 min. Column regeneration time between injections was 6.5 min. DTX, DTX-d5, and DTX-d9 elution times were all 8.9 min, and their m/z ions monitored by selected ion monitoring (SIM) were 808, 813, and 817, respectively. The MS instrument used an electrospray ionization source in positive ion mode. Detector voltage was 0.2 kv and the desolvation line (DL) and heat block temperature were both 200°C. High pressure liquid nitrogen was used as the drying gas at a rate of 1.5 L/min. The peak area ratio was used to interpolate DTX concentrations of unknowns from a linear fit of calibration curves. Stock solutions of DTX, DTX-d5 and DTX-d9 were prepared in acetonitrile. These stocks were used to prepare calibration and quality control standards. DTX and DTX-d5 calibration standards were prepared in human and rat plasma and protein-free human and rat plasma, with concentrations ranging from 25 to 25,000 ng/mL. DTX-d9 was used as an internal standard at a concentration of 250 ng/mL. DTX and DTX-d5 low, medium and high QCs were also prepared in matrix at concentrations of 0.125, 1 and 10 μg/mL. Sample or standard (50 μL) in 2 mL eppendorf tubes were spiked with DTX-d9 internal standard at a concentration of 250 ng/mL. Next, 200 μL ice cold ACN with 0.1% formic acid was added and the sample vortexed. The sample was placed at −80°C for 10 min, then thawed at room temperature. The thawed sample was then spun at 18,000xg for 20 min at 4°C to pellet precipitated protein. The supernatant was transferred to a glass tube and dried under nitrogen gas at 48°C. The dried residue was resuspended in 150 μL 30% ACN with 0.1% formic acid. The extracted sample was transferred to a 0.5 mL eppendorf tube, and centrifuged at 14,000xg for 5 min at room temperature. The supernatant was transferred to a 1.5 mL amber glass screw top HPLC vial with fixed Teflon insert and cap, and placed in an HPLC autosampler vial rack. Plasma blank, internal sample spiked plasma blank, and quality control samples were run with each calibration curve.
Results and Discussion
The protein binding of DTX over a concentration range of 0.5-10 μg/mL was compared to spiked DTX-d5, at a constant concentration of 0.5 ug/mL. We were able to demonstrate that the spiked isotopically labeled DTX behaved identically to the normoisotopic drug (Fig. 2). This was important, as deuteration can affect the physicochemical properties of a drug. DTX-d5, spiked at a constant concentration of 0.5 ng/mL, demonstrated identical protein binding characteristics in human plasma as compared to normoisotopic DTX over a clinically relevant concentration range of 500-10,000 ng/mL, with protein bound fractions between 92-96% (Fig. 2). These data support the fact that docetaxel protein binding characteristics were not impacted by deuteration. In further support of the fact that the tracer stable isotope has equivalent binding characteristics as the normoisotopic drug, the method calculated total drug concentrations, calculated from equation (ii), were highly correlated (R2=0.99) with the theoretical normoisotopic drug concentrations (Fig. 3), as expected.
Fig. 2.

Protein binding comparison of docetaxel and docetaxel-d5 in human plasma. Protein binding of docetaxel (DTX) over a concentration range of 500-10,000 ng/mL, with 500 ng/mL deuterated docetaxel-d5 (DTX-d5) spike, was determined . Displayed are the unbound DTX concentrations, measured as the ultrafilterable drug concentrations, and the % bound drug for both DTX and spiked DTX-d5, calculated from equation (i) (mean ± SD, N=3).
Fig. 3.
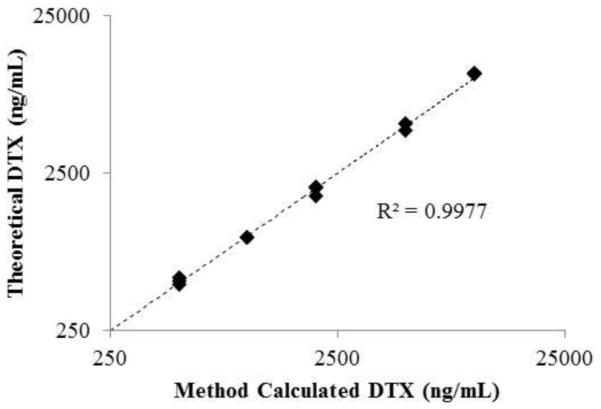
Correlation plot of theoretical versus method calculated docetaxel concentrations for protein binding comparison. Displayed are the individual theoretical versus calculated docetaxel (DTX) concentrations for each DTX concentration level.
In order to determine the accuracy and precision of the stable isotope dilution assay, we evaluated drug release from two unstable formulations of DTX in human plasma, a commercial Tween 80 micellar formulation, Taxotere, and acetonitrile solvent solubilized DTX. Both formulations released all drug by the earliest 10 min time point. Unfortunately, we could not evaluate earlier time points, since stable isotope and normoisotopic DTX protein binding equilibration times were 10 min. By comparing the method calculated drug release with theoretical complete drug release for the fast releasing drug formulations, the method was found to have an accuracy deviation (i.e., deviation from 100% theoretical release) and precision (i.e., % coefficient of variation) of less than 15% at all time points and all concentrations evaluated (Fig. 4). This supports the fact that the stable isotope free fraction is a reliable estimate of the free fraction for the normoisotopic DTX released from the formulations. If this were not the case, and the stable isotope was not an accurate tracer of normoisotopic free fraction, then the method would not have been accurate as the underlying calculated free fraction estimates vary substantially by concentration and time point (data not shown). Similarly, the high precision of the method further supports the use of the stable isotope control.
Fig. 4.
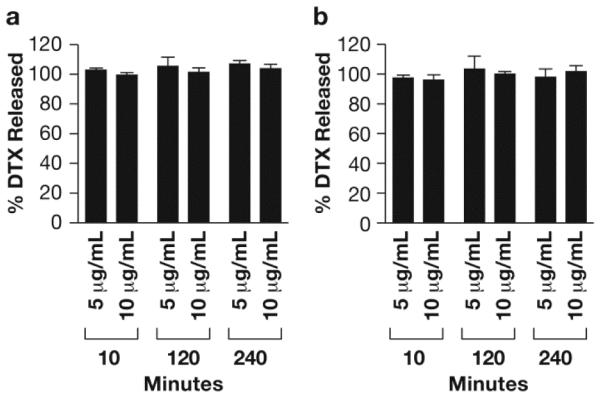
Drug release from Taxotere and solvent formulations in human plasma. Displayed are the % released docetaxel (DTX) for (A) Taxotere and (B) Acetonitrile solvent formulations, calculated from equation (ii) (mean ± SD, N=3).
For the final phase of method evaluation, we evaluated drug release from a controlled release DTX prodrug nanomicellar formulation, Procet 8. For information on synthesis and characterization of the Procet 8 nanomicelle please refer to Stern et al., 2013 [9]. This prodrug is a cholesterol ester of DTX that is rapidly hydrolyzed to DTX when released from the polymeric micelle. Unfortunately, preparation of plasma containing the prodrug micelle for LC-MS analysis (i.e., organic solvent deproteination) results in micelle disruption and artifactual hydrolysis of the prodrug that contaminates actual DTX concentrations and precludes direct DTX analysis of pharmacokinetic samples [9]. This artifactual prodrug release and hydrolysis resulting from sample preparation was estimated to be less than 10%, and while this is an issue for analysis of pharmacokinetic samples due to very low actual DTX concentrations, this is less of a concern for in vitro drug release incubations in which the <10 % release represents a relatively minor source of error.
This is important because it allows us to compare direct measurement of DTX concentration in Procet 8 plasma incubations, which as explained is a measure of the prodrug release from the nanomicelle, with the stable isotope dilution method calculated docetaxel concentration. Therefore, the DTX concentration measured directly without fractionation is an accurate estimate of unencapsulated drug that can be compared to the method calculated value to determine accuracy of the drug release assay. If the stable isotope method is accurate, then the direct measurement of DTX should only vary from the method calculated value by a small fraction of the remaining prodrug represented by the sample processing artifact (i.e., less than 10% of the remaining prodrug micelle).
The Procet 8 nanomicelle was incubated for 24 h in rat plasma at three separate concentrations, 10, 50 and 100 μg/mL of Procet 8, corresponding to 6.4, 32 and 64 μg/mL of DTX equivalents, respectively (Procet 8 prodrug is 64% docetaxel by weight). Rat plasma was used for this phase of the evaluation, as previous metabolism and pharmacokinetic studies of Procet 8 were conducted in the rat [9]. Identical to the studies in human plasma above, differences in protein binding between the DTX and the deuterated stable isotope DTX-d5 were not observed in rat plasma (data not shown). Using the stable isotope assay, we calculated a similar rate of prodrug release and conversion at all nanomicelle concentrations, with ~50% DTX release at the 24 h time point (Fig. 5). The coefficient of variation for all time points and concentrations was less than 10%, consistent with the precision seen for the human plasma studies above. Samples processed twice by the ultrafiltration method gave identical results, supporting the fact that the fractionation method itself did not result in artifactual release of prodrug from the micelle and contamination of the free DTX concentration (Fig. 6). Free DTX spike recovery in incubated Procet 8 nanomicelle plasma samples was within 15% of theoretical (Fig. 6).
Fig. 5.
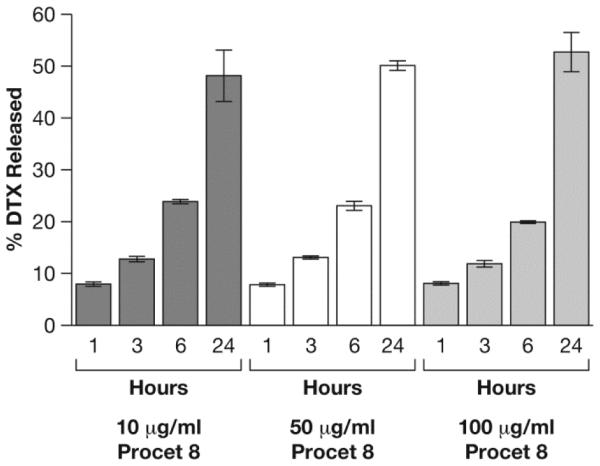
Drug release from Procet 8 in rat plasma. Displayed are the % released docetaxel (DTX) for each concentration and time point, calculated from equation (ii) (mean ± SD, N=3).
Fig. 6.
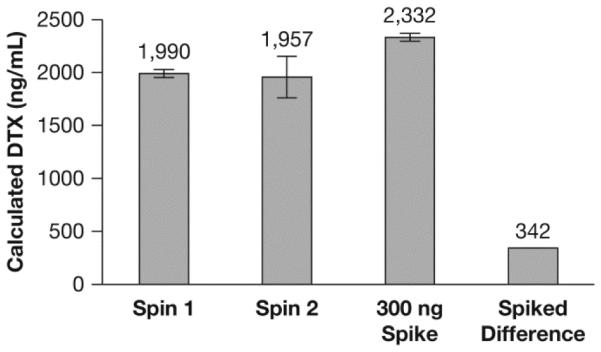
Method control studies. Displayed are the released docetaxel (DTX) concentrations calculated from equation (ii), for a 10 μg/mL Procet 8 plasma sample, incubated for 6 h and centrifuged once or twice (spin 1 and spin 2, respectively), or spiked with 300 ng of docetaxel and centrifuged only once. The “spiked difference” was calculated as the difference between the spiked and non-spiked samples that were centrifuged only once (mean ± SD, N=3).
As discussed above, the instability of the unencapsulated Procet 8 prodrug allowed us to compare the direct measurement of DTX release with our method calculated DTX release. As expected, due to minor micelle disruption during sample deproteination, the docetaxel concentrations from direct measurement without fractionation are slightly higher than that of the method calculated values at early time points, due to the large fraction of prodrug micelle remaining. Regardless, the measured and method calculated values were highly correlated, with an R2 value of 0.98, and nearly identical, with the dashed 45 degree line through the origin of the correlation plot representing absolute agreement (Fig. 7).
Fig. 7.

Correlation plot of measured versus method calculated docetaxel concentrations. Displayed are the mean measured versus calculated DTX concentrations for all time points and concentrations (mean, N=3).
Conclusion
At every stage of this method evaluation, the stable isotope tracer is shown to behave identically to unencapsulated normoisotopic drug, and provide an accurate estimate of drug free fraction. In protein binding comparison studies, the protein binding of a constant 0.5 ug/mL spiked concentration of stable isotope varies identically to that of changing concentrations of the normoisotopic drug (Fig. 2). This could only be the case if indeed the stable isotope acts as a tracer of total (normoisotopic and stable isotope) protein binding. Further, the method calculated DTX concentrations are identical to theoretical DTX concentrations for this protein binding comparison study (Fig. 3). Again, this could only be the case if the tracer behaved identically to normoisotopic drug with regard to protein binding.
For the fast release formulations, Taxotere and solvent solubilized DTX, the total amount of drug that could be released from the formualtions was known, because a predetermined amount of each formulation was added to the plasma. This allowed us to determine both the accuracy deviation (deviation from 100% release) and precision of the assay, which was found to be <15%. As in the protein binding studies described above, if the tracer was not able to accurately account for protein and formulation binding of the normoisotopic drug, the method would not have such high accuracy and precision.
The reason that the DTX prodrug nanomicellar formulation, Procet 8, was used to validate this method was because the unencapsulated prodrug is not stable in plasma; unencapsulated prodrug is rapidly hydrolyzed to free DTX. Therefore released prodrug can be measured directly as DTX, and the unencapsulated drug is known. This allowed us to compare direct measurement of DTX to the method calculated DTX values to determine method accuracy. Indeed, the measured DTX values were highly correlated with the method calculated values for these Procet 8 release studies. Further, the release profile across a range of Procet 8 concentrations (10-100 ug/mL) was identical. The high correlation and similar release profiles strongly support the fact that the stable isotope tracer is a very accurate measure of normoisotopic free drug fraction, and behaves identically to free normoisotopic drug with respect to protein and formulation binding. Lastly, the method was able to accurately determine the amount free DTX spiked into the Procet 8 formulation, within 15% of theoretical (Fig. 6). This of course would not be possible if the stable isotope method was not highly accurate.
The stable isotope method described in this manuscript overcomes many of the liabilities of previous fractionation methods, which have included the use of non-physiological and non-equilibrium conditions, potential for process induced artifacts, and most importantly for ultrafiltration methods, the inability to account for formulation effects on drug free fraction [3]. This method is a valuable addition to the current techniques for quantitation of nanomedicine encapsulated and unencapsulated drug fractions in biological matrix, and has already been applied by our laboratory to the characterization of a variety of formulation types including nanoliposomes, polymeric nanoparticles and nanomicellar formulations. Future applications for this method will include evaluation of clinical and preclinical samples from nanomedicine phamacokinetic studies. This method will aid in accurate free drug and encapsulated drug exposure assessment, and development of pharmacokinetic-pharmacodynamic models. We believe this method will also have tremendous utility in regulatory evaluation of nanomedicines, and aid in determination of generic nanomedicine bioequivalence.
Acknowledgments
The authors thank Celator Pharmaceuticals, Inc. for generously providing the Procet 8 nanomicellar formulation, and Dr. Rachael M. Crist for assistance with the preparation of the manuscript. This project has been funded in whole or in part with federal funds from the National Cancer Institute, National Institutes of Health, under contract HHSN261200800001E. The content of this publication does not necessarily reflect the views or policies of the Department of Health and Human Services, nor does mention of trade names, commercial products, or organizations imply endorsement by the U.S. Government.
Footnotes
Publisher's Disclaimer: This is a PDF file of an unedited manuscript that has been accepted for publication. As a service to our customers we are providing this early version of the manuscript. The manuscript will undergo copyediting, typesetting, and review of the resulting proof before it is published in its final citable form. Please note that during the production process errors may be discovered which could affect the content, and all legal disclaimers that apply to the journal pertain.
Author Contributions
S.S. performed bioanalytical analysis. S.E.M. provided project oversight. S.T.S. conceived the method, developed the project, performed data analysis and provided project oversight.
References
- [1].Zolnik BS, Stern ST, Kaiser JM, Heakal Y, Clogston JD, Kester M, McNeil SE. Rapid distribution of liposomal short-chain ceramide in vitro and in vivo. Drug metabolism and disposition: the biological fate of chemicals. 2008;36:1709–1715. doi: 10.1124/dmd.107.019679. [DOI] [PubMed] [Google Scholar]
- [2].Stern ST, Hall JB, Yu LL, Wood LJ, Paciotti GF, Tamarkin L, Long SE, McNeil SE. Translational considerations for cancer nanomedicine. J Control Release. 2010;146:164–174. doi: 10.1016/j.jconrel.2010.04.008. [DOI] [PMC free article] [PubMed] [Google Scholar]
- [3].Ambardekar VV, Stern ST. NBCD Pharmacokinetics and Drug Release Methods. In: Crommelin DJA, de Vlieger JSB, editors. Non-Biological Complex Drugs; The Science and the Regulatory Landscape. Springer International Publishing; 2015. pp. 261–287. [Google Scholar]
- [4].Thies RL, Cowens DW, Cullis PR, Bally MB, Mayer LD. Method for rapid separation of liposome-associated doxorubicin from free doxorubicin in plasma. Analytical biochemistry. 1990;188:65–71. doi: 10.1016/0003-2697(90)90528-h. [DOI] [PubMed] [Google Scholar]
- [5].Wallace SJ, Li J, Nation RL, Boyd BJ. Drug release from nanomedicines: Selection of appropriate encapsulation and release methodology. Drug delivery and translational research. 2012;2:284–292. doi: 10.1007/s13346-012-0064-4. [DOI] [PMC free article] [PubMed] [Google Scholar]
- [6].Bekersky I, Fielding RM, Dressler DE, Lee JW, Buell DN, Walsh TJ. Plasma protein binding of amphotericin B and pharmacokinetics of bound versus unbound amphotericin B after administration of intravenous liposomal amphotericin B (AmBisome) and amphotericin B deoxycholate. Antimicrobial agents and chemotherapy. 2002;46:834–840. doi: 10.1128/AAC.46.3.834-840.2002. [DOI] [PMC free article] [PubMed] [Google Scholar]
- [7].ten Tije AJ, Verweij J, Loos WJ, Sparreboom A. Pharmacological effects of formulation vehicles : implications for cancer chemotherapy. Clinical pharmacokinetics. 2003;42:665–685. doi: 10.2165/00003088-200342070-00005. [DOI] [PubMed] [Google Scholar]
- [8].Gardner ER, Dahut WL, Scripture CD, Jones J, Aragon-Ching JB, Desai N, Hawkins MJ, Sparreboom A, Figg WD. Randomized crossover pharmacokinetic study of solvent-based paclitaxel and nab-paclitaxel. Clinical cancer research : an official journal of the American Association for Cancer Research. 2008;14:4200–4205. doi: 10.1158/1078-0432.CCR-07-4592. [DOI] [PMC free article] [PubMed] [Google Scholar]
- [9].Stern ST, Zou P, Skoczen S, Xie S, Liboiron B, Harasym T, Tardi P, Mayer LD, McNeil SE. Prediction of Nanoparticle Prodrug Metabolism by Pharmacokinetic Modeling of Biliary Excretion. J Control Release. 2013;172:558–567. doi: 10.1016/j.jconrel.2013.04.025. [DOI] [PMC free article] [PubMed] [Google Scholar]


