

With a technical failure rate of less than 5.6%, the use of hepatic MR elastography to assess changes in liver tissue mechanics, which are associated with many pathophysiologic factors, may yield important information regarding staging of liver disease without invasive biopsy.
Abstract
Purpose
To assess the technical success rate and diagnostic performance of liver magnetic resonance (MR) elastography.
Materials and Methods
This retrospective study was approved by the institutional review board with patient informed consent. A total of 1377 consecutive MR elastography examinations performed between 2007 and 2010 in 1287 patients for clinical indications were included. Medical records were used to retrieve liver stiffness as assessed with MR elastography, histologic analysis, blood work, and other liver disease–related information. Nonparametric Kruskal-Wallis tests and analysis of covariance methods were used to evaluate the diagnostic values and relationships of the collected data.
Results
Hepatic MR elastography had a success rate of 94.4% (1300 of 1377 cases) and yielded reproducible measurements (r = 0.9716, P < .0001) in the study cohort, with a complex patient profile and multiple interpreters. Body mass index had no significant effect on success rate (P = .2). In 289 patients who underwent liver biopsy within 1 year of the MR elastography date, mean liver stiffness as assessed with MR elastography was significantly higher in patients with advanced fibrosis (stages F3, F4) than in those with mild to moderate fibrosis (stages F0, F1, F2) (5.93 kPa ± 2.31 [standard deviation] vs 3.35 kPa ± 1.44, P < .0001). Liver stiffness is associated with many factors other than fibrosis extent, including cause of fibrosis (viral hepatitis C vs nonalcoholic fatty liver disease, P = .025), inflammation (severe vs mild to moderate, P = .03), and hepatic metabolic and synthetic function (no fibrosis vs intermediate fibrosis, P ≤ .01).
Conclusion
In a general clinical practice environment, hepatic MR elastography is a robust imaging method with a high success rate in a broad spectrum of patients. It also shows the complex association between liver stiffness and hepatic pathophysiology.
© RSNA, 2015
Introduction
Chronic liver disease is a major public health problem worldwide. It encompasses many different causes, including viral infections, nonalcoholic fatty liver disease (NAFLD), alcohol abuse, primary sclerosing cholangitis, hereditary hemochromatosis, and autoimmune disease (1). All of these chronic liver diseases cause damage to the liver via necroinflammation and activation of hepatic stellate cells, leading to the dynamic process of fibrogenesis and finally the accumulation of extracellular matrix protein (2,3). This results in distortion of the hepatic architecture from hepatic fibrosis. Without treatment, the subsequent development of cirrhosis (the end stage of fibrosis) can lead to hepatocellular dysfunction and increased intrahepatic resistance to blood flow. This eventually results in hepatic insufficiency, portal hypertension, and an increased risk of developing hepatocellular carcinoma, leading to increased resource use, morbidity, and mortality (4).
Hepatic fibrosis has been shown to be a bidirectional process. Increasingly, data from laboratory and clinical studies reveal that early fibrosis is potentially reversible (5,6). Unfortunately, the translation of basic research into improved therapy for patients with chronic liver diseases is still underdeveloped. This is partly because the foundations of hepatology were built on histologic assessment of liver tissue; thus, percutaneous biopsy has been the bedrock for the diagnosis and staging of fibrosis. Although liver biopsy is considered a reference standard in liver fibrosis measurement, it is poorly suited for frequent monitoring because it is an invasive and expensive procedure, there are risks of complication and poor patient tolerance, and its accuracy also suffers from subjective interpretation and sampling errors (7,8). In contrast, a reliable noninvasive imaging method capable of longitudinal assessment of the diseased liver would provide valuable clinical information to direct emerging therapeutic interventions designed to slow or halt the progression to end-stage liver disease.
The cirrhotic liver can be well visualized with conventional magnetic resonance (MR) imaging, as well as with ultrasonography (US) and computed tomography (CT), because of morphologic alterations and other extrahepatic findings, such as splenomegaly, portosystemic varices, and ascites. However, these conventional imaging techniques have proved to be relatively insensitive in the diagnosis of mild to moderate fibrosis associated with chronic liver diseases. Specialized US and MR imaging techniques, including Doppler and contrast material–enhanced methods (9), diffusion-weighted imaging (10), perfusion imaging (11), spectroscopy (12,13), and functional imaging (14,15) show some promise, but a number of issues must be settled before these methods can be effectively translated into clinical practice. Multiple investigations have shown that liver stiffness measured with US-based transient elastography (16,17) and MR elastography (18,19) can be used in fibrosis staging (18,20,21). Given the rapid expansion of hepatic MR elastography in clinical use, there is a need to ensure adequate quality control for MR elastography acquisitions to ensure that results are reproducible (22,23) and reliable, as well as to identify root causes for unacceptable results. The purpose of this study was to assess the technical success rate and diagnostic performance of liver MR elastography in a retrospective study of clinical patients.
Materials and Methods
The Mayo Clinic and several authors (M.Y., K.J.G., J.C., A.M., and R.L.E.) have intellectual property rights and a financial interest through receipt of royalties and equity for licensing of MR elastography technology. One author (R.L.E.) serves as the president, chief executive officer, and chief financial oficer of Resoundant (Rochester, Minn). This research was approved and conducted in compliance with oversight by the Mayo Clinic conflict of interest review board. For this investigation, we performed a retrospective study in which we reviewed the medical records of patients who had already undergone MR elastography and who had provided research authorization to collect data for the purpose of producing scholarly work. We reviewed data from 1377 consecutive research-authorized examinations performed between January 2007 and May 2010. Fifty-eight of the 72 patients with NAFLD or nonalcoholic steatohepatitis (NASH) who underwent liver biopsy less than 90 days from the date of MR elastography were studied in detail by Chen et al (24). In our study, all data studied were retrieved from medical records (including MR elastography readings from on-site diagnostic radiologists) to maintain generalizability; however, in the Chen et al study, all of the original data and specimens were reanalyzed by one interpreter to minimize interobserver variability.
MR Elastography Examination
At our institution, we perform 400–500 liver MR elastography examinations per year. These examinations are ordered clinically by more than 10 physician providers, performed by one of 14 MR technicians using one of seven 1.5- or 3.0-T clinical imagers (GE Healthcare, Milwaukee, Wis), and interpreted by one of five on-site diagnostic radiologists across our institution. Details of the hepatic MR elastography examination set-up (18,22), imaging parameters (18), elastographic image processing (25,26), and stiffness measuring methods (24,27,28) have been described in many previous publications. A summary of the imaging protocol is included in Appendix E1 (online).
Technical Quality Review
During this time period, all cases were also reviewed on a weekly basis at a group meeting with all authors to provide another set of liver stiffness measurements and additional expert opinions on image quality and region of interest validity. A summary of the review protocol is included in Appendix E1 (online). The technical success rate was determined, and the number of technical failures was counted each year.
Data Collection
Besides diagnostic information, we collected the following data from the medical records: (a) original MR elastography imaging data and liver stiffness (provided by the diagnostic radiologist on duty that day without any retrospective change unless the case was considered a technical failure by group consensus [n = 27], in which case it was omitted from data analysis), (b) histologic analysis of results of the liver biopsy sample obtained closest to the MR elastography examination date (extracted from the clinical pathology report, including fibrosis stage and inflammation grade scored with the Metavir system [29,30] or Brunt classification [31] when appropriate), (c) blood pressure measurements (mean blood pressure was calculated by averaging systolic and diastolic blood pressures obtained within 1 month of MR elastography) and serum marker results obtained closest to the MR elastography examination date, and (d) general information about patient sex, age, and body mass index (BMI) at the time of MR elastography (a patient with multiple MR elastography examinations could have different BMI values due to disease progress or treatment).
Examination Performance
Liver stiffness, as assessed with MR elastography, may have influenced clinical decision making in patients with chronic liver disease and may have affected how and when liver biopsies were performed in these patients. This may have resulted in a bias in histologic interpretations. Thus, we performed analyses on several subgroups of patients grouped by using a posteriori criteria. Figure 1 shows a flowchart of the patient categories and the intervals used in this study for all 1377 examinations (1287 patients in total, 68 patients underwent more than one MR elastography examination). In all the subgroups, for patients with multiple MR elastography examinations, only the result from the MR elastography examination performed closest to the liver biopsy date was used.
Figure 1:

Flowchart of our retrospective study design shows the approach we used to divide our study cohort into several subgroups to retrospectively evaluate the diagnostic performance of MR elastography (MRE).
Statistical Analysis
To assess reproducibility of the liver stiffness measurement, regression analysis was performed in the technically adequate cases to evaluate the correlation between the two sets of valid liver stiffness measurements from the on-site diagnostic radiologists and from the expert review panel (M.Y., K.J.G., J.A.T., J.C., A.M., R.L.E.). Only on-site readings without technical failures were used for further analysis to maintain generalizability. The Welch t test was used to analyze the effect of BMI on successful and unsuccessful MR elastography examinations. Statistical analysis was then limited to the 289 subjects who underwent liver biopsy within 1 year of MR elastography (mean, 54 days ± 113; median, 32 days; 10%, 25%, 75%, and 90% quartiles were −27, −6, 96, and 228 days, respectively). A summary of the statistical analyses for each subgroup is included in Appendix E1 (online). In brief, statistical differences between each stage, grade, sex, and disease origin pair used nonparametric Kruskal-Wallis tests with the Dunn all-pairs method with joint ranking, which computed ranks for all the data, not just the pair being compared. The reported P value, which is multiplied by the number of comparisons, reflects a Bonferroni adjustment. The effect of multiple pathophysiologic factors in the progression of fibrosis was assessed with analysis of covariance with generalized linear regression. Power analyses were assessed with F tests for nonsignificant differences observed with analysis of covariance.
The significance level was .05 for all testing, including Bonferroni-adjusted P values in multiple comparisons. All statistical analyses were performed by using JMP software (version 10.0.0; SAS Institute, Cary, NC).
Results
Of the 1377 records, 1300 (94.4%) included technically adequate MR elastography studies. A total of 44 (3.4%) of the 1287 patients examined had technically inadequate MR elastography studies all the time; in 36 (3.0%) of the 1287 patients, this was due to an iron overload issue. In 68 patients who underwent multiple MR elastography examinations (range, two to six examinations), 62 had at least one successful examination. Of those successful examinations, 624 (48.0%) of 1300 records were from female patients. The average age of female and male patients was 54.2 years ± 14.1 (standard deviation) and 55.6 years ± 13.4, respectively. The average BMI was 30.3 kg/m2 ± 8.0 (range, 15.9–61.3 kg/m2) in female patients and 29.5 kg/m2 ± 5.9 (range, 16.2–50.6 kg/m2) in male patients. For the different sexes, there is a significant difference in mean BMI (P = .049) but no significant difference in mean age (P = .076). For the entire cohort, average patient age was 54.9 years ± 13.8 and mean BMI was 29.9 kg/m2 ± 7.0 (range, 15.9–61.3 kg/m2).
NAFLD or NASH and chronic hepatitis C (HCV) were the two major primary liver diseases that prompted referral for MR elastography (Table 1).
Table 1.
Clinical Indications of Liver MR Elastography Examinations

Figure 2 shows the liver stiffness distribution for the 1300 examinations has a broad left-skewed distribution with a mean value of 4.12 kPa ± 2.22 (median, 3.38 kPa; range, 1.1–18.8 kPa). Twenty-seven examinations from the on-site readings were considered invalid due to technical failures by the expert review panel. The other 1300 pairs of valid readings show good correlation between the on-site and expert review measurements (r = 0.9716, P < .0001).
Figure 2:

Graph shows distribution and reliability of MR elastography–assessed liver stiffness in 1300 successful examinations. Liver stiffness has a left-skewed broad distribution from 1.1 to 18.8 kPa, with a mean stiffness of 4.12 kPa and a median stiffness of 3.38 kPa. There is good correlation between the on-site radiologists’ readings and the expert reviewers’ readings (r = .9716, P < .0001).
There was no significant difference in mean BMI between the successful and unsuccessful groups (P = .2, Fig 3). The range of BMI in the successful examinations (range, 10.0–61.4 kg/m2) was greater than that in failed ones (range, 17.9–44.4 kg/m2). Even for the subject with the highest BMI (weight, 159 kg; height, 161 cm; BMI = 61.4 kg/m2), shear waves were present throughout the majority of the liver (Fig 4), in spite of the fact that this patient had 5–8 cm of subcutaneous fat around the chest wall. The mean liver stiffness in this subject was 3.12 kPa.
Figure 3:

Graph shows patient BMI effect on the technical success rate of liver MR elastography (MRE). The BMI distribution in patients with successful liver MR elastography examinations is shown with white bars (25% and 75% quantiles, 24.9 and 33.9 kg/m2, respectively; median, 28.9 kg/m2; mean, 29.9 kg/m2), while BMI distribution in patients with unsuccessful liver MR elastography examinations is shown with pink bars (25% and 75% quantiles, 24.6 and 32.0 kg/m2, respectively; median, 28.3 kg/m2; mean, 28.8 kg/m2). The minimum, mean, and maximum BMI values for successful and unsuccessful liver MR elastography examinations are listed in the inset table. Similar distributions of BMI were observed for both successful and unsuccessful liver MR elastography examinations.
Figure 4:

A, MR in-phase anatomic image; B, MR elastography wave image; and, C, calculated elastogram in a 60-year-old woman with NASH and a BMI of 61 kg/m2. Shear waves penetrated the 5–8-cm-thick subcutaneous fat over the patient’s chest wall, then propagated through one-third of the liver with acceptable wave amplitude for stiffness calculation.
A total of 77 (5.6%) of 1377 cases had technical failures. Fifty-five of these cases had an inadequate signal-to-noise ratio due to iron overload. The remaining 22 failures were due to the entire absence of waves on MR elastography wave images, which was most likely due to execution errors (n = 12), software glitches (n = 7), and respiratory artifacts (n = 3) (Appendix E1 [online]).
Patients with advanced fibrosis (stages F3 and F4) had significantly higher liver stiffness values than did those with mild to moderate fibrosis (stages F0, F1, and F2) both for multiple comparisons (Table 2) and for a single comparison between the two combined groups (stages F3 and F4 vs stages F0, F1, and F2: 5.93 kPa ± 2.31 vs 3.35 kPa ± 1.44; P < .0001). However, there were no significant differences when we compared stage F0 fibrosis with stage F1 fibrosis, stage F1 fibrosis with stage F2 fibrosis, stage F0 fibrosis with stage F2 fibrosis, and stage F3 fibrosis with stage F4 fibrosis (Table 2). For both male and female groups, mean liver stiffness increased progressively with fibrosis extent. We did not find significant differences in mean liver stiffness between male and female patients at any fibrosis stage (Table 2). Analysis of covariance in the male and female groups resulted in no significant effect of sex on the correlation between fibrosis stage and logarithmic stiffness value (P = .3, effect size = 0.03, power = 0.06), as shown in Figure 5.
Table 2.
Mean Liver Stiffness Measurements, Standard Deviations, 95% Confidence Intervals, and P Values in 289 Patients with Liver Biopsy within 1 Year of MR Elastography
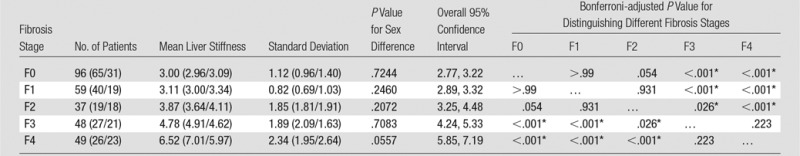
Note.—Data in parentheses are for women and men, respectively.
Figure 5:

Graph shows effect of sex on MR elastography–assessed liver stiffness. No significant differences were found between men and women for each fibrosis stage (P > .05 for all fibrosis stages). Exponential curve fitting results show the relationship between logarithmic liver stiffness and fibrosis stage in female (dashed line) and male (solid line) patients. Mean liver stiffness and the corresponding standard deviation for each fibrosis stage and sex is shown in the text and error bars. There was no significant effect of sex on the correlation between fibrosis stage and logarithmic stiffness (P = .3).
In the analysis of the 239 patients who had not undergone treatment before MR elastography examination or liver biopsy (Fig 6), patients with a higher inflammation grade of 3 had a significantly higher mean liver stiffness value than did patients with a lower inflammation grade of 1 or 2 (P = .03). At the end stage of fibrosis (stage F4), the inflammation grade did not have a significant effect on liver stiffness (P = .95, effect size = 0.21, power = 0.06). For patients without fibrosis (stage F0), we obtained a mean liver stiffness of 3.07 kPa ± 1.30 in 56 patients without inflammation and 2.92 kPa ± 0.63 in 22 patients with grade 1 inflammation. We did not find a significant effect of inflammation on liver stiffness (P = .71, effect size = 0.10, power = 0.10).
Figure 6:

Graph shows the effect of hepatic inflammation on liver stiffness. Mean liver stiffness and the corresponding standard deviation (SD) for different fibrosis stages (F1, F2, F3, and F4) and inflammation grades (I1, I2, I3) are shown in the inset table and by the color-coded dots and error bars (standard deviation). F0 fibrosis was omitted because of an overlap with a previous publication. I4 inflammation also was omitted because data were available in only one patient. The inflammation grade is slightly offset from values in the horizontal axis to allow for visualization of overlapping error bars. Both fibrosis and inflammation cause liver stiffness augmentation, which was seen in patients without treatment before MR elastography and liver biopsy.
In the 158 patients with untreated chronic liver disease who underwent biopsy within a year and in whom blood analysis was performed within 30 days of MR elastography, we found that patients with intermediate fibrosis (stage F1–F3) and liver stiffness (3.5–5.0 kPa) had significantly elevated alanine aminotransferase (stage F1–F3 vs stage F0, P < .001) and aspartate aminotransferase (stage F1–F3 vs stage F0, P = .0102) values, while patients with advanced fibrosis or cirrhosis did not have significantly elevated alanine aminotransferase values (stage F4 vs stage F0, P = .28). We also observed that patients with advanced fibrosis or cirrhosis and a liver stiffness higher than 6 kPa were prone to have a decreased albumin value and an increased total bilirubin value (Fig 7). For the albumin value, significant differences were found between only stages F0, F1, F2, and F4 (P = .007, P = .007, and P = .004, respectively). For total bilirubin value, a significant difference was found only between stages F0 and F4 (P = .048).
Figure 7:

Graphs show serum marker values in patients with varying degrees of liver fibrosis. Patients with intermediate liver fibrosis (stage F1–F3) and liver stiffness (3.5–5.0 kPa) had the highest alanine aminotransferase (ALT) and aspartate aminotransferase (AST) values when compared with patients with advanced fibrosis. Patients with advanced liver fibrosis (stage F4) and liver stiffness higher than 6.0 kPa had a decreased albumin value and an increased total bilirubin value when compared with patients with early fibrosis.
As shown in Figure 8, it was found that the strongest degree of inflammation was typically detected in patients with liver stiffness greater than 3.5 kPa and mean blood pressure greater than 92 mmHg. However, no significant difference in mean blood pressure measurement was found between different fibrosis stages (P = .53, power = 0.24) or inflammation grades (P = .54, power = 0.39) with analysis of covariance. No significant correlation was found between mean blood pressure and liver stiffness (R2 = 0.016, P = .21).
Figure 8:

Graphs show mean blood pressure measurements in patients with varying degrees of hepatic fibrosis and inflammation. No significant correlations were found between mean blood pressure, liver stiffness, and fibrosis stage. The most significant amount of inflammation was observed in patients with liver stiffness greater than 3.5 kPa and mean blood pressure greater than 92 mmHg.
There were 72 patients with NAFLD or NASH and 18 with HCV in the previous patient pool, as shown in Table 3. For each fibrosis stage, the HCV group had a lower mean liver stiffness value than did the NAFLD or NASH group (Fig 9). However, there were no significant differences in mean liver stiffness for each fibrosis stage between the two different disease origins (P > .1 for all).
Table 3.
Liver Stiffness as Assessed with MR Elastography in 72 Patients with Untreated NAFLD or NASH and 18 Patients with Untreated HCV with Varying Degrees of Biopsy-proven Hepatic Fibrosis
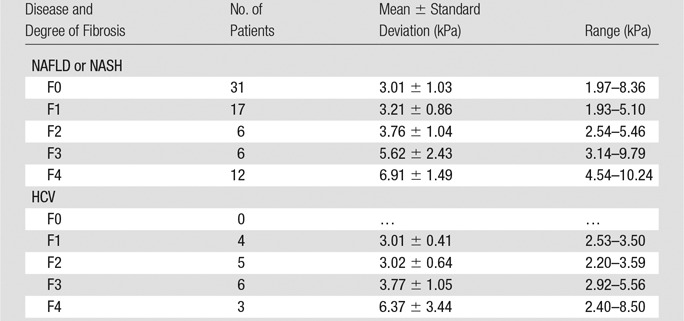
Figure 9:

Graph shows exponential regression results in patients with NAFLD and HCV. There were no significant differences in mean liver stiffness for each fibrosis stage between the two different diseases (P > .1 for all). However, both fibrosis stage and disease have significant effects on liver stiffness measurements (P < .0001 for fibrosis stage; P = .0252 for disease).
Both fibrosis stage and disease origin have significant effects on liver stiffness measurements (P < .0001 for fibrosis stage; P = .0252 for disease origin). BMI did not show a significant correlation with liver stiffness at any stage of fibrosis or inflammation in the patients with NAFLD or NASH (linear regression, P = .28).
Discussion
Our results show that in routine clinical use, hepatic MR elastography had a 5.6% failure rate, with most failures being caused by low signal-to-noise ratio due to iron overload of the liver tissue. The low signal in iron-overloaded livers at standard gradient-echo MR elastography is a result of the long echo time (about 21 msec) compared with the short T2* of iron-overloaded tissue (32). Alternative designs of the gradient-echo MR elastography sequence can result in shorter echo times and would likely improve the performance of gradient-echo MR elastography in patients with iron overload (33). Another approach is to use a spin-echo MR elastography sequence, in which signal is dependent on T2 rather T2* decay (34–36), although that technique has its own limitations. For patients who cannot hold their breath, a respiratory-gated MR elastography sequence could be used; however, the acquisition time may be substantially longer (37).
For livers severely overloaded with iron, MR elastography may not able to detect sufficient signal from the liver for reliable elastographic calculation. Transient elastography, another clinically widespread elastographic technique, would be a reasonable alternative method with which to assess tissue stiffness (38–40). However, transient elastography has several technical challenges of its own, including being limited to imaging between narrow intercostal spaces, having a limited penetration depth, and only providing one-dimensional measurements of a wave field with potential wave diffraction or interference effects (41,42), a 3%–5% technical failure rate, and a 15% incidence of unreliable measurements (43,44). Even with the XL probe (Echosens, Paris, France) designed specifically for obese patients, reliable liver stiffness measurements can be obtained in only 75%–80% of the overall population and in only 57%–65% of patients with a BMI of more than 30 kg/m2 (45,46). Additionally, different liver stiffness cutoff values for patients with different BMI and different probes (M or XL) need to be used to solve the discordance observed between biopsy and liver stiffness measurements in obese patients with elevated liver stiffness (47,48). Our results indicate that patient size was not a significant factor in failed MR elastography examinations.
Liver stiffness in healthy subjects may vary by sex, as many investigators have observed differences when using transient elastography. In one study of 429 consecutive healthy subjects, liver stiffness values were higher in men than in women (Young modulus, 5.81 kPa ± 1.54 vs 5.23 kPa ± 1.59; P < .001) (49). However, with MR elastography, no significant sex difference was found in a reliability study involving 49 healthy subjects (50) or in our study. The failure to observe differences between the sexes could also be associated with the high incidence of technical failures in patients with an iron-overloaded liver; these failures occur more frequently in men than in women (51).
Many investigations have shown that both inflammation and fibrosis can cause a significant increase in liver stiffness as assessed with MR elastography (24,52,53). We did not have sufficient power to observe any significant difference in stiffness values due to inflammation at fibrosis stages F0 or F4 in our study. A subset of these patients, who had NAFLD or NASH and who underwent MR elastography within 90 days of liver biopsy, were studied in detail by Chen et al (24). In patients with NAFLD or NASH but without fibrosis, Chen et al obtained mean liver stiffness measurements of 2.51 kPa in 22 patients without inflammation and of 3.24 kPa in seven patients with an inflammation grade of no less than 1. For patients with liver disease and a similar fibrosis extent between F1 and F3, patients with grade 3 inflammation had significantly higher liver stiffness than did those with grade 1 or 2 inflammation. This is easy to understand, since inflamed or edematous tissue can increase tissue tension (54), which will cause extra stretching of the hepatic stellate cells. This can further exacerbate liver disease by activating hepatic stellate cells to transdifferentiate to myofibroblasts (55,56). Unfortunately, MR elastography can only depict the early onset of hepatic inflammation before extracellular matrix remodeling (ie, fibrosis deposition) (24,53). Currently, it cannot be used to distinguish coexisting hepatic inflammation and fibrosis independently in patients with chronic liver diseases.
Discrepancies in the optimal stiffness cutoff values among groups with different causes of cirrhosis have been observed (57–59). However, our sample size was not sufficient to detect significant variation in the liver stiffness between different causes of NAFLD or NASH and HCV.
Multiple investigations have shown that liver stiffness can be used in fibrosis staging. There are also many investigations that have cross-validated the hepatic stiffness measurements obtained with different imaging modalities (60–62). When compared with US-based techniques, such as transient elastography, acoustic radiation force impulse (63,64), or shear-wave dispersion US vibrometry (65), hepatic MR elastography has the added advantage of enabling one to evaluate the entire liver if the examination is extended to a large-volume three-dimensional acquisition, such as using three-dimensional MR elastography techniques (66,67) and automated analysis (28), potentially enabling a more accurate assessment of disease severity in cases in which fibrosis is not uniform across the entire organ.
One important limitation of this study is that our clinical liver MR elastography examinations could have interscanner, interoperator, or interobserver variability. Even though each individual component may not lead to significant differences in cross-validation studies (22,68), the superposition of these compounding factors may have weakened the overall diagnostic performance in this study when compared with other studies in the literature. It is also recognized that current tissue stiffness measurements are not capable of replacing liver biopsy to distinguish more information than fibrosis staging, including cellularity, inflammation, degree of fatty change, and cholestasis. Rather, as data and experience accumulate over time, tissue stiffness likely will become a fundamental indicator of liver health and disease in its own right.
In conclusion, in our series MR elastography had a technical failure rate (most commonly from inadequate magnitude signal due to iron overload and the entire absence of waves due to disconnection of the acoustic driver) of less than 5.6%. The use of hepatic MR elastography to assess changes in liver tissue mechanics, which are associated with many pathophysiologic factors, may provide important information regarding staging of liver disease without invasive biopsy.
Advances in Knowledge
■ In a general clinical practice environment, liver MR elastography is a robust imaging method used in a broad spectrum of patients, and it has a technical failure rate of less than 5.6% (77 of 1377 cases).
■ Technical failures were the result of inadequate magnitude signal due to iron overload (71%, 55 of 77 cases) and the entire absence of waves, which was most likely due to the disconnection of the acoustic driver (29%, 22 of 77 cases).
Implications for Patient Care
■ Liver MR elastography has a high technical success rate, and causes of liver MR elastography technical failure are distinct from those of US-based elastography techniques (obesity, ascites, and narrow intercostal space); thus, liver MR elastography is a robust complimentary technique with which to assess liver fibrosis.
■ The interpretation of hepatic stiffness by using MR elastography to assess fibrotic changes in liver tissue must also acknowledge that hepatic stiffness changes are also associated with disease origin, inflammation, blood pressure, hepatic metabolic function, and hepatic synthetic function.
■ Liver MR elastography has the potential to provide new insights into understanding the continuum of hepatic diseases.
APPENDIX
SUPPLEMENTAL FIGURE
Received September 6, 2014; revision requested October 16; revision received March 30, 2015; accepted April 9; final version accepted May 1.
Funding: This research was supported by the National Institutes of Health (grants EB001981 and EB017197).
Disclosures of Conflicts of Interest: M.Y. Activities related to the present article: disclosed no relevant relationships. Activities not related to the present article: received royalties from and holds stock options in Resoundant. Other relationships: has intellectual property rights and a financial interest in MR elastography technology. K.J.G. Activities related to the present article: disclosed no relevant relationships. Activities not related to the present article: holds patents related to the technology used in this research, receives royalties from the licensing of technology used in this research, holds stock options in Resoundant. Other relationships: disclosed no relevant relationships. J.A.T. disclosed no relevant relationships. J.C. Activities related to the present article: disclosed no relevant relationships. Activities not related to the present article: received royalties from and holds stock options in Resoundant. Other relationships: has intellectual property rights and a financial interest in MR elastography technology. A.M. Activities related to the present article: disclosed no relevant relationships. Activities not related to the present article: received nonfinancial support from Resoundant. Other relationships: disclosed no relevant relationships. R.L.E. Activities related to the present article: disclosed no relevant relationships. Activities not related to the present article: received royalties from and holds stock options in Resoundant. Other relationships: has intellectual property rights and a financial interest in MR elastography technology; serves as the president, chief executive officer, and chief financial advisor of Resoundant.
Abbreviations:
- BMI
- body mass index
- HCV
- hepatitis C virus
- NAFLD
- nonalcoholic fatty liver disease
- NASH
- nonalcoholic steatohepatitis
References
- 1.Friedman SL. Hepatic fibrosis: overview. Toxicology 2008;254(3):120–129. [DOI] [PubMed] [Google Scholar]
- 2.Puche JE, Saiman Y, Friedman SL. Hepatic stellate cells and liver fibrosis. Compr Physiol 2013;3(4):1473–1492. [DOI] [PubMed] [Google Scholar]
- 3.Xu R, Zhang Z, Wang FS. Liver fibrosis: mechanisms of immune-mediated liver injury. Cell Mol Immunol 2012;9(4):296–301. [DOI] [PMC free article] [PubMed] [Google Scholar]
- 4.Hernandez-Gea V, Friedman SL. Pathogenesis of liver fibrosis. Annu Rev Pathol 2011;6:425–456. [DOI] [PubMed] [Google Scholar]
- 5.Ellis EL, Mann DA. Clinical evidence for the regression of liver fibrosis. J Hepatol 2012;56(5):1171–1180. [DOI] [PubMed] [Google Scholar]
- 6.Snowdon VK, Fallowfield JA. Models and mechanisms of fibrosis resolution. Alcohol Clin Exp Res 2011;35(5):794–799. [DOI] [PubMed] [Google Scholar]
- 7.Regev A, Berho M, Jeffers LJ, et al. Sampling error and intraobserver variation in liver biopsy in patients with chronic HCV infection. Am J Gastroenterol 2002;97(10):2614–2618. [DOI] [PubMed] [Google Scholar]
- 8.Kleckner MS, Jr. Needle biopsy of the liver: an appraisal of its diagnostic indications and limitations. Ann Intern Med 1954;40(6):1177–1193. [DOI] [PubMed] [Google Scholar]
- 9.Goyal N, Jain N, Rachapalli V, Cochlin DL, Robinson M. Non-invasive evaluation of liver cirrhosis using ultrasound. Clin Radiol 2009;64(11):1056–1066. [DOI] [PubMed] [Google Scholar]
- 10.Taouli B, Koh DM. Diffusion-weighted MR imaging of the liver. Radiology 2010;254(1):47–66. [DOI] [PubMed] [Google Scholar]
- 11.Haider MA, Farhadi FA, Milot L. Hepatic perfusion imaging: concepts and application. Magn Reson Imaging Clin N Am 2010;18(3):465–475, x. [DOI] [PubMed] [Google Scholar]
- 12.McPherson S, Jonsson JR, Cowin GJ, et al. Magnetic resonance imaging and spectroscopy accurately estimate the severity of steatosis provided the stage of fibrosis is considered. J Hepatol 2009;51(2):389–397. [DOI] [PubMed] [Google Scholar]
- 13.Talwalkar JA, Yin M, Fidler JL, Sanderson SO, Kamath PS, Ehman RL. Magnetic resonance imaging of hepatic fibrosis: emerging clinical applications. Hepatology 2008;47(1):332–342. [DOI] [PubMed] [Google Scholar]
- 14.Koh DM, Padhani AR. Functional magnetic resonance imaging of the liver: parametric assessments beyond morphology. Magn Reson Imaging Clin N Am 2010;18(3):565–585, xii. [DOI] [PubMed] [Google Scholar]
- 15.Assumpcao L, Choti M, Pawlik TM, Gecshwind JF, Kamel IR. Functional MR imaging as a new paradigm for image guidance. Abdom Imaging 2009;34(6):675–685. [DOI] [PubMed] [Google Scholar]
- 16.Sandrin L, Fourquet B, Hasquenoph JM, et al. Transient elastography: a new noninvasive method for assessment of hepatic fibrosis. Ultrasound Med Biol 2003;29(12):1705–1713. [DOI] [PubMed] [Google Scholar]
- 17.Sandrin L, Tanter M, Catheline S, Fink M. Shear modulus imaging with 2-D transient elastography. IEEE Trans Ultrason Ferroelectr Freq Control 2002;49(4):426–435. [DOI] [PubMed] [Google Scholar]
- 18.Yin M, Talwalkar JA, Glaser KJ, et al. Assessment of hepatic fibrosis with magnetic resonance elastography. Clin Gastroenterol Hepatol 2007;5(10):1207–1213, e2. [DOI] [PMC free article] [PubMed] [Google Scholar]
- 19.Yin M, Glaser KJ, Chen J, Talwalkar JA, Manduca A, Ehman RL. Improvements in hepatic stiffness assessment with 3-D/3-axis MR elastography [abstr]. In: Proceedings of the Eighteenth Meeting of the International Society for Magnetic Resonance in Medicine. Berkeley, Calif: International Society for Magnetic Resonance in Medicine, 2010; 2582. [Google Scholar]
- 20.Huwart L, Peeters F, Sinkus R, et al. Liver fibrosis: non-invasive assessment with MR elastography. NMR Biomed 2006;19(2):173–179. [DOI] [PubMed] [Google Scholar]
- 21.Klatt D, Hamhaber U, Asbach P, Braun J, Sack I. Noninvasive assessment of the rheological behavior of human organs using multifrequency MR elastography: a study of brain and liver viscoelasticity. Phys Med Biol 2007;52(24):7281–7294. [DOI] [PubMed] [Google Scholar]
- 22.Shire NJ, Yin M, Chen J, et al. Test-retest repeatability of MR elastography for noninvasive liver fibrosis assessment in hepatitis C. J Magn Reson Imaging 2011;34(4):947–955. [DOI] [PMC free article] [PubMed] [Google Scholar]
- 23.Hines CD, Lindstrom MJ, Varma AK, Reeder SB. Effects of postprandial state and mesenteric blood flow on the repeatability of MR elastography in asymptomatic subjects. J Magn Reson Imaging 2011;33(1):239–244. [DOI] [PubMed] [Google Scholar]
- 24.Chen J, Talwalkar JA, Yin M, Glaser KJ, Sanderson SO, Ehman RL. Early detection of nonalcoholic steatohepatitis in patients with nonalcoholic fatty liver disease by using MR elastography. Radiology 2011;259(3):749–756. [DOI] [PMC free article] [PubMed] [Google Scholar]
- 25.Manduca A, Oliphant TE, Dresner MA, et al. Magnetic resonance elastography: non-invasive mapping of tissue elasticity. Med Image Anal 2001;5(4):237–254. [DOI] [PubMed] [Google Scholar]
- 26.Manduca A, Lake DS, Kruse SA, Ehman RL. Spatio-temporal directional filtering for improved inversion of MR elastography images. Med Image Anal 2003;7(4):465–473. [DOI] [PubMed] [Google Scholar]
- 27.Yin M, Talwalkar JA, Glaser KJ, et al. Dynamic postprandial hepatic stiffness augmentation assessed with MR elastography in patients with chronic liver disease. AJR Am J Roentgenol 2011;197(1):64–70. [DOI] [PMC free article] [PubMed] [Google Scholar]
- 28.Dzyubak B, Glaser K, Yin M, et al. Automated liver stiffness measurements with magnetic resonance elastography. J Magn Reson Imaging 2013;38(2):371–379. [DOI] [PMC free article] [PubMed] [Google Scholar]
- 29.Bedossa P, Poynard T. An algorithm for the grading of activity in chronic hepatitis C: the METAVIR Cooperative Study Group. Hepatology 1996;24(2):289–293. [DOI] [PubMed] [Google Scholar]
- 30.Goodman ZD. Grading and staging systems for inflammation and fibrosis in chronic liver diseases. J Hepatol 2007;47(4):598–607. [DOI] [PubMed] [Google Scholar]
- 31.Brunt EM, Janney CG, Di Bisceglie AM, Neuschwander-Tetri BA, Bacon BR. Nonalcoholic steatohepatitis: a proposal for grading and staging the histological lesions. Am J Gastroenterol 1999;94(9):2467–2474. [DOI] [PubMed] [Google Scholar]
- 32.Positano V, Salani B, Pepe A, et al. Improved T2* assessment in liver iron overload by magnetic resonance imaging. Magn Reson Imaging 2009;27(2):188–197. [DOI] [PubMed] [Google Scholar]
- 33.Garteiser P, Sahebjavaher RS, Ter Beek LC, et al. Rapid acquisition of multifrequency, multislice and multidirectional MR elastography data with a fractionally encoded gradient echo sequence. NMR Biomed 2013;26(10):1326–1335. [DOI] [PubMed] [Google Scholar]
- 34.Runge JH, Bohte AE, Verheij J, et al. Comparison of interobserver agreement of magnetic resonance elastography with histopathological staging of liver fibrosis. Abdom Imaging 2014;39(2):283–290. [DOI] [PubMed] [Google Scholar]
- 35.Huwart L, Salameh N, ter Beek L, et al. MR elastography of liver fibrosis: preliminary results comparing spin-echo and echo-planar imaging. Eur Radiol 2008;18(11):2535–2541. [DOI] [PubMed] [Google Scholar]
- 36.Mariappan YK, Glaser KJ, Levin DL, et al. Estimation of the absolute shear stiffness of human lung parenchyma using (1) H spin echo, echo planar MR elastography. J Magn Reson Imaging 2014;40(5):1230–1237. [DOI] [PMC free article] [PubMed] [Google Scholar]
- 37.Huwart L, Sempoux C, Salameh N, et al. Liver fibrosis: noninvasive assessment with MR elastography versus aspartate aminotransferase-to-platelet ratio index. Radiology 2007;245(2):458–466. [DOI] [PubMed] [Google Scholar]
- 38.Mirault T, Lucidarme D, Turlin B, et al. Non-invasive assessment of liver fibrosis by transient elastography in post transfusional iron overload. Eur J Haematol 2008;80(4):337–340. [DOI] [PubMed] [Google Scholar]
- 39.Di Marco V, Bronte F, Cabibi D, et al. Noninvasive assessment of liver fibrosis in thalassaemia major patients by transient elastography (TE): lack of interference by iron deposition. Br J Haematol 2010;148(3):476–479. [DOI] [PubMed] [Google Scholar]
- 40.Bohte AE, van Dussen L, Akkerman EM, et al. Liver fibrosis in type I Gaucher disease: magnetic resonance imaging, transient elastography and parameters of iron storage. PLoS ONE 2013;8(3):e57507. [DOI] [PMC free article] [PubMed] [Google Scholar]
- 41.Yin M, Rouvière O, Glaser KJ, Ehman RL. Diffraction-biased shear wave fields generated with longitudinal magnetic resonance elastography drivers. Magn Reson Imaging 2008;26(6):770–780. [DOI] [PMC free article] [PubMed] [Google Scholar]
- 42.Catheline S, Thomas JL, Wu F, Fink MA. Diffraction field of a low frequency vibrator in soft tissues using transient elastography. IEEE Trans Ultrason Ferroelectr Freq Control 1999;46(4):1013–1019. [DOI] [PubMed] [Google Scholar]
- 43.Wong GL, Wong VW, Chim AM, et al. Factors associated with unreliable liver stiffness measurement and its failure with transient elastography in the Chinese population. J Gastroenterol Hepatol 2011;26(2):300–305. [DOI] [PubMed] [Google Scholar]
- 44.Castéra L, Foucher J, Bernard PH, et al. Pitfalls of liver stiffness measurement: a 5-year prospective study of 13,369 examinations. Hepatology 2010;51(3):828–835. [DOI] [PubMed] [Google Scholar]
- 45.Wong VWS, Vergniol J, Wong GLH, et al. Liver stiffness measurement using XL probe in patients with nonalcoholic fatty liver disease. Am J Gastroenterol 2012;107(12):1862–1871. [DOI] [PubMed] [Google Scholar]
- 46.de Lédinghen V, Wong VW, Vergniol J, et al. Diagnosis of liver fibrosis and cirrhosis using liver stiffness measurement: comparison between M and XL probe of FibroScan®. J Hepatol 2012;56(4):833–839. [DOI] [PubMed] [Google Scholar]
- 47.Wong GL, Vergniol J, Lo P, et al. Non-invasive assessment of liver fibrosis with transient elastography (FibroScan®): applying the cut-offs of M probe to XL probe. Ann Hepatol 2013;12(4):570–580. [PubMed] [Google Scholar]
- 48.Myers RP, Pomier-Layrargues G, Kirsch R, et al. Discordance in fibrosis staging between liver biopsy and transient elastography using the FibroScan XL probe. J Hepatol 2012;56(3):564–570. [DOI] [PubMed] [Google Scholar]
- 49.Roulot D, Czernichow S, Le Clésiau H, Costes JL, Vergnaud AC, Beaugrand M. Liver stiffness values in apparently healthy subjects: influence of gender and metabolic syndrome. J Hepatol 2008;48(4):606–613. [DOI] [PubMed] [Google Scholar]
- 50.Lee DH, Lee JM, Han JK, Choi BI. MR elastography of healthy liver parenchyma: Normal value and reliability of the liver stiffness value measurement. J Magn Reson Imaging 2013;38(5):1215–1223. [DOI] [PubMed] [Google Scholar]
- 51.Moirand R, Adams PC, Bicheler V, Brissot P, Deugnier Y. Clinical features of genetic hemochromatosis in women compared with men. Ann Intern Med 1997;127(2):105–110. [DOI] [PubMed] [Google Scholar]
- 52.Huwart L, van Beers BE. MR elastography. Gastroenterol Clin Biol 2008;32(6 Suppl 1):68–72. [DOI] [PubMed] [Google Scholar]
- 53.Salameh N, Larrat B, Abarca-Quinones J, et al. Early detection of steatohepatitis in fatty rat liver by using MR elastography. Radiology 2009;253(1):90–97. [DOI] [PubMed] [Google Scholar]
- 54.Weinand ME. A mathematical model for brain edema: the relationship between brain tissue water content and intracranial pressure. Med Hypotheses 1992;37(2):63–64. [DOI] [PubMed] [Google Scholar]
- 55.Goto T, Mikami KI, Miura K, et al. Mechanical stretch induces matrix metalloproteinase 1 production in human hepatic stellate cells. Pathophysiology 2004;11(3):153–158. [DOI] [PubMed] [Google Scholar]
- 56.Sakata R, Ueno T, Nakamura T, Ueno H, Sata M. Mechanical stretch induces TGF-beta synthesis in hepatic stellate cells. Eur J Clin Invest 2004;34(2):129–136. [DOI] [PubMed] [Google Scholar]
- 57.Ganne-Carrié N, Ziol M, de Ledinghen V, et al. Accuracy of liver stiffness measurement for the diagnosis of cirrhosis in patients with chronic liver diseases. Hepatology 2006;44(6):1511–1517. [DOI] [PubMed] [Google Scholar]
- 58.Fraquelli M, Rigamonti C, Casazza G, et al. Etiology-related determinants of liver stiffness values in chronic viral hepatitis B or C. J Hepatol 2011;54(4):621–628. [DOI] [PubMed] [Google Scholar]
- 59.Sporea I, Raţiu I, Bota S, Şirli R, Jurchiş A. Are different cut-off values of liver stiffness assessed by transient elastography according to the etiology of liver cirrhosis for predicting significant esophageal varices? Med Ultrason 2013;15(2):111–115. [DOI] [PubMed] [Google Scholar]
- 60.Bohte AE, de Niet A, Jansen L, et al. Non-invasive evaluation of liver fibrosis: a comparison of ultrasound-based transient elastography and MR elastography in patients with viral hepatitis B and C. Eur Radiol 2014;24(3):638–648. [DOI] [PubMed] [Google Scholar]
- 61.Motosugi U, Ichikawa T, Amemiya F, et al. Cross-validation of MR elastography and ultrasound transient elastography in liver stiffness measurement: discrepancy in the results of cirrhotic liver. J Magn Reson Imaging 2012;35(3):607–610. [DOI] [PubMed] [Google Scholar]
- 62.Oudry J, Chen J, Glaser KJ, Miette V, Sandrin L, Ehman RL. Cross-validation of magnetic resonance elastography and ultrasound-based transient elastography: a preliminary phantom study. J Magn Reson Imaging 2009;30(5):1145–1150. [DOI] [PMC free article] [PubMed] [Google Scholar]
- 63.Friedrich-Rust M, Wunder K, Kriener S, et al. Liver fibrosis in viral hepatitis: noninvasive assessment with acoustic radiation force impulse imaging versus transient elastography. Radiology 2009;252(2):595–604. [DOI] [PubMed] [Google Scholar]
- 64.Friedrich-Rust M, Romen D, Vermehren J, et al. Acoustic radiation force impulse-imaging and transient elastography for non-invasive assessment of liver fibrosis and steatosis in NAFLD. Eur J Radiol 2012;81(3):e325–e331. [DOI] [PubMed] [Google Scholar]
- 65.Chen S, Urban MW, Pislaru C, Kinnick R, Greenleaf JF. Liver elasticity and viscosity quantification using shearwave dispersion ultrasound vibrometry (SDUV). Conf Proc IEEE Eng Med Biol Soc 2009;2009:2252–2255. [DOI] [PubMed] [Google Scholar]
- 66.Johnson CL, Holtrop JL, McGarry MD, et al. 3D multislab, multishot acquisition for fast, whole-brain MR elastography with high signal-to-noise efficiency. Magn Reson Med 2014;71(2):477–485. [DOI] [PMC free article] [PubMed] [Google Scholar]
- 67.Shi Y, Glaser KJ, Venkatesh SK, Ben-Abraham EI, Ehman RL. Feasibility of using 3D MR elastography to determine pancreatic stiffness in healthy volunteers. J Magn Reson Imaging 2015;41(2):369–375. [DOI] [PMC free article] [PubMed] [Google Scholar]
- 68.Stanley DW, Glaser KJ, Yin M, Chen J, Ehman RL. Validity study of spin echo EPI based hepatic MR elastography at 3.0T [abstr]. In: Proceedings of the Eighteenth Meeting of the International Society for Magnetic Resonance in Medicine. Berkeley, Calif: International Society for Magnetic Resonance in Medicine, 2010; 639. [Google Scholar]
Associated Data
This section collects any data citations, data availability statements, or supplementary materials included in this article.