Abstract
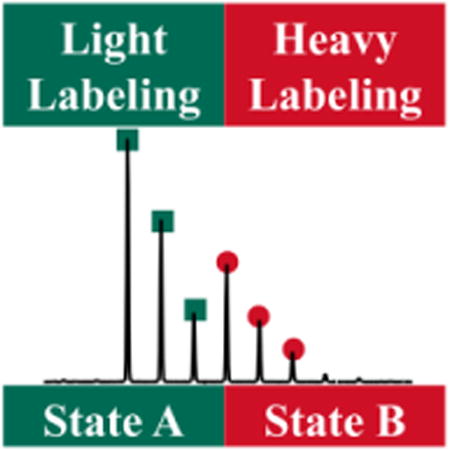
We report an isotope-encoding method coupled with carboxyl-group footprinting to monitor protein conformational changes. The carboxyl groups of aspartic/glutamic acids and of the C-terminus of proteins can serve as reporters for protein conformational changes when labeled with glycine ethyl ester (GEE) mediated by carbodiimide. In the new development, isotope-encoded “heavy” and “light” GEE are used to label separately the two states of the Orange Carotenoid Protein (OCP) from cyanobacteria. Two samples are mixed (1:1 ratio) and analyzed by a single LC-MS/MS experiment. The differences in labeling extent between the two states are represented by the ratio of the “heavy” and “light” peptides, providing information about protein conformational changes. Combining isotope-encoded MS quantitative analysis and carboxyl-group footprinting reduces the time of MS analysis and improves the sensitivity of GEE and other footprinting.
Graphical abstract

Introduction
Mass spectrometry (MS)-based protein footprinting is an emerging approach for protein conformational studies[1]. In general, residues on the protein surface are labeled by reagents in solution. Residues buried in the protein higher order structure or having low solvent accessibility are protected and less-labeled. Protein conformation and its variations determine the modification extent, which is monitored by MS. High speed and sensitivity make MS-based protein footprinting an effective tool in protein conformational studies[2].
Various protein footprinting strategies, ranging from hydrogen deuterium exchange (HDX) to NHS ester labeling, are now established [3]. HDX is particularly heavily used in studies of protein conformation [4]. The rapid back-exchange of deuterium to hydrogen during sample handling and MS analysis, however, limits its applications. The use of hydroxyl radicals is another way to “footprint” proteins [5]. Because the hydroxyl radical is highly reactive, this approach requires a comprehensive search for multiple labeling targets and different modified products in the data processing. This process takes considerable time for large protein complexes. For complicated biological systems like membrane-embedded protein complexes, a quick and simple footprinting approach that imparts irreversible labels is desired. Although many reagents are specific to one or two residues, fewer labeling targets and products make their use quick and simple [6-9]. This advantage has been convincingly emphasized in studies of complicated biological systems [10-15].
Carboxyl group footprinting[16-18] introduces GEE tags on solvent-accessible acid side chains under biologically relevant conditions. We termed this approach “GEE labeling” to represent its chemistry. The product of GEE labeling is stable during protein separation and purification. A typical bottom-up LC-MS/MS experiment and quantitative analysis are usually used to determine the labeling extent at the peptide and residue levels [19]. The GEE labeling method can also probe protein-protein interactions in protein complexes [11, 19].
Here, we report an isotope-encoded approach to improve the platform of GEE labeling that takes a lead from isotope-encoded reagents that have been widely used in quantitative proteomics. The abundance of each protein can be compared between samples by measuring heavy-to-light ratios [20-22]. This approach has been integrated into protein footprinting strategies for cysteine and lysine residues [15, 23-26]. In the new development, isotope-encoded “heavy” and “light” GEE are used to label separately the two states of a protein (Figure 1), here orange carontenoid protein or OCP, in a biophysics application. OCP is a photoactive protein involved in the photo-protection of cyanobacteria [27]. Previous studies show that inactive OCP (orange form, OCPO) undergoes conformational changes upon light irradiation. Those conformational changes give an active OCP (red form, OCPR) [28, 29]. Although high-resolution structural models of OCPO were reported [30, 31], the conformational changes occurring between OCPO and OCPR are poorly understood. In our approach, GEE-labeled OCP samples are mixed (OCPO:OCPR = 1:1) and analyzed in a single LC-MS/MS experiment. The differences in labeling extent between OCPO and OCPR are measured as a heavy-to-light ratio of each labeled peptide, revealing in a single experiment the conformational changes between OCPO and OCPR.
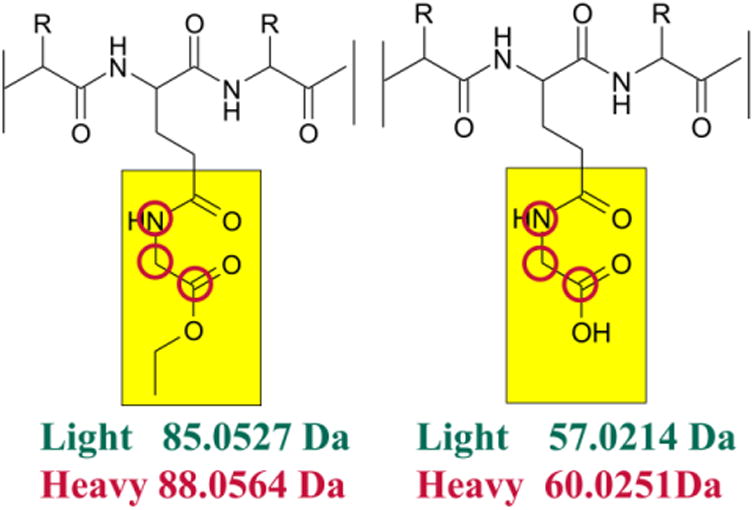
Figure 1.

The products of carboxyl group foot-printing, heavy elements 13C × 2 and 15N × 1 are used in isotope-encoded GEE tags (high-lighted by red circles).
Experimental methods
OCP samples were separated and purified from the cyanobacterium Synechocystis sp. PCC 6803 based on a published protocol [17]. A strong light source (1000 µmol photons m-2s-1) was used to irradiate OCP samples to trigger the conversion from OCPO to OCPR. Two forms of GEE (heavy GEE, 13C × 2 and 15N × 1 coded, Cambridge Isotope Lab, Tewksbury, MA) and “light” GEE (Sigma-Aldrich, St. Louis, MO) were used as primary amide sources during carbodiimide (1-ethyl-3-(3-dimethylaminopropyl) carbodiimide or EDC (Life Technologies, Grand Island, NY) coupling reactions. GEE-labeled OCPO and OCPR samples were mixed after quenching the labeling reaction (for more details, see Supporting Information). The protein samples were digested by LysC and Trypsin. Digested OCP samples were analyzed by using a Waters Synapt G2 Q-TOF coupled with a nanoAcquity UPLC (Waters Inc., Milford, MA) and also with an LTQ-Orbitrap (Thermo Scientific, San Jose, CA) coupled with nano-HPLC UltiMate 3000 (Dionex, Sunnyvale, CA). The raw data were directly searched by using PEAKS (V 7.0, Bioinformatics Solution Inc. Waterloo, ON, Canada) against the Swiss-Prot database and the target OCP sequence. Quantitative analysis was done manually by using MassLynx (Waters Inc., Milford, MA) and QuanBrowser (Xcalibur, Thermo Scientific, San Jose, CA).
Results and discussion
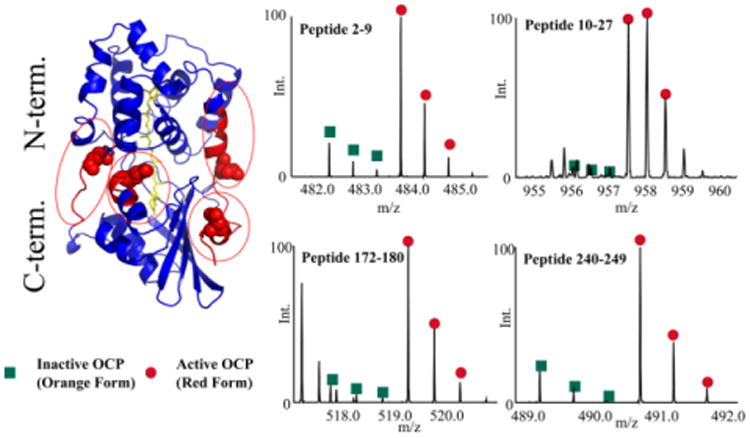
We used database searches to identify tryptic and semi-tryptic peptides covering 98% of the OCP sequence. Only two small tryptic regions (86TK87 and 235ENVLR239) were missing in the LC-MS/MS data. We also found an N-terminal methionine excision (NME) and single-sequence variation (180Gln to 180Arg). GEE-labels were detectable with an LC-MS/MS experiment on 13 peptides (Figure S1). All 13 modified peptides show the typical doublet peaks with a 3 Da difference (“heavy” and “light” versions of GEE labeling products) allowing us to calculate their heavy-to-light ratios in triplicate experiments (Figure S2 and S3). Four of 13 peptides (peptide 2-9, peptide 10-27, peptide 172-180 and peptide 240-249) have significant increases in the ratio (> 3 fold). Those indicate that regions covering those four peptides undergo large conformational changes from OCPO to OCPR. Four peptides adopted more “open” conformation in OCPR than OCPO.
Although substantial evidence indicates that conformational changes occur during conversion from OCPO to OCPR [31-35], molecular-level details of these changes are missing. A high-resolution structural model of OCPO has a typical two-domain structure: N-terminal domain (NTD) and C-terminal domain (CTD). The carotenoid (pigment), echinenone, spans both domains and is buried inside the OCPO [30]. Recently, X-ray crystallography provided a structural model of isolated, carotenoid-binding NTD in an active state (equal to the NTD of OCPR) without light irradiation [33]. Evidence from that structure coupled with information from MS-based protein footprinting suggests that the conversion from OCPO to OCPR introduces a separation between NTD and CTD and exposes regions between NTD and CTD [17, 36]. We highlight the four peptides recognized by isotope-encoded GEE labeling on the OCPO structure (Figure 2). All four peptides are in the linker region between NTD and CTD. The result from isotope-encoded GEE labeling is consistent with proposed OCPO-to-OCPR modes from other evidence.
Figure 2.

Footprinting results from isotope-encoded carboxyl group labeling. Four peptide regions that undergo large conformational chang-es are highlighted in red on the OCPO structure (PDB ID: 3MG1). Magnified mass spectra of modified peptides are displayed on the right side.
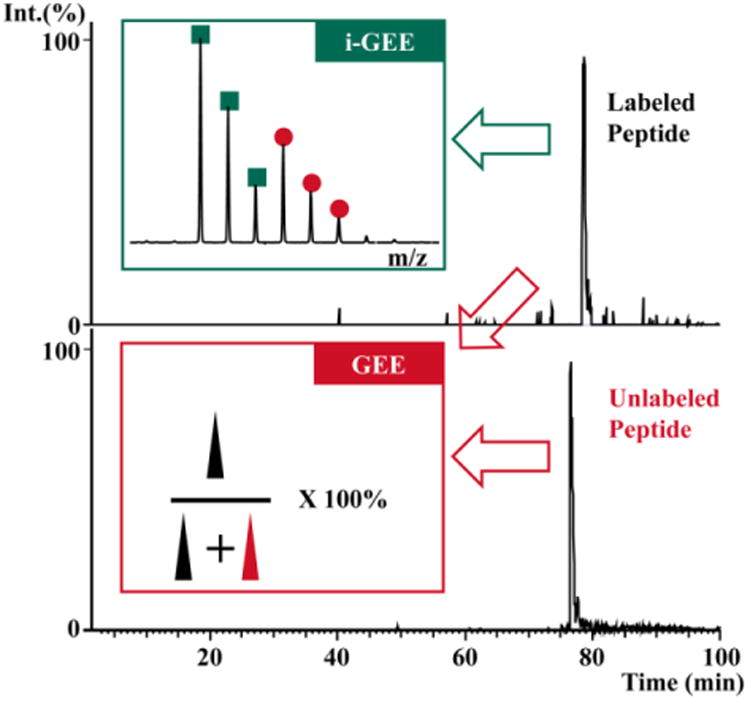
In the traditional GEE labeling, intensity information for both unmodified and modified peptides comes from two experiments and are required for calculation of modification extents (Figure 3). Because there may be a variation of ionization efficiency between unmodified and modified peptides, the calculated modification extent from LC-MS/MS data may be different than the real modification level. In most MS-based protein footprinting, the calculated modification extents of the two protein states (OCPO and OCPR in this case) are compared. The protein conformational changes are surmised based on the difference of modification extents. Isotope-encoded GEE labeling only requires the intensity information for the modified peptides. The difference in modification level is encoded into a heavy-to-light ratio of the same modified peptide measured in a single LC-MS/MS experiment (Figure 3).
Figure 3.

Traditional GEE labeling vs. isotope-encoded GEE labeling. The red box represents the calculation of modification extent based on peak areas of both labeled and unlabeled peptides from two analyses. The green box shows the spectra of modified peptide in isotope-encoded GEE labeling. The peak areas of both labeled and unlabeled peptides are extracted by using accu-rate masses of the peptides (EIC spectra).
Using isotope-encoded GEE labeling reduces the LC-MS/MS experiment time: one LC-MS/MS run (isotope-encoded GEE labeling) instead of two LC-MS/MS runs (traditional GEE labeling). Introducing the “heavy” GEE reagent improves the identification and quantitative analysis of the modified peptides. The time for data processing is also significantly reduced by extracting the conformational difference from the heavy-to-light ratio of the same modified peptides. In the study of OCPO to OCPR conversion, conformational changes of OCP can be clearly identified by such a simple and quick protein footprinting experiment. The results are consistent with the previous report based on the traditional GEE labeling protocol[17].
Conclusion
Although GEE labeling modifies fewer targets compared to HDX and hydroxyl radical footprinting, it provides a simple and quick approach that can be easily adapted in most biology labs. Here, we report, following the lead of stable isotope labeling in MS-based quantitative proteomics[20-22], an improved version of GEE labeling that uses an isotope-encoded reagent. This improved approach brings a significant advantage for MS-based peptide quantification. Integrating such features into MS-based protein footprinting was also recently reported[24-26] for cysteine or lysine residues, which are common targets for isotope-labeling quantitative proteomics. In our application, we introduce and show the utility of isotope-encoded GEE footprinting and demonstrate that it serves as a faithful reporter for protein conformational changes as well as protein-protein interactions.
Supplementary Material
Acknowledgments
We thank Dr. Jing Jiang and Mr. Nathan R. Wolf for helping with cell culture and technical support. This research was supported by the Photosynthetic Antenna Research Center (PARC), an Energy Frontier Research Center funded by the U.S. Department of Energy (DOE), Office of Basic Energy Science (Grant DE-SC 0001035 to REB.), DOE funding (Grant DE-FG02-07ER15902 to REB.), and the National Institutes of Health\National Institute of General Medical Sciences (Grant P41GM103422 to MLG). MS instrumentation was provided by both the PARC and NIH (NIH SIG 1S10OD16298). HZ was supported by the PARC grant. H.L. was supported by DOE grant DE-FG02-07ER15902.
References
- 1.Konermann L, Vahidi S, Sowole MA. Mass spectrometry methods for studying structure and dynamics of biological macromolecules. Anal Chem. 2014;86:213–232. doi: 10.1021/ac4039306. [DOI] [PubMed] [Google Scholar]
- 2.Kaltashov IA, Eyles SJ. Mass spectrometry in structural biology and biophysics: Architecture, dynamics and interaction of biomolecules. John Wiley & Sons, Inc.; New York: 2012. [Google Scholar]
- 3.Mendoza VL, Vachet RW. Probing protein structure by amino acid-specific covalent labeling and mass spectrometry. Mass Spectrom Rev. 2009;28:785–815. doi: 10.1002/mas.20203. [DOI] [PMC free article] [PubMed] [Google Scholar]
- 4.Engen JR, Wales TE. Analytical aspects of hydrogen exchange mass spectrometry. Annu Rev Anal Chem (Palo Alto Calif) 2015 doi: 10.1146/annurev-anchem-062011-143113. [DOI] [PMC free article] [PubMed] [Google Scholar]
- 5.Xu G, Chance MR. Hydroxyl radical-mediated modification of proteins as probes for structural proteomics. Chem Rev. 2007;107:3514–3543. doi: 10.1021/cr0682047. [DOI] [PubMed] [Google Scholar]
- 6.Hanai R, Wang JC. Protein footprinting by the combined use of reversible and irreversible lysine modifications. Proceedings of the National Academy of Sciences of the United States of America. 1994;91:11904–11908. doi: 10.1073/pnas.91.25.11904. [DOI] [PMC free article] [PubMed] [Google Scholar]
- 7.Sperry JB, Shi X, Rempel DL, Nishimura Y, Akashi S, Gross ML. A mass spectrometric approach to the study of DNA-binding proteins: Interaction of human trf2 with telomeric DNA. Biochemistry. 2008;47:1797–1807. doi: 10.1021/bi702037p. [DOI] [PubMed] [Google Scholar]
- 8.Chen YT, Collins TR, Guan Z, Chen VB, Hsieh TS. Probing conformational changes in human DNA topoisomerase iialpha by pulsed alkylation mass spectrometry. The Journal of Biological Chemistry. 2012;287:25660–25668. doi: 10.1074/jbc.M112.377606. [DOI] [PMC free article] [PubMed] [Google Scholar]
- 9.Lodowski DT, Miyagi M. Analysis of conformational changes in rhodopsin by histidine hydrogen-deuterium exchange. Methods in Molecular Biology (Clifton, NJ) 2015;1271:123–132. doi: 10.1007/978-1-4939-2330-4_9. [DOI] [PubMed] [Google Scholar]
- 10.Collier TS, Diraviyam K, Monsey J, Shen W, Sept D, Bose R. Carboxyl group footprinting mass spectrometry and molecular dynamics identify key interactions in the her2-her3 receptor tyrosine kinase interface. The Journal of Biological Chemistry. 2013;288:25254–25264. doi: 10.1074/jbc.M113.474882. [DOI] [PMC free article] [PubMed] [Google Scholar]
- 11.Liu H, Chen J, Huang RY, Weisz D, Gross ML, Pakrasi HB. Mass spectrometry-based footprinting reveals structural dynamics of loop e of the chlorophyll-binding protein cp43 during photosystem ii assembly in the cyanobacterium synechocystis 6803. The Journal of Biological Chemistry. 2013;288:14212–14220. doi: 10.1074/jbc.M113.467613. [DOI] [PMC free article] [PubMed] [Google Scholar]
- 12.Wen J, Zhang H, Gross ML, Blankenship RE. Membrane orientation of the fmo antenna protein from chlorobaculum tepidum as determined by mass spectrometry-based footprinting. Proceedings of the National Academy of Sciences of the United States of America. 2009;106:6134–6139. doi: 10.1073/pnas.0901691106. [DOI] [PMC free article] [PubMed] [Google Scholar]
- 13.Kaur P, Tomechko SE, Kiselar J, Shi W, Deperalta G, Wecksler AT, Gokulrangan G, Ling V, Chance MR. Characterizing monoclonal antibody structure by carboxyl group footprinting. mAbs. 2015;7:540–552. doi: 10.1080/19420862.2015.1023683. [DOI] [PMC free article] [PubMed] [Google Scholar]
- 14.Crane BR. Structural biology by mass spectrometry: Mapping protein interaction surfaces of membrane receptor complexes with icat. Journal of Molecular Biology. 2011;409:481–482. doi: 10.1016/j.jmb.2011.04.030. [DOI] [PMC free article] [PubMed] [Google Scholar]
- 15.Underbakke ES, Zhu Y, Kiessling LL. Protein footprinting in a complex milieu: Identifying the interaction surfaces of the chemotaxis adaptor protein chew. Journal of Molecular Biology. 2011;409:483–495. doi: 10.1016/j.jmb.2011.03.040. [DOI] [PMC free article] [PubMed] [Google Scholar]
- 16.Gau B, Garai K, Frieden C, Gross ML. Mass spectrometry-based protein footprinting characterizes the structures of oligomeric apolipoprotein e2, e3, and e4. Biochemistry. 2011;50:8117–8126. doi: 10.1021/bi200911c. [DOI] [PMC free article] [PubMed] [Google Scholar]
- 17.Liu H, Zhang H, King j D, Wolf NR, Prado M, Gross ML, Blankenship RE. Mass spectrometry footprinting reveals the structural rearrangements of cyanobacterial orange carotenoid protein upon light activation. Biochim Biophys Acta. 2014;1837:1955–1963. doi: 10.1016/j.bbabio.2014.09.004. [DOI] [PubMed] [Google Scholar]
- 18.Zhang H, Shen W, Rempel D, Monsey J, Vidavsky I, Gross ML, Bose R. Carboxyl-group footprinting maps the dimerization interface and phosphorylation-induced conformational changes of a membrane-associated tyrosine kinase. Mol Cell Proteomics. 2011;10:M110 005678. doi: 10.1074/mcp.M110.005678. [DOI] [PMC free article] [PubMed] [Google Scholar]
- 19.Zhang H, Wen J, Huang RY, Blankenship RE, Gross ML. Mass spectrometry-based carboxyl footprinting of proteins: Method evaluation. Int J Mass Spectrom. 2012;312:78–86. doi: 10.1016/j.ijms.2011.07.015. [DOI] [PMC free article] [PubMed] [Google Scholar]
- 20.Elliott MH, Smith DS, Parker CE, Borchers C. Current trends in quantitative proteomics. J Mass Spectrom. 2009;44:1637–1660. doi: 10.1002/jms.1692. [DOI] [PubMed] [Google Scholar]
- 21.Ong SE, Foster LJ, Mann M. Mass spectrometric-based approaches in quantitative proteomics. Methods. 2003;29:124–130. doi: 10.1016/s1046-2023(02)00303-1. [DOI] [PubMed] [Google Scholar]
- 22.Tao WA, Aebersold R. Advances in quantitative proteomics via stable isotope tagging and mass spectrometry. Curr Opin Biotechnol. 2003;14:110–118. doi: 10.1016/s0958-1669(02)00018-6. [DOI] [PubMed] [Google Scholar]
- 23.Chen J, Smith DL, Griep MA. The role of the 6 lysines and the terminal amine of escherichia coli single-strand binding protein in its binding of single-stranded DNA. Protein science : a publication of the Protein Society. 1998;7:1781–1788. doi: 10.1002/pro.5560070813. [DOI] [PMC free article] [PubMed] [Google Scholar]
- 24.Kahsai AW, Rajagopal S, Sun J, Xiao K. Monitoring protein conformational changes and dynamics using stable-isotope labeling and mass spectrometry. Nat Protoc. 2014;9:1301–1319. doi: 10.1038/nprot.2014.075. [DOI] [PMC free article] [PubMed] [Google Scholar]
- 25.Underbakke ES, Zhu Y, Kiessling LL. Isotope-coded affinity tags with tunable reactivities for protein footprinting. Angew Chem Int Ed Engl. 2008;47:9677–9680. doi: 10.1002/anie.200803378. [DOI] [PMC free article] [PubMed] [Google Scholar]
- 26.Zhou Y, Vachet RW. Covalent labeling with isotopically encoded reagents for faster structural analysis of proteins by mass spectrometry. Anal Chem. 2013;85:9664–9670. doi: 10.1021/ac401978w. [DOI] [PMC free article] [PubMed] [Google Scholar]
- 27.Kirilovsky D, Kerfeld CA. The orange carotenoid protein: A blue-green light photoactive protein. Photochem Photobiol Sci. 2013;12:1135–1143. doi: 10.1039/c3pp25406b. [DOI] [PubMed] [Google Scholar]
- 28.Kirilovsky D. Photoprotection in cyanobacteria: The orange carotenoid protein (ocp)-related non-photochemical-quenching mechanism. Photosynth Res. 2007;93:7–16. doi: 10.1007/s11120-007-9168-y. [DOI] [PubMed] [Google Scholar]
- 29.Wilson A, Punginelli C, Gall A, Bonetti C, Alexandre M, Routaboul JM, Kerfeld CA, van Grondelle R, Robert B, Kennis JT, Kirilovsky D. A photoactive carotenoid protein acting as light intensity sensor. Proceedings of the National Academy of Sciences of the United States of America. 2008;105:12075–12080. doi: 10.1073/pnas.0804636105. [DOI] [PMC free article] [PubMed] [Google Scholar]
- 30.Kerfeld CA, Sawaya MR, Brahmandam V, Cascio D, Ho KK, Trevithick-Sutton CC, Krogmann DW, Yeates TO. The crystal structure of a cyanobacterial water-soluble carotenoid binding protein. Structure. 2003;11:55–65. doi: 10.1016/s0969-2126(02)00936-x. [DOI] [PubMed] [Google Scholar]
- 31.Wilson A, Kinney JN, Zwart PH, Punginelli C, D'Haene S, Perreau F, Klein MG, Kirilovsky D, Kerfeld CA. Structural determinants underlying photoprotection in the photoactive orange carotenoid protein of cyanobacteria. The Journal of Biological Chemistry. 2010;285:18364–18375. doi: 10.1074/jbc.M110.115709. [DOI] [PMC free article] [PubMed] [Google Scholar]
- 32.Kirilovsky D. Modulating energy arriving at photochemical reaction centers: Orange carotenoid protein-related photoprotection and state transitions. Photosynth Res. 2014 doi: 10.1007/s11120-014-0031-7. [DOI] [PubMed] [Google Scholar]
- 33.Leverenz RL, Jallet D, Li MD, Mathies RA, Kirilovsky D, Kerfeld CA. Structural and functional modularity of the orange carotenoid protein: Distinct roles for the n- and c-terminal domains in cyanobacterial photoprotection. Plant Cell. 2014;26:426–437. doi: 10.1105/tpc.113.118588. [DOI] [PMC free article] [PubMed] [Google Scholar]
- 34.Wilson A, Gwizdala M, Mezzetti A, Alexandre M, Kerfeld CA, Kirilovsky D. The essential role of the n-terminal domain of the orange carotenoid protein in cyanobacterial photoprotection: Importance of a positive charge for phycobilisome binding. Plant Cell. 2012;24:1972–1983. doi: 10.1105/tpc.112.096909. [DOI] [PMC free article] [PubMed] [Google Scholar]
- 35.Zhang H, Liu H, Niedzwiedzki DM, Prado M, Jiang J, Gross ML, Blankenship RE. Molecular mechanism of photoactivation and structural location of the cyanobacterial orange carotenoid protein. Biochemistry. 2014;53:13–19. doi: 10.1021/bi401539w. [DOI] [PMC free article] [PubMed] [Google Scholar]
- 36.de Carbon CB, Thurotte A, Wilson A, Perreau F, Kirilovsky D. Biosynthesis of soluble carotenoid holoproteins in escherichia coli. Sci Rep. 2015;5:9085. doi: 10.1038/srep09085. [DOI] [PMC free article] [PubMed] [Google Scholar]
Associated Data
This section collects any data citations, data availability statements, or supplementary materials included in this article.


