Abstract
Objective
Explore whether 3T MRI can identify low-risk ductal carcinoma in situ (DCIS).
Methods
Dynamic contrast enhanced (DCE) and diffusion weighted (DWI) MRI features of 36 DCIS lesions (8 low-risk, Van Nuys Pathologic Classification [VNPC] 1) and 28 high-risk, VNPC 2/3]) were reviewed. An MRI model that best identified low-risk DCIS was determined using multivariate logistic regression.
Results
Low-risk DCIS exhibited different DWI properties (higher contrast-to-noise ratio [p=0.02] and lower normalized apparent diffusion coefficients [p=0.04] than high-risk DCIS. A model combining these DWI features provided best performance (area under ROC=0.86).
Conclusions
DWI may help identify DCIS lesions requiring less therapy.
Keywords: Ductal carcinoma in situ, MRI, biomarker, diffusion weighted imaging
Introduction
The incidence of ductal carcinoma in situ (DCIS), the earliest form of breast cancer, has increased more than sevenfold from 1973 through the late 1990s with more widespread mammographic screening. In the prevailing theory of breast cancer pathogenesis, DCIS represents an early malignancy in a spectrum of otherwise benign intraductal proliferations that can progress to invasive carcinoma. However, it has been estimated that nearly half of DCIS lesions would never lead to life threatening invasive breast cancers if left untreated. Furthermore, this close relationship of DCIS to both benign breast pathology and aggressive invasive breast malignancy makes pathological characterization of DCIS prone to inter-observer variability and poor reproducibility 1.
Because there is broad consensus within the breast oncology community that many women are over-treated for DCIS, the identification of reliable biomarkers of low risk disease not requiring aggressive therapy is of paramount importance 2. The Van Nuys Pathologic Classification (VNPC) was created to decrease variability in pathological grading by using standardized groupings based on nuclear grade and comedonecrosis and to provide a reliable marker of DCIS at low risk for local recurrence after treatment 3. This classification system can be used in concert with clinical parameters, such as surgical margins and patient age, to create a risk-assessment tool (Van Nuys Prognostic Index [VNPI]) to guide DCIS management 4. However, the VNPI has not been widely adopted for treatment decision-making because of inconsistent validation 5, 6, which may be at least in part due to pathological sampling errors owing to intra-lesion heterogeneity 7.
The use of MRI features to aid in DCIS risk assessment has the theoretical advantage of being free from sampling error through assessment of the entire lesion, which could provide increased confidence in pathological characterization. Our prior work to identify MRI biomarkers of DCIS biology has yielded promising results, with high nuclear grade lesions demonstrating greater lesion size and higher peak initial enhancement on dynamic contrast enhanced (DCE) MRI, and lower contrast-to-noise ratio (CNR) on diffusion weighted imaging (DWI) than non-high nuclear grade lesions 8. We sought to further assess these potential MRI biomarkers of DCIS by determining their ability to discriminate low risk from high risk DCIS lesions as defined by VNPC.
Materials and Methods
Patient Population
The protocol for this study was approved by our Institutional Review Board and was compliant with the Health Insurance Portability and Accountability Act. Requirement to obtain informed consent was waived due to the retrospective nature of the study. A review of our MRI database was performed to identify eligible patients who underwent a 3 tesla (T) breast MR examination from January 1, 2010 to July 31, 2011 who were diagnosed with DCIS by means of core needle biopsy.
All patients who were diagnosed with DCIS and underwent a clinical breast MR examination with both DWI and DCE imaging protocols without upgrade to invasive disease on final surgical excision were included. Of the 36 patients with 40 unique DCIS lesions who met these initial inclusion criteria, one patient with one DCIS lesion was excluded due to excessive DWI motion artifact precluding accurate region of interest (ROI) placement and three patients with a total of three biopsy-proven DCIS lesions were excluded due to lack of any residual suspicious enhancement on DCE images. Thus, the final cohort included 32 patients with 36 unique pure DCIS lesions.
MRI acquisition
All bilateral breast MRIs were performed on a Philips Achieva TX scanner (Philips Healthcare, Best, the Netherlands). Each MRI included the following sequences: T2-weighted fast spin echo sequence, T1-weighted non-fat suppressed sequence, T1-weighted fat-suppressed DCE MRI sequences before and after contrast administration, and a DWI sequence. All scans were acquired in the axial orientation. The DCE MRI protocol was in compliance with the American College of Radiology breast MRI accreditation program, and was performed using a T1-weighted 3D turbo field echo sequence with parallel imaging (THRIVE) with 1.3 mm slice thickness, FOV = 32-38 cm, and 660 × 672 matrix, yielding 0.5 mm in-plane resolution. DWI was performed using a diffusion-weighted EPI sequence with parallel imaging (reduction factor = 3); TR/TE = 8000/63 msec, 2 averages, matrix = 240 × 288, FOV = 36 cm, slice thickness = 4 mm, gap = 0 mm, and b = 0 and 800 s/mm2.
Image Interpretation
One of six fellowship-trained radiologists specializing in breast imaging prospectively interpreted the DCE MR images. MRI findings, including maximum lesion size, morphologic features, and kinetic enhancement characteristics, including peak initial enhancement (assessed at approximately 115 seconds after contrast injection) and delayed-phase worst curve type as previously described 8, were assessed in accordance with the 4th edition of the American College of Radiology Breast Imaging Reporting and Data System (BI-RADS) Atlas 9 and were entered into our MRI database and extracted for the purposes of this study. DW image analyses were performed retrospectively offline by a research fellow under the direct guidance and supervision of a fellowship-trained radiologist specializing in breast imaging. Each lesion first was identified on the DW images through visual correlation of the lesion location with the DCE images. ADC maps and directionally averaged DW images were calculated as previously described 10 by the research fellow, who was trained in the use of in-house image-processing software incorporating ImageJ (National Institutes of Health, public domain). ROIs were defined on the averaged DW images with b value of 800 s/mm2 for the lesion and normal non-adipose fibroglandular breast tissue in the contralateral breast. These ROIs were propagated onto the T2-weighted b = 0 s/mm2 DW images and ADC maps, facilitating calculation of the mean DWI signal intensity at b = 0 s/mm2 and b = 800 s/mm2 and mean ADC values for each DCIS lesion (lesion ADC) and normal tissue (normal tissue ADC). Normalized ADCs, which have been shown in a prior study to improve diagnostic accuracy over standard lesion ADC 11, also were determined for each DCIS lesion by dividing lesion ADC values by their respective contralateral normal tissue ADCs. The DWI contrast-to-noise ratio (CNR) between each lesion and normal tissue was calculated for both the diffusion weighted (b = 800 s/mm2) and unweighted (b = 0 s/mm2) images as described previously 12 using the following equation:
| (1) |
where μlesion and μtissue are the mean DWI signal intensities for DCIS and normal tissue ROIs, respectively, and σlesion and σtissue are the corresponding ROI standard deviations. A CNR > 0 indicates higher signal intensity in a lesion compared to normal tissue.
Histopathological and Clinical Data
Pathology reports were reviewed from the patient’s electronic medical record to confirm the final worst pathological diagnosis for each lesion, assessing for upgrade on final surgery, final DCIS nuclear grade, and the presence or absence of comedonecrosis. Lesions were classified by VNPC as previously described 3: VNPC 1 = non-high nuclear grade without comedo-type necrosis, VNPC 2 = non-high nuclear grade with comedo-type necrosis, and VNPC 3 = presence of high nuclear grade with or without comedo-type necrosis. Low risk DCIS was defined as VNPC 1 lesions and high risk DCIS was defined as VNPC 2 or VNPC 3 lesions. Clinical indications and patient age at the time of breast MR examination were also recorded.
Statistical Analysis
Mean diffusion weighted (b = 800 s/mm2) and unweighted (b = 0 s/mm2) CNR, lesion ADC and normalized ADC values, DCE maximum lesion size, and DCE peak initial enhancement were calculated for all DCIS lesions. Differences in these MRI features, as well as DCE morphology (mass versus non-mass enhancement [NME]) and delayed-phase worst curve type (washout, plateau, or persistent) were assessed between low risk and high risk groups with ordinal regression analysis with a random patient effect to account for multiple lesions. Univariate and stepwise multivariate logistic regression modeling were performed to identify DCE and DWI features that optimally discriminated low risk from high risk, and discriminative abilities of models were compared using areas under the receiver operating characteristic curve (AUC). For interpretation purposes, odds ratios were calculated using standardized variable values (calculated by subtracting the group mean and dividing by the standard deviation). All computations were performed using SAS version 9.2 (SAS, Cary, NC). Receiver operating curve (ROC) analysis was performed using MedCalc version 11.5.1.0 (MedCalc Software, Mariakerke, Belgium).
Results
Thirty-six unique pure DCIS lesions in 32 women were included in the study. Eight DCIS lesions were classified as low risk (VNPC 1) while 28 were classified as high risk (eight VNPC 2, and 20 VNPC 3). The average age of women included in the study was 56 ± 10.7 years, Table 1.
Table 1.
Patient and lesion characteristics.
| Characteristic | Mean/Number |
|---|---|
| Age | 56 ± 10.7 years |
| MRI Indication (N= 32 patients) Extent of disease High risk screening Problem solving |
N = 28 N = 2 N = 2 |
| MR BI-RADS Assessment (N = 36 lesions) BI-RADS 4 BI-RADS 5 BI-RADS 6 |
N = 16 N = 0 N = 20 |
| Van Nuys Pathology Classification (VNPC) VNPC 1 VNPC 2 VNPC 3 |
N = 8 N = 8 N = 20 |
MRI features of low risk versus high risk DCIS lesions
While maximum DCE MRI size of high risk DCIS lesions (mean, 33.7 ± 26.5 mm) was greater than low risk lesions (18.3 ± 15.1 mm), this difference did not reach statistical significance (p = 0.08, Table 2). No significant differences in either enhancement kinetic features (peak initial enhancement, worst curve type) or lesion morphology (mass vs. NME) were identified between the two DCIS risk groups (p > 0.05 for all comparisons, Table 2).
Table 2.
Comparisons of DCE MRI features in low risk (VNPC 1) vs. high risk (VNPC 2, 3) DCIS lesions.
| DCE Parameter | Low Risk DCIS mean ± SD or N (%) |
High Risk DCIS mean ± SD or N (%) |
P value |
|---|---|---|---|
| Morphology Non mass enhancement (NME) Mass |
N = 7 (87%) N = 1 (13%) |
N = 23 (82%) N = 5 (18%) |
1.00 |
| Maximum Lesion Size (mm) | 18.3 ± 15.1 | 33.7 ± 26.5 | 0.08 |
| Kinetic Features†
Peak initial enhancement (%) Worst curve type Persistent Plateau Washout |
194.6 ± 59.2 N = 0 (0%) N = 0 (0%) N = 7 (100%) |
207.0 ± 97.5 N = 0 (0%) N = 0 (0%) N = 28 (100%) |
0.73 NA |
Abbreviations: DCE: dynamic contrast enhanced, VNPC: Van Nuys Pathological Classification, DCIS: ductal carcinoma in situ, NA: not applicable
P values calculated by ordinal logistic regression
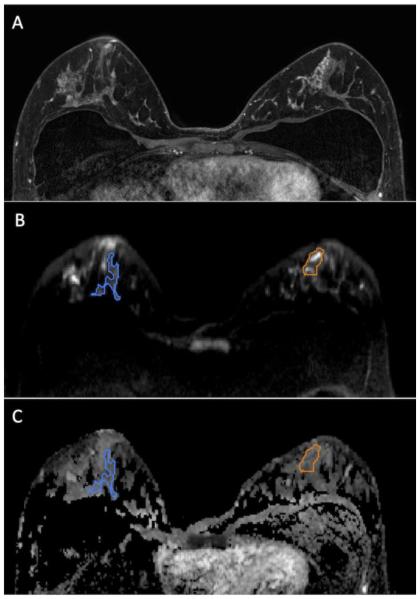
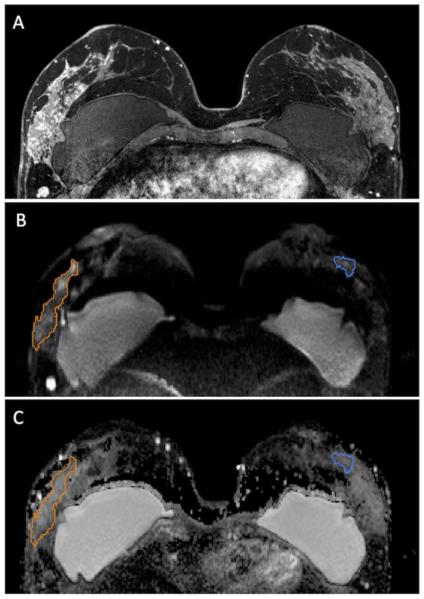
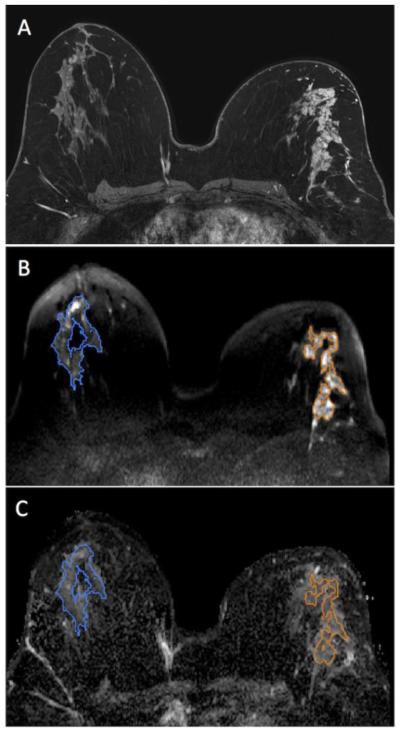
On DWI, low risk DCIS lesions exhibited a significantly higher mean DWI CNR at b = 800 s/mm2 than high risk lesions (3.15 ± 2.33 vs. 1.43 ± 1.58, p = 0.02), with no significant difference in CNR at b = 0 s/mm2 (p = 0.39), Table 3. Low risk DCIS lesions also exhibited lower normalized ADC values than high risk lesions (0.75 ± 0.17 vs. 0.87 ± 0.14, p = 0.04), while differences in lesion ADC values were not significant (p = 0.89). Examples of a low risk (VNPC 1) and two higher risk (VNPC 2 and 3) DCIS lesions on DCE MRI and DWI features are provided in Figures 1-3, respectively.
Table 3.
Comparisons of DWI parameters in low risk (VNPC 1) vs. high risk (VNPC 2, 3) DCIS lesions.
| DWI Parameter | Low Risk DCIS mean ± SD |
High Risk DCIS mean ± SD |
P value |
|---|---|---|---|
|
ADC Values
Lesion ADC (mm2/s) Normalized ADC |
1.41 ± 0.33 × 10⁻³ 75 ± 17 |
1.39 ± 0.24 × 10⁻³ 87 ± 14 |
0.89 0.04* |
|
CNR
b = 800 s/mm2 b = 0 s/mm2 |
3.15 ± 2.33 1.27 ± 1.82 |
1.43 ± 1.58 0.75 ± 1.49 |
0.02* 0.39 |
Abbreviations: DWI: diffusion weighted imaging, VNPC: Van Nuys Pathological Classification, DCIS: ductal carcinoma in situ, ADC: apparent diffusion coefficient, CNR: contrast-to-noise ratio
Indicates statistical significance
P values calculated by ordinal logistic regression
Figure 1.
47 year-old woman with segmental non mass enhancement in the left breast spanning 40 mm on MRI (A), biopsy-proven low risk DCIS (Van Nuys Pathological Classification 1). Diffusion weighted images show a contrast-to-noise ratio of 3.0 (B) with ADC value of 1.46 × 10⁻³ mm2/s and normalized ADC value of 0.80 (C). Note: Normal breast tissue ROI is shown in blue while the ROI for the lesion is shown in orange.
Figure 3.
50 year-old woman with segmental non mass enhancement in the right breast spanning 95 mm on MRI (A). Biopsy yielded high risk DCIS (Van Nuys Pathological Classification 3). Diffuse weighted images show a contrast-to-noise ratio of 3.30 (B) with ADC value of 1.92 × 10⁻³ mm2/s and normalized ADC value of 1.00 (C). Note: Normal breast tissue ROI is shown in blue while the ROI for the lesion is shown in orange.
Discrimination of low risk DCIS from high risk DCIS with Univariate and Multivariate Modeling
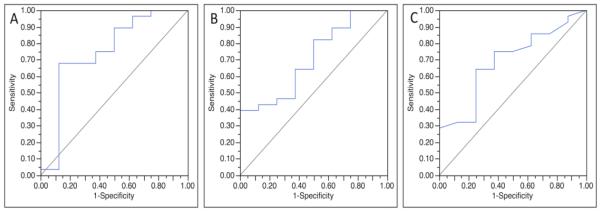
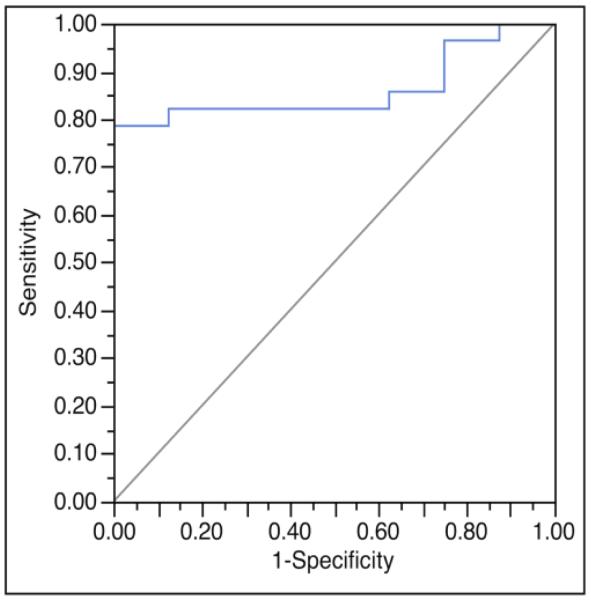
Univariate logistic regression modeling showed normalized ADC values provided the greatest ability to discriminate low risk from high risk DCIS (AUC = 0.75, p = 0.04) among examined MRI features, followed by DWI CNR at b = 800 s/mm2 (AUC = 0.71, p=0.02) and DCE maximum lesion size (AUC = 0.69, p = 0.08), Figure 4. Stepwise multivariate analysis of these individual MRI variables determined that a model combining normalized ADC and DWI CNR at b = 800 s/mm2 discriminated low risk from high risk DCIS lesions more accurately than any single variable, Table 4, (AUC = 0.86, p < 0.01), Figure 5.
Figure 4.
Receiver operating characteristic (ROC) curves for three MRI factors found to have potential to discriminate low risk DCIS from high risk DCIS. Normalized apparent diffusion coefficient (ADC) provided the greatest discriminative ability (area under ROC curve (AUC) = 0.75) (A), followed by diffusion weighted imaging contrast-to-noise ratio (CNR) (AUC = 0.71) (B) and maximum lesion size on dynamic contrast enhanced (DCE) MRI (AUC = 0.69) (C).
Table 4.
Stepwise multivariate logistic regression modeling to predict DCIS risk.
| MRI Parameter | Odds Ratio (CI) | P value | Whole Model AUC |
|---|---|---|---|
| CNR b = 800 s/mm2 | 3.6 (1.2, 16.8) | 0.018 | 0.86 |
| Normalized ADC (%) | 0.33 (0.08, 0.94) | 0.036 |
OR: odds ratio of low vs. high risk, CI: 95% confidence interval.
Note: Odds ratios expressed are for standardized variables (calculated by subtracting the mean and dividing by the standard deviation)
Figure 5.
Receiver operating characteristic (ROC) curves for a multivariate model incorporating normalized apparent diffusion coefficient (ADC) and diffusion weighted imaging (DWI) contrast-to-noise ratio (CNR) to discriminate low risk DCIS from high risk DCIS. This model provided greater discriminative ability when compared to any of the single imaging variables, and yielded an area under the ROC (AUC) of 0.86.
Discussion
While the detection of DCIS represents the identification of the earliest form of breast cancer and is associated with excellent treatment outcomes, many DCIS lesions would never impact a woman’s life if left untreated 13. Because DCIS now accounts for approximately one quarter of new breast cancer diagnoses, it is essential that assays to identify DCIS lesions at low risk for recurrence are identified to decrease unnecessary morbidity associated with aggressive therapy. We have previously identified MRI parameters (DCE MRI maximum size and DWI CNR) that have shown potential to predict DCIS nuclear grade in vivo 8, suggesting MRI features could provide prognostic information in addition to better determination of disease extent. In this study using 3T MRI, we confirm that low risk DCIS lesions, as determined by VNPC, exhibit differences on DWI (greater DWI CNR and lower normalized ADC values) when compared to high risk DCIS lesions.
Initial work by multiple investigators to identify MRI biomarkers of DCIS biology and risk has yielded promising though somewhat conflicting results. In 2007, Kuhl et al demonstrated DCE breast MRI identifies a greater fraction of high nuclear grade DCIS than mammography 14 while Jansen et al showed that DCIS nuclear grade could not be further differentiated by kinetic features 15. Subsequently, Iima et al demonstrated that high ADC values on DWI may be a biomarker of low risk DCIS 16. In our own preliminary work, however, we did not identify a difference in ADC values between DCIS nuclear grades 8, 10 but did identify that high nuclear grade DCIS lesions exhibit lower DWI signal (assessed as lesion to normal tissue CNR at b=600 s/mm2), higher peak initial enhancement at 90 seconds, and greater maximum lesion size on breast MRI than lower nuclear grade lesions 8.
The results from this study provide additional evidence that lower risk DCIS lesions exhibit unique imaging characteristics when compared to higher risk lesions. Our results also suggest that distinct biological properties beyond cellularity (reflected by ADC values) and fluid content (reflected by T2-weighted signal measured by CNR at b = 0 s/mm2) within DCIS lesions are responsible for the unique imaging features present in the DCIS VNPC groups. Since high risk and low risk DCIS lesions in this cohort exhibited similar ADC values, it is possible that either the VNPC does not accurately reflect differences in cellularity among DCIS lesions or that the differences in cellularity among DCIS lesions are too subtle to be detected with DWI. Furthermore, because both MRI features in this study found to be associated with lower risk DCIS incorporated normal tissue measurements (low normalized ADC and high DWI CNR at b = 800 s/mm2) the biological and imaging properties of unaffected breast parenchyma also may hold value in determining DCIS lesion risk. Further work is required to elucidate the specific biological properties of both DCIS lesions and normal tissue that account for these observed imaging differences between DCIS subtypes.
Our study also demonstrated that individual semi-quantitative kinetic parameters provide little value for discriminating low-risk DCIS from higher risk lesions, which agrees with our previous study 8 and the findings of Jansen et al 15. Differences previously identified in peak initial enhancement among DCIS lesions at 1.5T (p = 0.05, 8) did not persist for VNPC discrimination in this study at 3T. However, it should be noted that the center of k-space for the first post-contrast DCE sequence for this protocol at 3T was approximately 30 seconds later than the 1.5T protocol. Further studies with higher temporal resolution DCE MRI allowing pharmacokinetic analysis could be performed to better assess the value of enhancement kinetics for DCIS risk-stratification.
The ability to better determine DCIS aggressiveness in vivo has several potential clinical benefits. Because of their inherent heterogeneity, DCIS lesions are prone to sampling error by core needle biopsy and inter-observer variability in pathological assessment. As a result, imaging parameters that are shown to correlate with important pathology markers could provide in vivo confirmation of worst pathological features prior to treatment. In addition, models that incorporate imaging features with pathological and clinical features may be able to predict which lesions are likely to be upgraded after surgical excision, allowing for improved pre-treatment assessment and planning. Lastly, such an imaging model could prove essential for implementation of more individualized therapies, potentially eliminating radiation therapy and even surgery for select patients.
Our study has several limitations. The slice thickness used for DWI acquisition was 4 mm in order to achieve adequate signal-to-noise, which could result in partial volume averaging. Higher spatial resolution techniques hold potential to improve the ability to characterize DWI features of breast lesions, in particular for the many DCIS lesions presenting with non mass morphology 17. Fifty-six percent of the included DCIS lesions (20/36) were evaluated on MRI after core needle biopsy, and the presence of post-biopsy-changes may have affected the MRI measurements, although care was taken to exclude obvious hematomas and seromas for quantitative measurements. All DWI examinations were performed after the injection of a gadolinium-based contrast agent. There are conflicting reports on the effects of gadolinium agents on calculated ADC values 18-20, and it may be preferable to perform this sequence prior to contrast. Finally, less than quarter of lesions in the cohort (8/36) were low risk by VNPC, and thus our study may have been underpowered to detect some significant differences in imaging features among DCIS groups.
In summary, our study provides additional evidence that DWI features may serve as valuable biomarkers to identify less aggressive forms of DCIS. Other MR parameters, including maximum lesion size on DCE MRI and kinetic enhancement features, failed to demonstrate significant ability to discriminate low risk from higher risk DCIS. Future research is warranted to determine whether MRI biomarkers can aid in predicting clinical outcomes of DCIS treatment, such as risk of local recurrence.
Figure 2.
46 year-old woman with segmental non mass enhancement in the left breast spanning 105 mm on MRI (A). Biopsy yielded higher risk DCIS (Van Nuys Pathological Classification 2). Diffuse weighted images show a contrast-to-noise ratio of 2.29 (B) with ADC value of 1.63 × 10⁻³ mm2/s and normalized ADC value of 1.13 (C). Note: Normal breast tissue ROI is shown in blue while the ROI for the lesion is shown in orange.
Acknowledgments
Funding Support:
This study was supported by grants from the following organizations: National Institutes of Health (NIH): R01CA151326 (Partridge, P.I.) and 5P50CA138293 (source of funds for a Fred Hutchinson Cancer Research Center pilot grant, Rahbar, P.I.); Radiological Society of North America (RSNA): Research Scholar Grant (Rahbar, P.I.)
Footnotes
Publisher's Disclaimer: This is a PDF file of an unedited manuscript that has been accepted for publication. As a service to our customers we are providing this early version of the manuscript. The manuscript will undergo copyediting, typesetting, and review of the resulting proof before it is published in its final citable form. Please note that during the production process errors may be discovered which could affect the content, and all legal disclaimers that apply to the journal pertain.
Previous presentations
This study was presented as an oral scientific abstract at the 2013 annual RSNA meeting in Chicago, IL, USA.
References
- [1].Schnitt SJ, Connolly JL, Tavassoli FA, et al. Interobserver reproducibility in the diagnosis of ductal proliferative breast lesions using standardized criteria. Am J Surg Pathol. 1992;16(12):1133–43. doi: 10.1097/00000478-199212000-00001. [DOI] [PubMed] [Google Scholar]
- [2].Allegra CJ, Aberle DR, Ganschow P, et al. National Institutes of Health State-of-the-Science Conference statement: Diagnosis and Management of Ductal Carcinoma In Situ September 22-24, 2009. Journal of the National Cancer Institute. 2010;102(3):161–9. doi: 10.1093/jnci/djp485. [DOI] [PubMed] [Google Scholar]
- [3].Silverstein MJ, Poller DN, Waisman JR, et al. Prognostic classification of breast ductal carcinoma-in-situ. Lancet. 1995;345(8958):1154–7. doi: 10.1016/s0140-6736(95)90982-6. [DOI] [PubMed] [Google Scholar]
- [4].Silverstein MJ, Lagios MD, Craig PH, et al. A prognostic index for ductal carcinoma in situ of the breast. Cancer. 1996;77(11):2267–74. doi: 10.1002/(SICI)1097-0142(19960601)77:11<2267::AID-CNCR13>3.0.CO;2-V. [DOI] [PubMed] [Google Scholar]
- [5].Yi M, Meric-Bernstam F, Kuerer HM, et al. Evaluation of a breast cancer nomogram for predicting risk of ipsilateral breast tumor recurrences in patients with ductal carcinoma in situ after local excision. Journal of clinical oncology : official journal of the American Society of Clinical Oncology. 2012;30(6):600–7. doi: 10.1200/JCO.2011.36.4976. [DOI] [PMC free article] [PubMed] [Google Scholar]
- [6].MacAusland SG, Hepel JT, Chong FK, et al. An attempt to independently verify the utility of the Van Nuys Prognostic Index for ductal carcinoma in situ. Cancer. 2007;110(12):2648–53. doi: 10.1002/cncr.23089. [DOI] [PubMed] [Google Scholar]
- [7].Miller NA, Chapman JA, Fish EB, et al. In situ duct carcinoma of the breast: clinical and histopathologic factors and association with recurrent carcinoma. The breast journal. 2001;7(5):292–302. doi: 10.1046/j.1524-4741.2001.99124.x. [DOI] [PubMed] [Google Scholar]
- [8].Rahbar H, Partridge SC, Demartini WB, et al. In vivo assessment of ductal carcinoma in situ grade: a model incorporating dynamic contrast-enhanced and diffusion-weighted breast MR imaging parameters. Radiology. 2012;263(2):374–82. doi: 10.1148/radiol.12111368. [DOI] [PMC free article] [PubMed] [Google Scholar]
- [9].D'Orsi CJ, Berg WA. Breast Imaging Reporting and Data System: ACR BI-RADS – Breast Imaging Atlas. 4th. American College of Radiology; Reston, VA: 2003. BI-RADS: Mammography. B.L. [Google Scholar]
- [10].Rahbar H, Partridge SC, Eby PR, et al. Characterization of ductal carcinoma in situ on diffusion weighted breast MRI. European radiology. 2011;21(9):2011–9. doi: 10.1007/s00330-011-2140-4. [DOI] [PubMed] [Google Scholar]
- [11].Ei Khouli RH, Jacobs MA, Mezban SD, et al. Diffusion-weighted imaging improves the diagnostic accuracy of conventional 3.0-T breast MR imaging. Radiology. 2010;256(1):64–73. doi: 10.1148/radiol.10091367. [DOI] [PMC free article] [PubMed] [Google Scholar]
- [12].Bogner W, Gruber S, Pinker K, et al. Diffusion-weighted MR for differentiation of breast lesions at 3.0 T: how does selection of diffusion protocols affect diagnosis? Radiology. 2009;253(2):341–51. doi: 10.1148/radiol.2532081718. [DOI] [PubMed] [Google Scholar]
- [13].Solin LJ. Selecting individualized treatment for patients with ductal carcinoma in situ of the breast: the search continues. Journal of clinical oncology : official journal of the American Society of Clinical Oncology. 2012;30(6):577–9. doi: 10.1200/JCO.2011.39.6929. [DOI] [PubMed] [Google Scholar]
- [14].Kuhl CK, Schrading S, Bieling HB, et al. MRI for diagnosis of pure ductal carcinoma in situ: a prospective observational study. Lancet. 2007;370(9586):485–92. doi: 10.1016/S0140-6736(07)61232-X. [DOI] [PubMed] [Google Scholar]
- [15].Jansen SA, Newstead GM, Abe H, Shimauchi A, Schmidt RA, Karczmar GS. Pure ductal carcinoma in situ: kinetic and morphologic MR characteristics compared with mammographic appearance and nuclear grade. Radiology. 2007;245(3):684–91. doi: 10.1148/radiol.2453062061. [DOI] [PubMed] [Google Scholar]
- [16].Iima M, Le Bihan D, Okumura R, et al. Apparent diffusion coefficient as an MR imaging biomarker of low-risk ductal carcinoma in situ: a pilot study. Radiology. 2011;260(2):364–72. doi: 10.1148/radiol.11101892. [DOI] [PubMed] [Google Scholar]
- [17].Wisner DJ, Rogers N, Deshpande VS, et al. High-resolution diffusion-weighted imaging for the separation of benign from malignant BI-RADS 4/5 lesions found on breast MRI at 3T. Journal of magnetic resonance imaging : JMRI. 2014;40(3):674–81. doi: 10.1002/jmri.24416. [DOI] [PMC free article] [PubMed] [Google Scholar]
- [18].Yuen S, Yamada K, Goto M, Nishida K, Takahata A, Nishimura T. Microperfusion-induced elevation of ADC is suppressed after contrast in breast carcinoma. J Magn Reson Imaging. 2009;29(5):1080–4. doi: 10.1002/jmri.21743. [DOI] [PubMed] [Google Scholar]
- [19].Rubesova E, Grell AS, De Maertelaer V, Metens T, Chao SL, Lemort M. Quantitative diffusion imaging in breast cancer: a clinical prospective study. J Magn Reson Imaging. 2006;24(2):319–24. doi: 10.1002/jmri.20643. [DOI] [PubMed] [Google Scholar]
- [20].Chen G, Jespersen SN, Pedersen M, Pang Q, Horsman MR, Stodkilde-Jorgensen H. Intravenous administration of Gd-DTPA prior to DWI does not affect the apparent diffusion constant. Magn Reson Imaging. 2005;23(5):685–9. doi: 10.1016/j.mri.2005.02.015. [DOI] [PubMed] [Google Scholar]


