

Abstract
Few studies have quantified the dispersion of potentially infectious bioaerosols produced by patients in the health care environment and the exposure of health care workers to these particles. Controlled studies are needed to assess the spread of bioaerosols and the efficacy of different types of respiratory personal protective equipment (PPE) in preventing airborne disease transmission. An environmental chamber was equipped to simulate a patient coughing aerosol particles into a medical examination room, and a health care worker breathing while exposed to these particles. The system has three main parts: (1) a coughing simulator that expels an aerosol-laden cough through a head form; (2) a breathing simulator with a second head form that can be fitted with respiratory PPE; and (3) aerosol particle counters to measure concentrations inside and outside the PPE and at locations throughout the room. Dispersion of aerosol particles with optical diameters from 0.3 to 7.5 μm was evaluated along with the influence of breathing rate, room ventilation, and the locations of the coughing and breathing simulators. Penetration of cough aerosol particles through nine models of surgical masks and respirators placed on the breathing simulator was measured at 32 and 85 L/min flow rates and compared with the results from a standard filter tester. Results show that cough-generated aerosol particles spread rapidly throughout the room, and that within 5 min, a worker anywhere in the room would be exposed to potentially hazardous aerosols. Aerosol exposure is highest with no personal protective equipment, followed by surgical masks, and the least exposure is seen with N95 FFRs. These differences are seen regardless of breathing rate and relative position of the coughing and breathing simulators. These results provide a better understanding of the exposure of workers to cough aerosols from patients and of the relative efficacy of different types of respiratory PPE, and they will assist investigators in providing research-based recommendations for effective respiratory protection strategies in health care settings.
Keywords: airborne particles, airborne transmission, cough, health care workers, respiratory infections/prevention, respiratory protection
INTRODUCTION
Some infectious diseases can spread when people come into contact with aerosol particles containing viable microorganisms that are expelled from the respiratory tract of individuals who are ill. The airborne transmission of disease is of particular concern to the health care community because health care workers are much more likely to be exposed to infectious patients than the general public. For this reason, the dissemination of infectious aerosol particles in health care environments and the efficacy of different types of personal protective equipment (PPE) worn by health care workers is of great interest.
The spread of airborne infectious particles in the indoor environment has been the subject of numerous research papers.(1,2) It is widely agreed that health care workers should wear an N95 filtering-facepiece respirator (N95 FFR) or higher level respirator when they are known to be at risk for the airborne transmission of disease.(3) In the United States, employers are required by the Occupational Safety and Health Administration (OSHA) to provide federally approved respirators to workers when necessary to protect their health. N95 FFR must be certified by the National Institute for Occupational Safety and Health (NIOSH) to filter 95% or more of a 0.3 μm challenge aerosol.
Surgical masks are cleared for sale by the Food and Drug Administration (FDA) but are not certified to provide respiratory protection and generally do not meet the NIOSH filtration criteria.(4,5) However, many questions have been raised as to when workers are actually at risk for airborne disease transmission and about the relative efficacy of different types of PPE against specific illnesses in the health care setting, most notably, influenza.(6–9) During the H1N1 influenza pandemic in 2009, for example, some health organizations such as the Centers for Disease Control and Prevention (CDC) recommended that health care workers wear respirators when treating patients with influenza-like illness, while others such as the World Health Organization (WHO) did not.
Current infection control recommendations for seasonal influenza assume that influenza is spread mainly by large-particle respiratory droplets containing infectious virus that do not travel more than about 6 ft from a patient and that surgical masks provide adequate protection (“large-particle” is not defined in the guidelines, but “small-particle” is later defined as ≤ 5 μm, implying that large-particles are >5 μm).(10) However, a study of influenza patients during the H1N1 pandemic showed that patients produced aerosols that contained influenza virus RNA while coughing and that much of this RNA was contained in small respirable aerosol particles ≤ 4 μm. Cough aerosols from two of these patients contained viable influenza virus.(11) Two air sampling studies have shown that respirable particles containing influenza virus RNA can be found throughout health care facilities,(12,13) and a recent hospital study suggested that small aerosol particles from an influenza patient were blown by an air purifier toward other patients in a hospital ward, leading to additional infections much farther away.(14) Thus, many questions remain as to the risk of exposure to diseases like influenza and the circumstances under which respiratory protection is needed.
Exposure risk for a health care worker depends on a combination of factors, including the relative locations of an infectious patient and a worker, room ventilation, environmental conditions, infectious particle size and quantity, and the type of PPE if any that is worn. Studies that integrate these factors and examine their interactions are needed to better understand the risk of disease transmission and when and where infection control measures are most needed.
One approach to studying these phenomena together is to place manikins in a room with a controlled environment to simulate the dispersion of aerosols from patients and their inhalation by workers. This arrangement allows for studies that include the effects of multiple interacting factors, such as human respiratory patterns, room ventilation, aerosol particle dynamics, and the use of engineering controls and PPE to reduce the exposure of personnel to biohazardous agents.
In one study, Bjorn et al.(15) placed thermal breathing manikins in a room and determined that exhaled air can form a thermally stratified layer that increases its horizontal dispersion. In two studies, Qian et al.(16,17) placed manikins in a mock hospital ward and airborne isolation room and showed that the air jet from patient exhalation, airflows from the ventilation system, and respiratory activities of other individuals in the room interact to distribute aerosol particles. They also found that exhaled jets can travel long distances in some cases, and that commonly used room ventilation schemes are not effective at removing all sizes of aerosol particles. Pantelic et al.(18) used a thermal manikin and coughing simulator to test a personalized ventilation system as protection against simulated cough aerosols and showed that the system offered partial protection, but that cough aerosols were still able to penetrate through it. Diaz and Smaldone(19) put two head forms connected to breathing simulators in a small enclosure, placed facemasks and N95 respirators on the source and recipient head forms, and examined the efficacy of these PPE against radiolabeled aerosol particles. They found that a facemask on the aerosol source head reduced exposure of the recipient to exhaled aerosols, but that a facemask on the receiver offered little protection; a properly fitted N95 respirator protected the receiver, but a poorly fitted respirator did not.
Cough-generated aerosols are an especially important potential path for disease transmission because coughing is a ubiquitous symptom of respiratory infections and because the violent expulsion of air associated with a cough can generate large amounts of aerosol particles and propel them at least 6 ft. For this reason, NIOSH is studying the dispersion of cough-generated aerosol particles in a room and how well PPE such as surgical masks and disposable filtering facepiece respirators (FFR) protect the wearer from such aerosols. Results of these studies will provide a greater understanding of the spread of potentially infectious aerosols from patients and the need for PPE when exposed to bioaerosols, and will assist NIOSH in providing research-based recommendations for effective respiratory protection strategies in health care settings.
METHODS
Filter Penetration
Filter penetration is defined as the fraction of a challenge aerosol that passes through a mask or respirator. Filtration performance of five samples of each of the selected devices was measured at 32, 85, and 95 L/min airflow using a standard filter tester (Model 8130; TSI, Inc., Shoreview, Minn.) with a sodium chloride aerosol (count median diameter 0.075 μm, geometric standard deviation <1.86). The 32 L/min flow rate corresponds to the ISO standard for an adult 1.88 m tall with a mass of 85 kg engaged in moderate work.(20) The 85 L/min flow rate is the current standard used for NIOSH respirator certification testing. The 95 L/min flow rate is the maximum possible with the filter tester and is comparable to the 100 L/min flow rate currently used in NIOSH Chemical, Biological, Radioactive, and Nuclear (CBRN) certification testing to address high work rates and peak respiratory flows.
Respirators and masks were mounted on acrylic or metal plates and sealed with melted beeswax. PPE was tested as received from the manufacturer without any relative humidity pre-treatment. The initial PPE filtration and flow resistance were measured, but the effects of particle loading were not. All studies were conducted at room temperature.
Aerosol Exposure Simulation Chamber
Experiments to simulate the exposure of a respiring health care worker to the aerosol produced by a coughing patient were conducted in a 2.7 m × 2.7 m × 2.4-m-high environmental chamber (Figure 1). The room included a HEPA filtration system to remove airborne particles before and after testing. The coughing simulator, breathing simulator, and aerosol particle counters were controlled from outside the exposure chamber. During experiments, the chamber temperature was 24°C (SD 1.4°C), and relative humidity was 33% (SD 6%).
FIGURE 1.
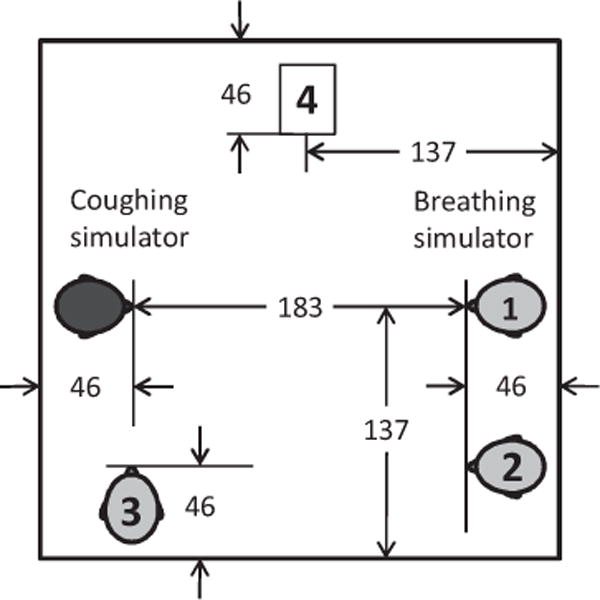
Chamber to simulate exposure of a health care worker to potentially infectious aerosol particles from a coughing patient. Dimensions are in cm. The mouths of the coughing and breathing simulators were located 152 cm above the floor. The breathing simulator was placed in one of the three positions (1–3) indicated on the diagram. Depending on the test, aerosol optical particle counters were located in one or more of Positions 1–4 to monitor the dispersion of the cough aerosol within the room.
Coughing Simulator
A coughing simulator was constructed that uses a metal bellows driven by a computer-controlled linear motor (Model STA2506; Copley Controls, Canton, Mass.) to reproduce the flow and aerosol pattern associated with a human cough. To determine the flow-volume profile to be used for the simulated cough, flow-volume measurements of coughs from 17 healthy adult subjects (10 male, 7 female) in a previous study(21) were examined. One representative cough was selected that was closest to the average volume and peak flow rate. The cough had a 2.1 liter volume with a peak flow of 8.45 L/sec and a mean flow of 2.64 L/sec. In these experiments, the coughing and breathing simulators were synchronized so that each cough was initiated at the start of an inhalation by the breathing simulator.
Breathing Simulator
A digital breathing machine (Warwick Technologies Ltd., Warwick, UK) with a standard medium-sized head form (Sheffield Model 189003; ISI, Lawrenceville, Ga.) was used to simulate a respiring health care worker. The breathing waveform was sinusoidal with flow rates of 32 and 85 L/min. Before each experiment, if the breathing simulator was to be tested using a mask or respirator, the mask or respirator was sealed to the head form using adhesive. Filter penetration through the surgical mask or N95 FFR when mounted on the head form was measured inside the environmental chamber using a standard respirator fit testing device (Model 8038 PortaCount Pro Plus; TSI).
Aerosol Particle Concentration Measurements
During experiments, aerosol particle concentrations in the exposure chamber were continuously monitored using optical particle counters (OPC, Model 1.108; Grimm Technologies, Inc., Douglasville, Ga.). Depending on the experiment, the aerosol particle counters drew aerosol samples from a port above the mouth of the breathing simulator head form (inside the PPE), 10 cm to the left and right of the head form (outside the PPE) at the same height as the mouth (152 cm), and at other locations in the room.
Test Aerosol
The test aerosol was produced by nebulizing a 28% KCl solution using a single-jet Collison nebulizer (BGI, Inc., Waltham, Mass.) at 14 kPa (20 lbs/in.2) and passing the aerosol through a Model 3062 diffusion drier (TSI). The test aerosol was mixed with 4 L/min of dry filtered air and flowed into the cylinder of the coughing simulator until a cough was initiated. The particle size distribution of the nebulizer output was measured using a Grimm OPC with a 100:1 dilutor (Model 1.159-100) and is shown in Figure 2. For the nebulizer output measurement, 10 L/min of dry diluent air was used to keep the particle concentration within the range of the Grimm OPC.
FIGURE 2.
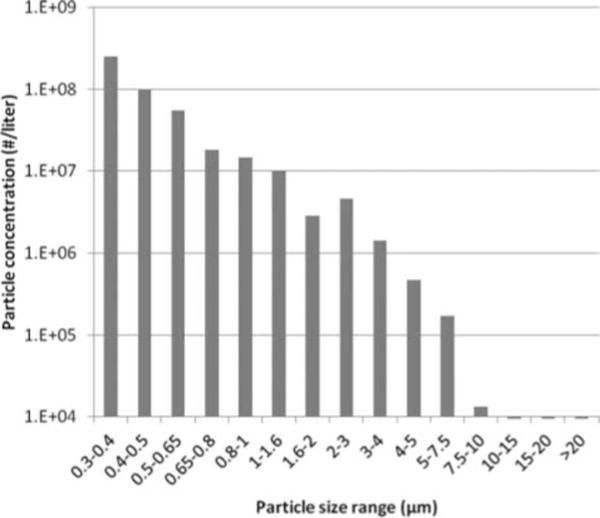
Cough aerosol particle size distribution. The optical size distribution of the aerosol output from the Collison nebulizer using a 28% KCl solution. Over the measurement range of the instrument, the test aerosol had a count median diameter of 0.44 μm and a geometric standard deviation of 1.48. The aerosol particle density is 1.987 g/cm3. The optical diameter is approximately the physical diameter of the particles; because of the density of the particles, the aerodynamic diameter would be about 1.4 times the optical diameter.
Test Procedure
During a typical test, after the coughing and breathing simulators were prepared, the exposure chamber was sealed, data collection from the aerosol particle counters was initiated, and the HEPA filtration system was run for 30 min to reduce the ambient aerosol particle concentration below 100 particles/L of air. The breathing simulator was then started, and the nebulizer was activated for 10 min to load the bellows of the coughing simulator with the test aerosol. After loading, the nebulizer was stopped and a single cough was triggered. Aerosol particle concentration data were collected for 20 min after the cough. A single cough was used in each test for all experiment types (i.e., both within-chamber particle dispersion experiments and experiments examining particle penetration through masks and respirators).
Calculations
For experiments examining the distribution of aerosol particles throughout the room, the particle counts for each size range were summed over 1-min intervals and divided by the instrument flow rate (1.2 L/min) to obtain the average concentration. For exposure chamber experiments examining the penetration of aerosol particles through PPE, one OPC measured the aerosol concentration inside the PPE, and two OPCs measured the aerosol concentration on either side of the breathing head at the same height. For all three OPCs, particle counts for each size range were summed over the time interval from 5 to 20 min after the cough. Penetration was then calculated for each size range by dividing the number of particles counted inside the PPE by the average of the number particles counted by the two external OPCs. The 5- to 20-min time interval was chosen to avoid the initial time period after a cough when large spatial variations in particle concentration are seen, which could affect the particle concentrations at the three probes.
RESULTS
Particle Distribution in the Room After a Cough
The initial experiments in the simulated examination room looked at the distribution of aerosol particles around the room after a cough. For these experiments, three OPCs were placed at different heights 183 cm in front of the coughing simulator, while three others were distributed around the room (Figure 3). During these experiments, the room HEPA filtration system was turned off and the room was sealed, so there were zero air changes/hour (ACH). Immediately after a cough, the OPC directly across from the coughing simulator and at the same height showed a very large spike in aerosol concentration; the average concentration over the first minute was 6.60 × 10⁵ particles/L (SD 1.67 × 10⁵) for 0.3- to 0.4-μm particles (Figure 3) and 1894 particles/L (SD 488) for 3- to 4-μm particles (Figure 4). This initial spike progressively decreased as the measurement location was moved to other locations in the room away from the path of the cough plume. For example, at the lower left corner, the average concentrations over the first minute were 665 particles/L (SD 931) for 0.3- to 0.4-μm particles and 1 particle/L (SD 1) for 3- to 4-μm particles.
FIGURE 3.
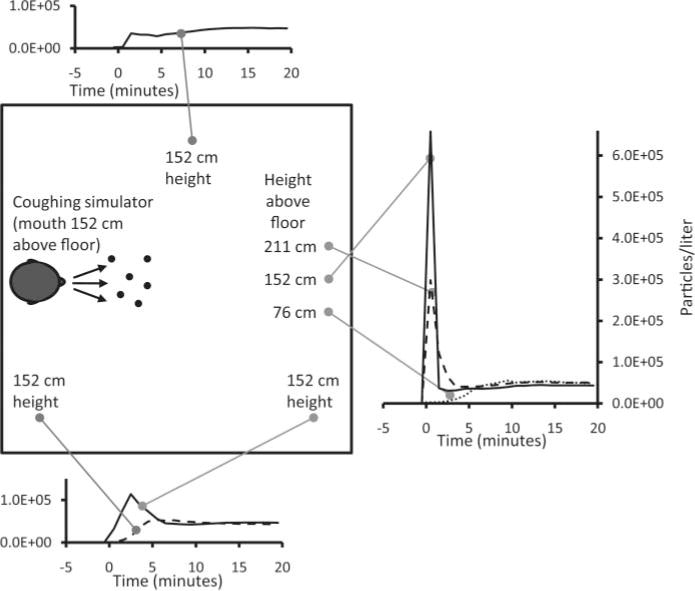
Distribution of 0.3- to 0.4-μm aerosol particles after a cough. This plot shows the concentration of aerosol particles throughout the simulated examination room after a single cough at Time 0. The particle concentration over time is shown at each location for particles with an optical diameter of 0.3 to 0.4 μm. Similar results were seen for other particle sizes. The plots show the average of three experiments.
FIGURE 4.
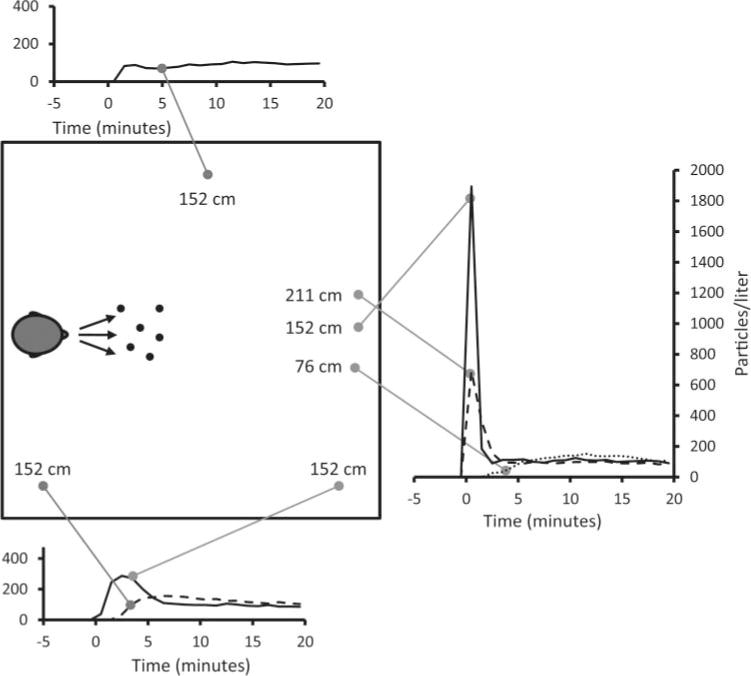
Distribution of 3- to 4-μm aerosol particles after a cough. This plot shows the concentration of aerosol particles throughout the simulated examination room after a single cough at Time 0. The plots show the average of three experiments.
The initial spike also decreased when the measurement location was moved vertically above or below the path of the plume. In the first minute after a cough, the aerosol concentrations varied considerably from location to location, with a coefficient of variation (CV) across all locations of 162% for 0.3- to 0.4-μm particles and 175% for 3- to 4-μm particles. However, as time progressed, aerosol concentrations at all locations converged toward similar steady-state values. After 5, 10, and 15 min, the average concentrations of 0.3- to 0.4-μm particles across all locations were 42105, 46017, and 47807 particles/l (SD 21837, 4893, and 4273). For 3- to 4-μm particles, the 5-, 10-, and 15-min average concentrations were 115, 113, and 102 particles/L (SD 61, 26, and 15). For the 0.3-to 0.4-μm particles, the CV of the aerosol concentration at the different locations was 21% after 5 min and 13% after 10 min. Similar results were seen for other particle sizes, although the steady-state CV tended to be higher; the CV for 3- to 4-μm particles was 30% after 5 min and 18% after 10 min.
Effect of Breathing Simulator Location on Exposure to Cough-Generated Aerosols
For the next set of experiments, the breathing simulator was used to determine the exposure to cough-generated aerosol particles that would occur for a worker in the room without PPE, and the effect of the worker’s location. These experiments were also conducted with zero ACH. The aerosol concentration was measured at the mouth of the breathing simulator. As can be seen in Figure 4, in the immediate aftermath of a cough, the exposure is much higher when the worker is directly in the path of the cough plume. However, after 5 min, the aerosol concentrations at all locations are very similar (CV = 20% after 5 min and 15% after 10 min).
Effect of Room Ventilation
To test the effect of different air exchange rates, experiments were conducted while the room air was circulated through a HEPA filtration system and returned to the room to provide 0, 6, or 12 ACH. In U.S. health care facilities, 6 ACH is the design standard for medical examination and treatment rooms, while 12 ACH is the standard for airborne infection isolation rooms and Emergency Department waiting rooms.(22) The room ventilation system had a ceiling air inlet and a floor-level air outlet and was arranged so that the air flowed from one side of the room to the other. This design was based on the CDC’s general guidelines for airborne infection isolation rooms.(23) Figure 5A shows that, at zero ACH, a sharp initial peak was seen in the particle concentration at the mouth of the breathing simulator after a cough.
FIGURE 5.
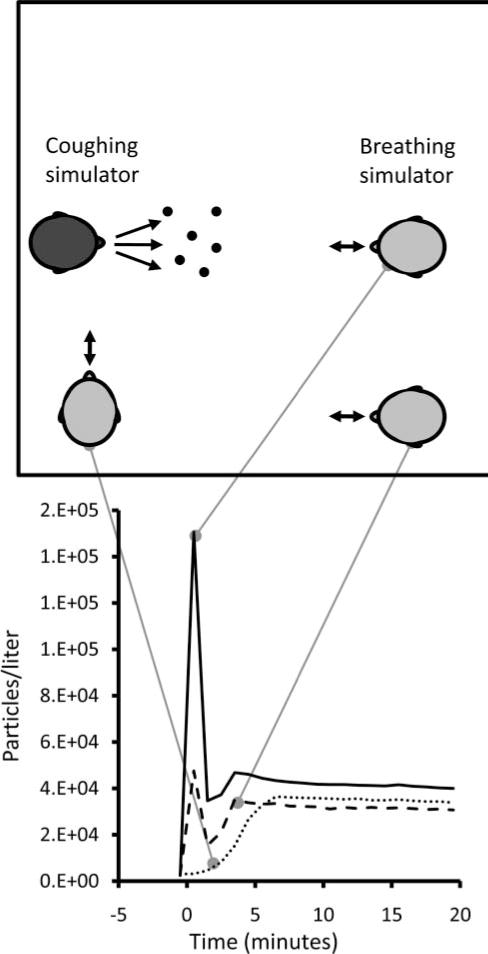
Aerosol exposure at different locations in the chamber. This figure shows the concentration of 0.3- to 0.4-μm particles measured at the mouth of the breathing simulator while it was at different locations in the room. The breathing simulator was breathing at 32 L/min. Similar results were seen for other particle sizes. Each line shows the average of three experiments.
However, at 6 and 12 ACH, this initial peak was greatly attenuated, probably in part because the airflow in the room swept the cough plume down and to the side of the breathing simulator. The aerosol concentration also decreased steadily over time; at 6 ACH, the concentration at the mouth was 9% of the zero ACH value after 20 min, while at 12 ACH the concentration was less than 1% of the zero ACH level after 13 min. Figure 5B shows that cough aerosol particles were dispersed throughout the room at all three air exchange rates, and that the particle concentrations at the second location decreased over time much like the particle concentrations at the mouth of the breathing simulator.
Filtration Efficiency of Different Types of PPE
Nine models of PPE from five manufacturers were chosen for this study based on those in the U.S. Strategic National Stockpile. Three of the PPE chosen were surgical masks, three were approved N95 FFRs, and three were combination N95 FFR/surgical masks. Table I lists the PPE studied and shows the airflow resistance and penetration for each model measured using a standard filter tester. As would be expected, for all PPE the flow resistance and filter penetration consistently increased as flow rate increased. The surgical masks showed a lower flow resistance but much higher aerosol particle penetration than the N95 FFRs, illustrating that surgical masks generally offer less breathing resistance but are not effective filters for small particles even when sealed in place to prevent leakage around the edges of the mask.
TABLE I.
PPE Used in the Study.
| Respiratory Protective Device | Abbreviation | N95? | Surgical Mask? | Airflow Resistance (mm H2O) at
|
% Penetration at
|
||||
|---|---|---|---|---|---|---|---|---|---|
| 32 L/min | 85 L/min | 95 L/min | 32 L/min | 85 L/min | 95 L/min | ||||
| Kimberly-Clark Technol 47080 | KCS470 | No | Yes | 1.3 | 4.9 | 6.0 | 10.2 | 22.0 | 24.8 |
| Kimberly-Clark Technol 47625 | KCS476 | No | Yes | 1.3 | 4.9 | 6.0 | 10.2 | 22.0 | 24.8 |
| Prohibit Surgical Mask | PRS | No | Yes | 1.6 | 5.1 | 4.2 | 12.9 | 21.9 | 28.7 |
| 3M Model 8210 | 3MN8210 | Yes | No | 3.0 | 10.5 | 9.8 | 0.1 | 1.5 | 0.9 |
| Moldex Model 2201 | MON2201 | Yes | No | 4.7 | 11.3 | 13.1 | 0.1 | 1.2 | 0.7 |
| Gerson Model 1730 | GRN1730 | Yes | No | 4.0 | 12.3 | 14.6 | 0.2 | 1.9 | 2.6 |
| 3M Model 1860S | 3MN1860S | Yes | Yes | 3.0 | 9.6 | 10.2 | 0.1 | 0.7 | 0.6 |
| 3M Model 1870 | 3MN1870 | Yes | Yes | 3.2 | 9.5 | 12.1 | 0.0 | 0.2 | 0.3 |
| Kimberly-Clark Technol 46827 | KCN468 | Yes | Yes | 5.9 | 14.5 | 16.3 | 2.4 | 6.1 | 7.0 |
Notes: The table also shows the average airflow resistance and initial penetration measured for each model of PPE (n = 5). “N95” indicates that the PPE has been certified as an N95-class filtering facepiece respirator by NIOSH. “Surgical mask” indicates the PPE has been cleared for sale as a surgical mask by the FDA. Airflow resistance and penetration were measured using a standard filter tester as described in the Filter Penetration subsection of METHODS.
Experiments were performed in the simulated exam room using no PPE on the breathing simulator and with three samples of each of the nine models of PPE shown in Table I. Results for tests conducted while breathing at 32 L/min are shown in Figure 6. When no PPE was worn, the penetration values were very close to 1 for all particle sizes. For all types of PPE, penetration was highest for aerosol particles in the 0.3- to 0.4-μm size range and declined steadily as the particle size increased.
FIGURE 6.
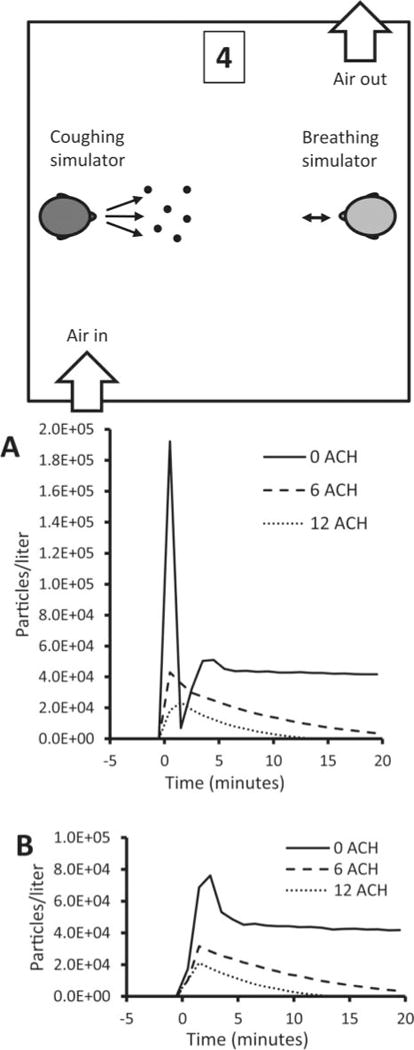
Effect of room ventilation. The concentration of 0.3- to 0.4-μm particles are shown for different room air changes/hour at (A) the mouth of the breathing simulator and (B) Location 4 at the side of the room. The air inlet was located in the ceiling while the outlet was near the floor. The breathing simulator was breathing at 32 L/min. Similar results were seen for other particle sizes. Each line shows the average of three experiments.
Tests were also performed on all PPE at 85 L/min. As with the 32 L/min tests, penetration values were highest for 0.3- to 0.4-μm particles and declined steadily for larger sizes. However, for both the filter tester and the breathing simulator tests, penetration at 85 L/min was consistently higher than seen at 32 L/min. Filter tester penetration values correlated well with the breathing simulator results for 0.3- to 0.4-μm particles (correlation coefficient r2 = 0.94 at 32 L/min and 0.86 at 85 L/min), as seen in Figure 7. Breathing simulator results for 32 and 85 L/min also correlated well (r2=0.95), as did the filter tester results for 32 and 85 L/min (r2 =0.99). As a group, the surgical mask PPE admitted aerosol particles of all sizes at concentrations 22 times higher than the concentrations seen with the N95 and N95/surgical mask PPE at 32 L/min, and 32 times higher at 85 L/min.
FIGURE 7.
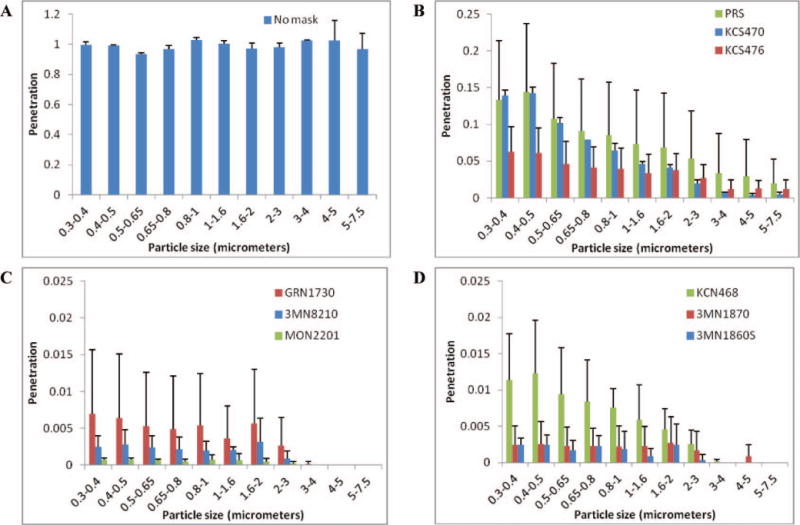
Aerosol penetration through PPE. The aerosol penetration was determined while breathing at 32 L/min and using (A) no PPE; (B) surgical masks; (C) N95 FFRs; and (D) N95 FFR/surgical masks. Note that the vertical scale was adjusted for each plot for clarity. Particle sizes are optical diameters. Each bar shows the average from three samples of each model of PPE. Error bars show the standard deviation.
DISCUSSION
Several respiratory illnesses such as SARS and influenza are thought to spread in part by inhalation of infectious aerosol particles. Health care workers face greater exposure to these hazards than the general public, and their potential risk would be expected to increase during a pandemic precisely when their skills are most critically needed. Thus, there is a need to provide health care workers with respiratory PPE when required. On the other hand, health care workers have reported that respiratory PPE such as N95 FFRs and powered air-purifying respirators (PAPR) can be uncomfortable and interfere with hearing and speech intelligibility.(24,25) Because of this, there is an urgent need to better understand how aerosols from patients spread through the environment, which types of PPE are most effective at protecting workers, and when different types of PPE are necessary.
Our study has shown that aerosol particles from a coughing patient are carried rapidly in the direction of the cough, resulting in an almost immediate exposure to a high concentration of particles for anyone in the path of the cough plume. The wave form seen in Figure 3 at Position 1 is consistent with the change in concentration over time that would be expected at a position downstream from a point of a pulse emission with dispersion by turbulent diffusion and a strong transient advective airflow. These results are consistent with studies of airflow fields produced by human coughs; Zhu et al.(26) and Tang et al.(27) both reported that the flow field from a cough could extend more than 2 m from a subject. However, our results also show that the room air currents generated by the coughing of the patient and breathing of the worker disperse the cough particles throughout the room, and that within several minutes anyone in the room would be exposed to these particles regardless of their location. Thus, our study shows the importance of time scale on the dynamics of exposure: over the short term (up to a few minutes), health care workers and visitors who are directly in front of or close to a coughing patient have much higher average exposure levels, whereas over the longer term, room location of the patient and worker are less influential.
Several previous studies have shown that room ventilation can be an important factor in airborne disease transmission.(1) In our study, room ventilation gradually reduced the aerosol concentration, but even at a relatively high ventilation rate of 12 ACH, with the air blowing diagonally and downward across the room, some exposure to cough aerosols still occurred for several minutes after a cough. These results were found at locations both directly in front of the coughing simulator and away from the initial cough aerosol plume, suggesting that exposure to the cough aerosol would occur anywhere in the room. This is consistent with modeling results reported by Knibbs et al.,(28) although they and other authors also found that the configuration and direction of the ventilation system, and other factors, can have a large impact on exposure and that these factors are difficult to predict and control.(17,29,30) In a similar manner to the time scale discussion above, our results show that ventilation has a much greater effect on exposure over the long term than in the short period immediately after a cough.
Our results from tests of different types of PPE using the standard filter tester and the coughing and breathing simulator reinforce a message that urgently needs to be clearly conveyed to the health care community: surgical masks do not provide protection against small airborne particles, and a properly fitted respirator is needed when exposed to infectious bioaerosols. Even when surgical masks were sealed to the test fixtures, they still allowed large numbers of aerosol particles to pass through their media and be inhaled. These results are consistent with a previous study that also showed the filtration performance of surgical masks varies widely between different models.(4) Further, when surgical masks are actually worn by workers, the protection offered by these devices is reduced even more due to face seal leaks that tend to form around the edges of the mask.(5,31,32) On the other hand, our results show that N95 FFRs can protect a worker from the high aerosol concentration within a cough plume impinging directly on the worker, and the steady-state aerosol that accumulates as the cough aerosol spreads throughout the room. This is true even if the worker is respiring heavily.
Finally, several limitations in our study must be acknowledged. First, the PPE were sealed to the breathing simulator head, which eliminated face seal leakage. This was necessary because the surface of the head is rigid, not compliant like human skin, and thus unsealed PPE do not fit as well and have greater face seal leakage compared with PPE on humans. However, leakage around the face seal of PPE is normal when humans wear surgical masks; this can also occur when humans wear N95 FFR. Thus, our results do overstate the protection that is likely to be provided by PPE in the field, especially for surgical masks. Second, human cough aerosol particles can cover a very broad size range, from tens of nanometers up to hundreds of micrometers.(33) Our study was intended to investigate aerosol particles that were large enough to carry pathogens but small enough to remain airborne, and thus, we examined particles over a much smaller size range. However, it is unclear where cough aerosol particles originate in the respiratory tract and how infectious pathogens are distributed relative to particle size within a cough aerosol.(33–35) Finally, our coughing and breathing simulators operate at room temperature rather than body temperature and therefore do not include any effects due to the buoyancy of the coughing and breathing plumes or air rising due to body heat.
CONCLUSIONS
Health care workers need protection from potentially infectious aerosols such as those produced by coughing patients. However, few studies have attempted to systematically evaluate the spread of cough-generated aerosols in a health care setting and the need for different types of PPE in this environment. Our study used coughing and breathing simulators to create a realistic simulation of a medical examination room with a patient coughing potentially infectious aerosol particles into the room, and a breathing health care worker exposed to them. We used this system to examine the dispersion of cough aerosols in the room and the efficacy of respiratory PPE.
We found that cough aerosols are initially carried in a plume capable of traveling across a room and exposing a worker to a highly concentrated aerosol. However, we also found that after several minutes, aerosol particles across a broad size range will disperse throughout the room, reaching everyone inside. N95 FFRs with no face seal leakage consistently protected the breathing simulator from cough aerosol particles of all sizes even when the aerosol plume impinged directly on the face of the simulator. On the other hand, surgical masks did not provide adequate protection from small particles in cough aerosols even when sealed to the head of the breathing simulator.
Health care workers should be urged to follow existing guidelines for respiratory protection from known bioaerosol sources and should assume that protection is required anywhere in a room with a patient who is producing potentially infectious aerosols. More research is needed to determine whether diseases such as influenza can be transmitted to a significant degree by inhalation of infectious aerosols, to find ways to control and reduce the production and dispersion of potentially infectious aerosol clouds, to examine the possible role of larger ballistic spray droplets in disease transmission, and to study the protection offered by other types of PPE.
FIGURE 8.
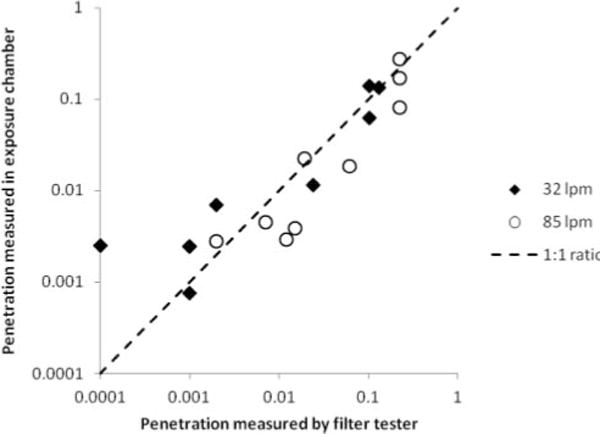
Comparison of filter tester and breathing simulator penetration values at 32 and 85 L/min. Penetration values for all types of PPE tested in the aerosol exposure chamber correlated well with those from the filter tester. Results for the breathing simulator are for particles from 0.3 to 0.4 μm. Penetration values at each flow rate are the average of five PPE samples for the filter tester and three for the breathing simulator.
Acknowledgments
We would like to thank David Edgell of NIOSH for manufacturing the parts for the coughing simulator, and Colleen Miller, Jeffery Palcic, Manivel Rengasamy, Mark Roberge, Richard Vojtko, and Gary Walbert of NIOSH for their assistance in performing these experiments. The findings and conclusions in this report are those of the authors and do not necessarily represent the views of the National Institute for Occupational Safety and Health.
References
- 1.Li Y, Leung GM, Tang JW, et al. Role of ventilation in airborne transmission of infectious agents in the built environment—A multidisciplinary systematic review. Indoor Air. 2007;17(1):2–18. doi: 10.1111/j.1600-0668.2006.00445.x. [DOI] [PubMed] [Google Scholar]
- 2.Tang JW, Li Y, Eames I, Chan PK, Ridgway GL. Factors involved in the aerosol transmission of infection and control of ventilation in health care premises. J Hosp Infect. 2006;64(2):100–114. doi: 10.1016/j.jhin.2006.05.022. [DOI] [PMC free article] [PubMed] [Google Scholar]
- 3.Siegel JD, Rhinehart E, Jackson M, Chiarello L. 2007 Guideline for isolation precautions: Preventing transmission of infectious agents in health care settings. Am J Infect Control. 2007;35(10 Suppl 2):S65–S164. doi: 10.1016/j.ajic.2007.10.007. [DOI] [PMC free article] [PubMed] [Google Scholar]
- 4.Rengasamy A, Miller A, Eimer BC, Shaffer R. Filtration performance of FDA-cleared surgical masks. J Int Soc Respir Prot. 2009;26:54–70. [PMC free article] [PubMed] [Google Scholar]
- 5.Oberg T, Brosseau LM. Surgical mask filter and fit performance. Am J Infect Control. 2008;36(4):276–282. doi: 10.1016/j.ajic.2007.07.008. [DOI] [PMC free article] [PubMed] [Google Scholar]
- 6.Jefferson T, Foxlee R, Del Mar C, et al. Interventions for the interruption or reduction of the spread of respiratory viruses. Cochrane Database Syst Rev. 2007;(4):CD006207. doi: 10.1002/14651858.CD006207.pub2. [DOI] [PubMed] [Google Scholar]
- 7.Cowling BJ, Zhou Y, Ip DK, Leung GM, Aiello AE. Face masks to prevent transmission of influenza virus: A systematic review. Epidemiol Infect. 2010;138(4):449–456. doi: 10.1017/S0950268809991658. [DOI] [PubMed] [Google Scholar]
- 8.Radonovich LJ, Jr, Hodgson MJ, Cohen HJ. Do respirators protect health-care workers from airborne infectious diseases? Respir Care. 2008;53(12):1660–1664. [PubMed] [Google Scholar]
- 9.Liverman CT, Harris TA, Bonnie Rogers ME, Shine KI. Respiratory Protection for Health Care Workers in the Workplace Against Novel H1N1 Influenza A: A Letter Report. Washington, D.C: Institute of Medicine; 2009. p. 68. [Google Scholar]
- 10.Centers for Diseases Control and Prevention (CDC) Prevention Strategies for Seasonal Influenza in Healthcare Settings. Available at http://www.cdc.gov/flu/professionals/infectioncontrol/healthcaresettings.htm (accessed October 20, 2010)
- 11.Lindsley WG, Blachere FM, Thewlis RE, et al. Measurements of airborne influenza virus in aerosol particles from human coughs. PLoS ONE. 2010;5(11):e15100. doi: 10.1371/journal.pone.0015100. [DOI] [PMC free article] [PubMed] [Google Scholar]
- 12.Blachere FM, Lindsley WG, Pearce TA, et al. Measurement of airborne influenza in a hospital emergency department. Clin Infect Dis. 2009;48:438–440. doi: 10.1086/596478. [DOI] [PubMed] [Google Scholar]
- 13.Lindsley WG, Blachere FM, Davis KA, et al. Distribution of airborne influenza virus and respiratory syncytial virus in an urgent care medical clinic. Clin Infect Dis. 2010;50(5):693–698. doi: 10.1086/650457. [DOI] [PubMed] [Google Scholar]
- 14.Wong BCK, Lee N, Li Y, et al. Possible role of aerosol transmission in a hospital outbreak of influenza. Clin Infect Dis. 2010;51(10):1176–1183. doi: 10.1086/656743. [DOI] [PMC free article] [PubMed] [Google Scholar]
- 15.Bjorn E, Nielsen PV. Dispersal of exhaled air and personal exposure in displacement ventilated rooms. Indoor Air. 2002;12(3):147–164. doi: 10.1034/j.1600-0668.2002.08126.x. [DOI] [PubMed] [Google Scholar]
- 16.Qian H, Li Y, Nielsen PV, Hyldgaard CE, Wong TW, Chwang AT. Dispersion of exhaled droplet nuclei in a two-bed hospital ward with three different ventilation systems. Indoor Air. 2006;16(2):111–128. doi: 10.1111/j.1600-0668.2005.00407.x. [DOI] [PubMed] [Google Scholar]
- 17.Qian H, Li Y. Removal of exhaled particles by ventilation and deposition in a multibed airborne infection isolation room. Indoor Air. 2010;20(4):284–297. doi: 10.1111/j.1600-0668.2010.00653.x. [DOI] [PubMed] [Google Scholar]
- 18.Pantelic J, Sze-To GN, Tham KW, Chao CYH, Khoo YCM. Personalized ventilation as a control measure for airborne transmissible disease spread. J R Soc Interface. 2009;6:S715–S726. doi: 10.1098/rsif.2009.0311.focus. [DOI] [PMC free article] [PubMed] [Google Scholar]
- 19.Diaz KT, Smaldone GC. Quantifying exposure risk: Surgical masks and respirators. Am J Infect Control. 2010;38(7):501–508. doi: 10.1016/j.ajic.2010.06.002. [DOI] [PubMed] [Google Scholar]
- 20.International Organization for Standardizatoin (ISO) Respiratory Protective Devices—Human Dactors—Part 1: Metabolic Rates and Respiratory Flow Rates (ISO/TS 16976-1:2007) Geneva: ISO; 2007. [Standard] [Google Scholar]
- 21.Goldsmith WT, Afshari A, Azadi S, Jones B, Frazer D. A system for analyzing aerosols produced by humans during respiratory maneuvers. Ann Biomed Eng. 2001;29(Suppl 1):S141. [Google Scholar]
- 22.American Institute of Architects (AIA) Academy of Architecture for Health. Guidelines for Design and Construction of Hospital and Health Care Facilities. Washington, D.C: American Institute of Architects; 2001. [Google Scholar]
- 23.Centers for Diseases Control and Prevention (CDC) Guidelines for preventing the transmission of mycobacterium tuberculosis in health-care settings. MMWR. 2005;54(RR-17):1–140. [PubMed] [Google Scholar]
- 24.Radonovich LJ, Jr, Cheng J, Shenal BV, Hodgson M, Bender BS. Respirator tolerance in health care workers. JAMA. 2009;301(1):36–38. doi: 10.1001/jama.2008.894. [DOI] [PubMed] [Google Scholar]
- 25.Radonovich LJ, Jr, Yanke R, Cheng J, Bender B. Diminished speech intelligibility associated with certain types of respirators worn by health care workers. J Occup Environ Hyg. 2010;7:63–70. doi: 10.1080/15459620903404803. [DOI] [PubMed] [Google Scholar]
- 26.Zhu S, Kato S. Investigating how viruses are transmitted by coughing. IAQ Applications. 2006;7(2):1–5. [Google Scholar]
- 27.Tang JW, Nicolle AD, Pantelic J, et al. Qualitative real-time Schlieren and shadowgraph imaging of human exhaled airflows: An aid to aerosol infection control. PLoS ONE. 2011;6(6):e21392. doi: 10.1371/journal.pone.0021392. [DOI] [PMC free article] [PubMed] [Google Scholar]
- 28.Knibbs LD, Morawska L, Bell SC, Grzybowski P. Room ventilation and the risk of airborne infection transmission in 3 health care settings within a large teaching hospital. Am J Infect Control. 2011;39(10):866–872. doi: 10.1016/j.ajic.2011.02.014. [DOI] [PMC free article] [PubMed] [Google Scholar]
- 29.Olmedo I, Nielsen PV, Ruiz de Adana M, Jensen RL, Grzelecki P. Distribution of exhaled contaminants and personal exposure in a room using three different air distribution strategies. Indoor Air. 2011;22(1):64–76. doi: 10.1111/j.1600-0668.2011.00736.x. [DOI] [PubMed] [Google Scholar]
- 30.Wan MP, Chao CYH, Ng YD, Sze To GN, Yu WC. Dispersion of expiratory droplets in a general hospital ward with ceiling mixing type mechanical ventilation system. Aerosol Sci Technol. 2007;41(3):244–258. [Google Scholar]
- 31.Lawrence RB, Duling MG, Calvert CA, Coffey CC. Comparison of performance of three different types of respiratory protection devices. J Occup Environ Hyg. 2006;3:465–474. doi: 10.1080/15459620600829211. [DOI] [PubMed] [Google Scholar]
- 32.Lee SA, Grinshpun SA, Reponen T. Respiratory performance offered by N95 respirators and surgical masks: Human subject evaluation with NaCl aerosol representing bacterial and viral particle size range. Ann Occup Hyg. 2008;52(3):177–185. doi: 10.1093/annhyg/men005. [DOI] [PMC free article] [PubMed] [Google Scholar]
- 33.Gralton J, Tovey E, McLaws ML, Rawlinson WD. The role of particle size in aerosolised pathogen transmission: A review. J Infect. 2011;62(1):1–13. doi: 10.1016/j.jinf.2010.11.010. [DOI] [PMC free article] [PubMed] [Google Scholar]
- 34.Morawska L, Johnson GR, Ristovski ZD, et al. Size distribution and sites of origin of droplets expelled from the human respiratory tract during expiratory activities. J Aerosol Sci. 2009;40(3):256–269. [Google Scholar]
- 35.Holmgren H, Bake B, Olin AC, Ljungstrom E. Relation between humidity and size of exhaled particles. J Aerosol Med Pulm Drug Deliv. 2011;24(5):253–260. doi: 10.1089/jamp.2011.0880. [DOI] [PubMed] [Google Scholar]