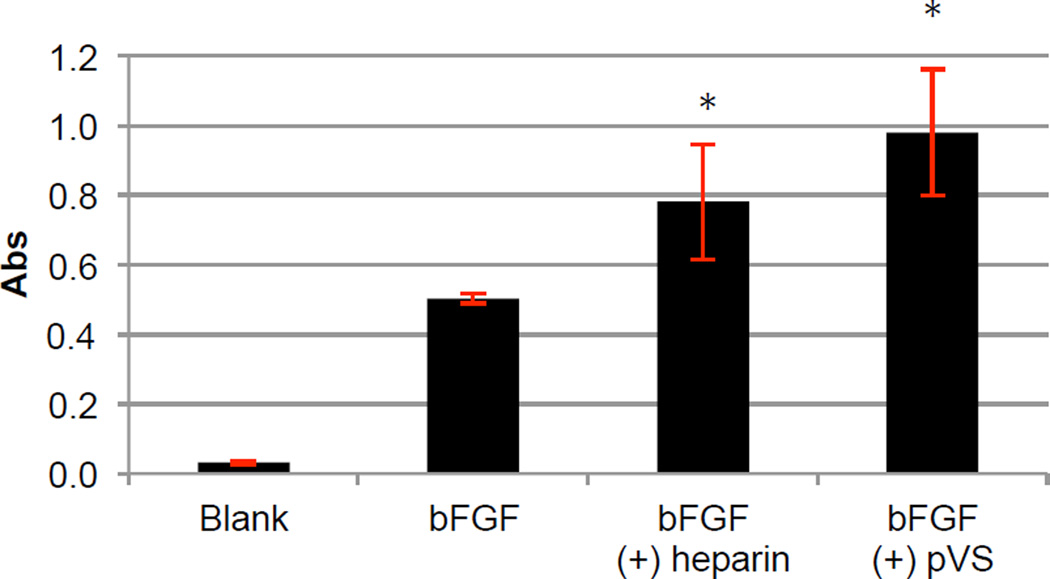
Figure 5.
ELISA-based FGFR-binding assay. FGFR1α(IIIc) was used to coat a 96-well-plate. The wells were treated with various formulations: blank buffer, 1 ng/mL of bFGF with or without 1 µg/mL of heparin or pVS 35.9 kDa. The procedure is detailed in the Methods section. The graphed absorbance was the difference between the signals at λ = 450 nm and the background signals at λ = 630 nm. The experiment was repeated two times, each had n = 3. Error bars represent STDEV. Statistical analysis was performed using Student’s t-test; * p < 0.05 for the ‘bFGF (+) heparin’ and ‘bFGF (+) pVS’ group compared to the control group ‘bFGF’.

