Abstract
Frequently present in pancreatic, colorectal and non-small cell lung carcinomas, oncogenic mutant K-Ras must be localised to the plasma membrane (PM) to be functional. Inhibitors of K-Ras PM localisation are therefore putative cancer chemotherapeutics. By screening a microbial extract library in a high content cell-based assay we detected the rare oligomycin class of Streptomyces polyketides as inhibitors of K-Ras PM localisation. Cultivation and fractionation of three unique oligomycin producing Streptomyces strains yielded oligomycins A–E (1–5) and 21-hydroxy-oligomycin A (6), together with the new 21-hydroxy-oligomycin C (7) and 40-hydroxy-oligomycin B (8). Structures for 1–8 were assigned by detailed spectroscopic analysis. Cancer cell viability screening confirmed 1–8 were cytotoxic to human colorectal carcinoma cells (IC50 >3 μM), and were inhibitors of the ABC transporter efflux pump P-glycoprotein (P-gp), with 5 being comparable in potency to the positive control verapamil. Significantly, oligomycins 1–8 proved to be exceptionally potent inhibitors of K-Ras PM localisation (Emax 0.67–0.75 with an IC50 ~1.5–14 nM).
Introduction
Ras proteins are membrane-bound GTPases that regulate cell growth, proliferation and differentiation. Mutant forms of Ras are prominent in many human cancers.1 For example, of the three ubiquitously expressed mammalian isoforms (H-, N- and K-), constitutively activated mutations of K-Ras are evident in 90% of pancreatic, 45% of colorectal and 35% of non-small cell lung carcinomas.2 Since oncogenic Ras proteins must be localised to the inner leaflet of the plasma membrane (PM) for biological activity,3 clinically acceptable inhibitors of K-Ras PM localisation hold great promise as a means to treat K-Ras mutated cancers.4 Thus, the need to discover new chemical scaffolds capable of mislocalising oncogenic K-Ras remains compelling.
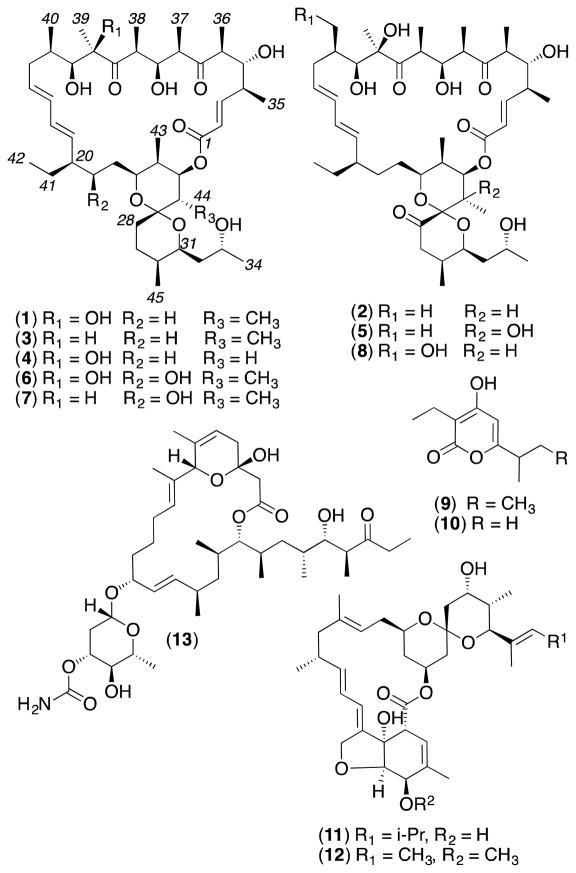
To address this challenge, we examined a library of 500 microbial extracts selected from a library of >300,000 isolates on the basis of their ability to produce secondary metabolites with high chemical diversity. We employed high content quantitative confocal imaging to assess the ability of these extracts to mislocalise oncogenic mutant K-Ras (mGFP-K-Ras G12V) from the PM of intact Madin-Darby canine kidney (MDCK cells).4a In proof of concept studies, we documented staurosporine,4a oxanthromicins5 and neoantimycins6 as promising inhibitors of K-Ras PM localisation. In this report we apply this refined biodiscovery approach to characterise the nM K-Ras mislocalisation properties of the oligomycins, a rare class of polyketide recovered from a soil-derived Streptomyces sp. AS4799 sourced from El Pont de Suert, Spain. As Streptomyces sp. AS4799 was a low yield producer of oligomycins, we turned our attention to three superior oligomycin producing strains selected from our (MST) library. Streptomyces sp. AS5339v11 sourced from Hay, New South Wales (NSW), Australia, exhibited a co-metabolite profile identical to that of AS4799, while Streptomyces sp. AS5958 sourced from Windsor Downs, NSW, and Streptomyces sp. AS5351 sourced from Carnarvon, Western Australia, produced unique secondary metabolite profiles - all inclusive of oligomycins. Collectively these three strains yielded six known (1–6) and two new (7–8) oligomycins, along with germicidins A and B (9–10),7 nemadectins α and γ (11–12)8 and venturicidin A (13)9 (Figure 1).
Fig 1.
Streptomyces metabolites 1 – 13
The oligomycins are polyketides featuring a 26-membered macrocyclic lactone fused to a bicyclic spiroketal (1,7-dioxaspiro[5.5]undecanyl) ring system. The oligomycin complex was first reported in 1954 from a strain of Streptomyces diastatochromogenes,10 with a 1958 account resolving this mixture into oligomycins A–C (1–3), albeit without structure elucidation.11 A 1961 report described antibiotic A272 (rutamycin A), also known as oligomycin D (4), from a strain of S. rutgersensis, again without structure elucidation.12 The structures for 2 and 4 inclusive of relative configurations were subsequently assigned by single-crystal X-ray analysis in 197213 and 1978,14 with absolute configurations confirmed by enantiospecific synthesis in 199315 and 1990,16 respectively. Structures were assigned to 1 and 3 in 1986 based on spectroscopic analysis and correlation of base degradation products with 2,17 with ab initio 1H and 13C NMR assignments reported in 1985 for 1,18 and in 1998 for 2 and 3,19 and X-Ray analyses (inclusive of absolute configurations) reported for 2 in 200820 and 3 in 2010.21 Oligomycin E (5) was reported in 1987 from Streptomyces sp. MCI-2225, and its structure and relative configuration were assigned by NMR analysis.22 A single-crystal X-ray analysis in 2007 established the structure and absolute configuration of 21-hydroxy-oligomycin A (6) isolated from Streptomyces cyaneogriseus ssp. noncyanogenus.23 The structures for several other oligomycins described in the scientific and/or patent literature are largely limited to planar structures. Oligomycins have been attributed antifungal,11 antitumour,22, 24 immunosuppresive,25 and insecticidal and nematocidal26 properties, and have been noted as inhibitors of mitochondrial F0F1-ATPase27 and the ABC transporter multidrug resistance efflux pump P-glycoprotein (P-gp).28
Results and discussion
Bioassay-guided fractionation of cultivations of our three prioritised Streptomyces strains yielded three distinct polyketide profiles, dominated by macrolactones. Streptomyces sp. AS5339v11 yielded oligomycins A–C (1–3) and E (5), germicidins A and B (9–10),7 and low yields of the new 40-hydroxy-oligomycin B (8). Streptomyces sp. AS5351 yielded 21-hydroxy-oligomycin A (6), nemadectin α and γ (11–12),8 and the new 21-hydroxy-oligomycin C (7). Streptomyces sp. AS5958 yielded oligomycin D (4) and venturicidin A (13).9 The structures for the known oligomycins 1–6 and the co-metabolites 9–13 were confirmed by detailed spectroscopic analysis. An account of the structure elucidation of the new oligomycins 7–8, and an assessment of the cytotoxicity and P-gp/K-Ras inhibitory properties of 1–8, is detailed below.
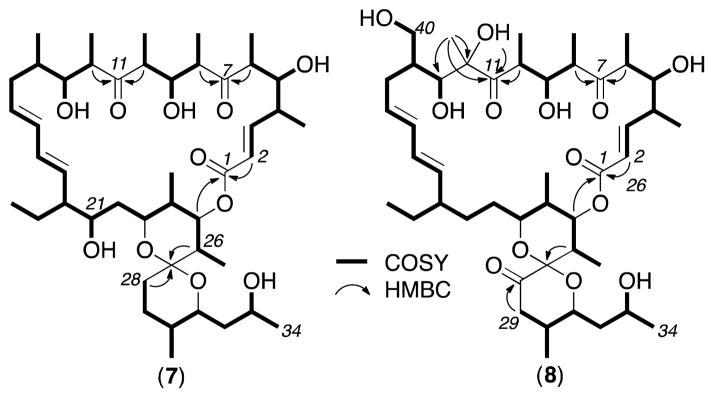
HRESI(+)MS measurements returned a molecular formula for 7 (C45H74O11, Δppm – 0.3) suggestive of a deoxy analogue of the co-metabolite 21-hydroxy-oligomycin A (6). Diagnostic 2D NMR (DMSO-d6) correlations for 7 established a planar structure where the principle difference with 6 was the absence of the 12-OH moiety (Figure 2). This structural relationship was further evidenced in the 1D NMR data (ESI Table S1) where the C-12 tertiary alcohol and pendant tertiary methyl evident in 6 (δH 0.92, s, H3-39; δC 22.0, C-39; 82.6, C-12), was replaced by a secondary methyl in 7 (δH 0.74, d, 6.8 Hz, H3-39; δC 13.3, C-39; 49.4, C-12). Excellent concordance in NMR data (particularly ROESY correlations, ESI Figure S9) between 7 and 6 permitted assignment of the structure (relative configuration) and trivial nomenclature for 21-hydroxy-oligomycin C (7), while comparable specific rotations between 7 (−37.2) and 6 (−39.6), and their occurrence as biosynthetically related co-metabolites in Streptomyces AS5351, was supportive of a common absolute configuration.
Fig 2.
Diagnostic 2D NMR corelations for 7 and 8
HRESI(+)MS analysis of 8 returned a molecular formula (C45H72O13, Δppm – 1.8) isomeric with the Streptomyces AS5339v11 co-metabolite oligomycin E (5). Diagnostic 2D NMR (DMSO-d6) correlations established a planar structure in which the 26-OH in 5 had been replaced by a 40-OH in 8 (Figure 2). This structural relationship was further evidenced in the 1D NMR data (Table S2) with the C-14 secondary methyl (δH 0.99, d, 6.8 Hz, H3-40; δC 33.3, C-14; 14.9, C-40) and C-26 tertiary alcohol (δH 4.11, OH-26; 1.13, s, H3-44; δC 72.7, C-26; 21.0, C-44) in 5 being replaced by a C-14 hydroxymethylene (δH 3.27/3.67, H2-40; δC 40.6, C-14; 60.3, C-40) and a C-26 tertiary methine (δH 2.36, m, H-26; 0.75, d, 6.6 Hz, H3-44; δC 30.9, C-26; 11.5, C-44) in 8. Excellent concordance in the NMR data (particularly ROESY correlations, Figure S10) between 8 and 5 permitted assignment of the structure (relative configuration) and trivial nomenclature for 40-hydroxy-oligomycin B (8), while comparable specific rotations between 8 (−27.9) and 5 (−32.8), and their occurrence as biosynthetically related co-metabolites in Streptomyces AS5339v11, was supportive of a common absolute configuration.
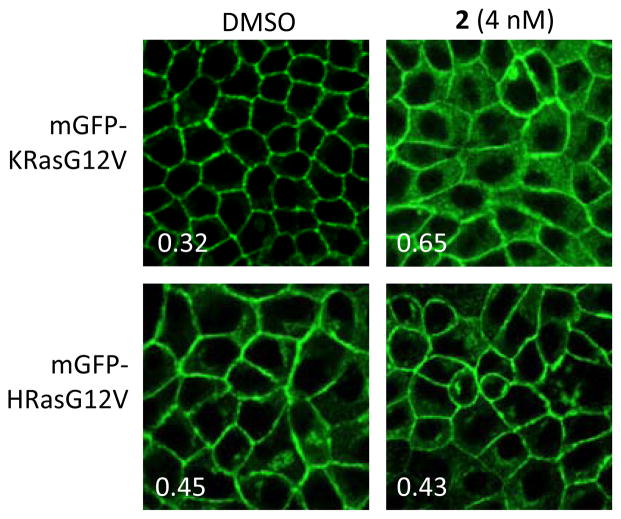
We employed quantitative confocal imaging to measure the ability of 1–8 to mislocalise oncogenic mutant K-Ras (mGFP-K-Ras G12V) from the PM of MDCK cells, using an optimized high content assay methodology.4a MDCK cells stably expressing mGFP-KRasG12V and mCherry-CAAX (an endomembrane marker) were treated with oligomycins for 48 h, and cells were fixed with 4% PFA and imaged by a confocal microscope. K-Ras mislocalisation from the plasma membranes were calculated using Manders coefficients (E), by measuring the fraction of mCherry-CAAX co-localising with mGFP-K-RasG12V (maximum co-localisation gives a value of E=1). Manders coefficients values were evaluated at different oligomycin concentrations. The dose response curve was fitted with a four-parameter non-linear regression curve and IC50 values derived using Prism statistic software (ver5.0c). The Emax value from the same fit reflects the maximum extent of mislocalisation of K-Ras from the plasma membrane to endomembrane. These experiments established, as predicted from primary screening data, that the oligomycins 1–8 were potent (low nM) inhibitors of K-Ras (Table 1), but have minimal effect on H-Ras PM localisation (Figure 3).
Table 1.
Assessment of 1–8 as inhibitors of K-Ras PM localisation in MDCK cell
| Emaxa | IC50 (nM)b | |
|---|---|---|
| 1 | 0.75 ± 0.02 | 1.44 ± 0.03 |
| 2 | 0.67 ± 0.02 | 3.51 ± 0.16 |
| 3 | 0.72 ± 0.03 | 7.25 ± 0.14 |
| 4 | 0.72 ± 0.01 | 3.49 ± 0.08 |
| 5 | 0.73 ± 0.06 | 4.90 ± 0.64 |
| 6 | 0.76 ± 0.04 | 4.82 ± 0.70 |
| 7 | 0.68 ± 0.01 | 14.1 ± 0.24 |
| 8 | 0.73 ± 0.05 | 5.91 ± 1.62 |
Emax = Highest Manders coefficient which describe the maximum extent of K-Ras PM mislocalisation.
IC50 = Concentration needed for 50% PM mislocalisation.
Fig 3.
MDCK cells stably co-expressing mCherry-CAAX and mGFP-KRasG12V or –HRasG12V were treated with 4 nM oligomycin B (2) for 48h. Insert: Manders coefficients for the representative images.
In 2001, oligomycin A (1) was described as among the top 0.1% most cell line selective cytotoxic agent from 37,000 molecules tested against the National Cancer Institute (NCI) panel of 60 human cancer cell lines, with ~35% of cell lines exquisitely sensitive (GI50 10 nM) and the remaining less insensitive (GI50 1–10 μM).29 More recent NCI online data (http://dtp.nci.nih.gov) reveals comparable levels of selective cytotoxicity for 2 and 3 against the same panel of cancer cell lines. In 2004 an (unspecified) oligomycin was described as an inhibitor of the multidrug resistance efflux pump P-glycoprotein (P-gp).28 To the best of our knowledge there have been no accounts on the P-gp inhibitory properties of specific oligomycins.
As up-regulation of P-gp in cancers can lead to accelerated drug efflux from cells, it is important to assess potential drug candidates for susceptibility to P-gp mediated efflux. To investigate the susceptibility of 1–8 we employed a resazurin cell viability assay to quantify cytotoxicity against the colon cancer cell line SW620, and its P-gp over-expressing daughter cell line SW620 Ad300. To validate our approach, we first confirmed that SW620 Ad300 cells were 22-fold less sensitive (FR = 22) to doxorubicin (adriamycin) than the parent SW620 cells, and that co-administration of the positive control P-gp inhibitor verapamil increased the sensitivity of the SW620 Ad300 cells to doxorubicin (FR = 2.4). Armed with a validated assay we determined that 1–8 were moderately cytotoxic towards both SW620 and SW620 Ad300 cells (IC50 >3 μM), and were not subject to P-gp mediated efflux (FR = 0.27–1.2) (Table 2).
Table 2.
Assessment of 1–8 for cytotoxicity and susceptibility to P-gp mediated efflux
| SW620 IC50 (μM) | SW620 Ad300 IC50 (μM) | FRa | |
|---|---|---|---|
| 1 | 14.6 ± 2.5 | 4.0 ± 1.1 | 0.27 |
| 2 | 17.0 ± 0.6 | 12.9 ± 1.3 | 0.76 |
| 3 | 19.8 ± 1.2 | 22.5 ± 3.8 | 1.1 |
| 4 | 36.0 ± 2.3 | 12.9 ± 1.0 | 0.35 |
| 5 | 7.1 ± 0.4 | 4.0 ± 0.8 | 0.56 |
| 6 | 14.4 ± 0.6 | 11.8 ± 3.1 | 0.82 |
| 7 | 5.7 ± 0.9 | 3.1 ± 0.2 | 0.54 |
| 8 | 13.6 ± 0.4 | 16.4 ± 1.5 | 1.2 |
FR = fold resistance, calculated as the ratio IC50 SW620Ad300 / IC50 SW620.
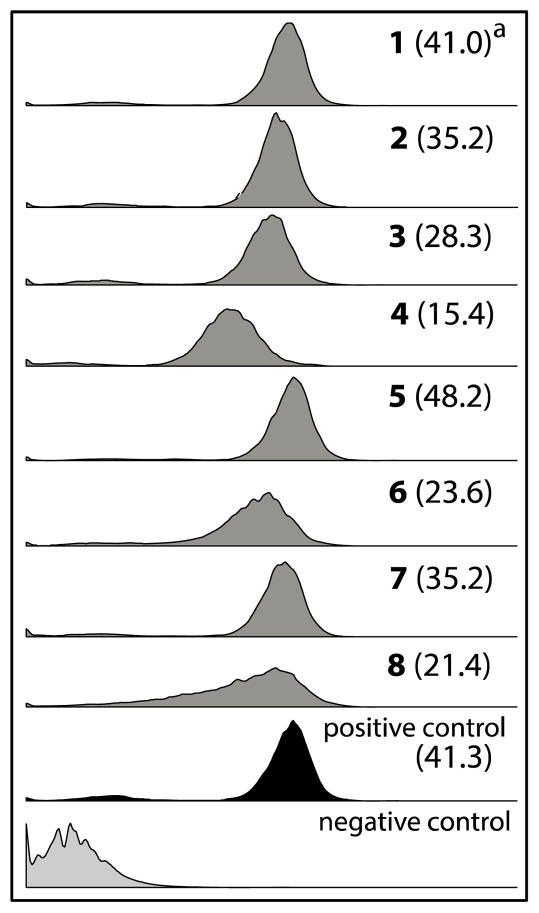
To further investigate the relationship between 1–8 and P-gp we employed a calcein AM flow cytometry assay, using a methodology optimized and documented during earlier studies.30 Briefly, the non-fluorescent reagent calcein AM is both a P-gp substrate and undergoes intracellular hydrolysis by esterases to yield the fluorescent dye calcein. Functioning P-gp mediates efflux of calcein AM prior to hydrolysis, resulting in reduced levels of intracellular fluorescence. In the presence of a P-gp inhibitor, calcein AM efflux is blocked, resulting in higher levels of intracellular fluorescence. In the flow cytometry assay, 1–8 (20 μM) increased intracellular calcein fluorescence significantly compared to the negative control (Figure 4) (fluorescence arbitrary ratios (FAR) = 15–48). In these studies, 5 is the most potent P-gp inhibitor (FAR = 48.2), comparable to the positive control verapamil (FAR = 41.3).
Fig 4.
The effect of oligomycins on the accumulation of calcein AM in P-gp over-expressing SW620 Ad300 cells analysed using flow cytometry. aFAR (fluorescence arbitrary ratio) = calcein fluorescence intensity (geometric mean) in the presence of 1–8 (20 μM) / phosphate buffer saline (negative control). Positive and negative controls are verapamil (20 μM) and PBS, respectively.
Conclusions
This current study validates microbial biodiscovery supported by high content quantitative confocal imaging as an effective means to discover new inhibitors of oncogenic K-Ras PM localisation. By applying this strategy we successfully detected, sourced, isolated, characterised and identified six known (1–6) and two new (7–8) oligomycins, along with the co-metabolites 9–13, from three diverse soil-derived Streptomyces strains, and established 1–8 as μM inhibitors of the multidrug efflux pump P-gp, and low nM inhibitors of K-Ras PM localisation. Ongoing investigations into the K-Ras inhibitory mechanism of action of 1–8 are expected to reveal pathways and molecular targets critical to controlling K-Ras. Our investigations into the K-Ras PM mislocalisation mechanism–of–action of 1–8 are nearing completion, and will be published elsewhere. Knowledge of the inhibitor properties of oligomycins 1–8 on K-Ras could inform the development of new probes to better interrogate, and new therapeutics to better treat, K-Ras dependent cancers.
Experimental section
Characterisation of compounds
oligomycin A (1)
Colourless amorphous solid; [α]D22−47.3 (c = 0.083, MeOH); 1H & 13C NMR (DMSO-d6) see Tables S3a and 4, and Figures S1a and S1b; HRESI(+)MS m/z 813.5126 [M+Na]+ (calcd for C45H74O11Na, 813.5123).
oligomycin B (2)
Colourless amorphous solid; [α]D22 −67.0 (c = 0.115, MeOH); 1H & 13C NMR (DMSO-d6) see Tables S3a and 4, and Figures S2a and S2b; HRESI(+)MS m/z 827.4909 [M+Na]+ (calcd for C45H72O12Na, 827.4916).
oligomycin C (3)
Colourless amorphous solid; [α]D22−36.8 (c = 0.15, MeOH); 1H & 13C NMR (DMSO-d6) see Tables S3b and 4, and Figures S3a and S3b; HRESI(+)MS m/z 797.5181 [M+Na]+ (calcd for C45H74O10Na, 797.5174).
oligomycin D (4)
Colourless amorphous solid; [α]D22−29.5 (c = 0.075, MeOH); 1H & 13C NMR (DMSO-d6) see Tables S3b and 4, and Figures S4a and S4b; HRESI(+)MS m/z 799.4968 [M+Na]+ (calcd for C44H72O11Na, 799.4967).
oligomycin E (5)
Colourless amorphous solid; [α]D22−32.8 (c = 0.13, MeOH); 1H & 13C NMR (DMSO-d6) see Tables S3b and 4, and Figures S5a and S5b; HRESI(+)MS m/z 843.4853 [M+Na]+ (calcd for C45H72O13Na, 843.4865).
21-hydroxy-oligomycin A (6)
Colourless amorphous solid; [α]D22−39.6 (c = 0.24, MeOH); 1H & 13C NMR (DMSO-d6) see Tables S3a and 4, and Figures S6a and S6b; HRESI(+)MS m/z 829.5067 [M+Na]+ (calcd for C45H74O12Na, 829.5072).
21-hydroxy-oligomycin C (7)
Colourless amorphous solid; [α]D22−37.2 (c = 0.105, MeOH); NMR (DMSO-d6) see Table S1, and Figures S7a and S7b; HRESI(+)MS m/z 813.5120 [M+Na]+ (calcd for C45H74O11Na, 813.5123).
40-hydroxy-oligomycin B (8)
Colourless amorphous solid; [α]D22−27.9 (c = 0.14, MeOH); NMR (DMSO-d6) see Table S2, and Figures S8a and S8b; HRESI(+)MS m/z 843.4847 [M+Na]+ (calcd for C45H72O13Na, 843.4865).
germicidin A (9)
Yellow amorphous solid. NMR (CDCl3) see Figures S12; HRESI(+)MS m/z 219.0991 [M+Na]+ (calcd for C11H16O3Na, 219.0992).
germicidin B (10)
Yellow amorphous solid. NMR (CDCl3) see Figures S13; HRESI(+)MS m/z 205.0831 [M+Na]+ (calcd for C10H14O3Na, 205.0835).
nemadectin α (11)
White amorphous solid. NMR (CDCl3) see Figures S14; HRESI(+)MS m/z 635.3538 [M+Na]+ (calcd for C36H52O8Na, 635.3554).
nemadectin γ (12)
White amorphous solid. NMR (CDCl3) see Figures S15; HRESI(+)MS m/z 621.3416 [M+Na]+ (calcd for C35H50O8Na, 621.3398).
venturicidin A (13)
Colourless amorphous solid. NMR (CDCl3) see Figures S16; HRESI(+)MS m/z 772.4607 [M+Na]+ (calcd for C41H67O11Na, 772.4606).
Supplementary Material
Acknowledgments
We thank S.E. Bates and R.W. Robey (NIH, Bethesda, MD) for providing SW620 and SW620 Ad300. This research was funded in part by the University of Queensland, the Institute for Molecular Bioscience, the Cancer Prevention and Research Institute of Texas (RP130059), NIH Pathway to Independence Award (1K99-CA188593) and the Australian Research Council (DP120100183 and LP120100088).
Footnotes
Electronic Supplementary Information (ESI) available: General experimental details, full details of microbial collection and taxonomy, tabulated 2D NMR data, NMR spectra and bioassays procedures. See DOI: 10.1039/x0xx00000x
Notes and references
- 1.Hancock JF. Nat Rev Mol Cell Biol. 2003;4:373–385. doi: 10.1038/nrm1105. [DOI] [PubMed] [Google Scholar]
- 2.Bodemann BO, White MA. Curr Biol. 2013;23:R17–R20. doi: 10.1016/j.cub.2012.11.054. [DOI] [PubMed] [Google Scholar]
- 3.Baines AT, Xu D, Der CJ. Future Med Chem. 2011;3:1787–1808. doi: 10.4155/fmc.11.121. [DOI] [PMC free article] [PubMed] [Google Scholar]
- 4.(a) Cho K-j, Park J-H, Piggott AM, Salim AA, Gorfe AA, Parton RG, Capon RJ, Lacey E, Hancock JF. J Biol Chem. 2012;287:43573–43584. doi: 10.1074/jbc.M112.424457. [DOI] [PMC free article] [PubMed] [Google Scholar]; (b) van der Hoeven D, Cho K-j, Ma X, Chigurupati S, Parton RG, Hancock JF. Mol Cell Biol. 2013;33:237–251. doi: 10.1128/MCB.00884-12. [DOI] [PMC free article] [PubMed] [Google Scholar]
- 5.Salim AA, Xiao X, Cho KJ, Piggott AM, Lacey E, Hancock JF, Capon RJ. Org Biomol Chem. 2014;12:4872–4878. doi: 10.1039/c4ob00745j. [DOI] [PMC free article] [PubMed] [Google Scholar]
- 6.Salim AA, Cho KJ, Tan L, Quezada M, Lacey E, Hancock JF, Capon RJ. Org Lett. 2014;16:5036–5039. doi: 10.1021/ol502376e. [DOI] [PMC free article] [PubMed] [Google Scholar]
- 7.Petersen F, Zaehner H, Metzger JW, Freund S, Hummel RP. J Antibiot. 1993;46:1126–1138. doi: 10.7164/antibiotics.46.1126. [DOI] [PubMed] [Google Scholar]
- 8.(a) Carter GT, Nietsche JA, Borders DB. J Chem Soc, Chem Commun. 1987:402–404. [Google Scholar]; (b) Lo LC, Berova N, Nakanishi K, Schlingmann G, Carter GT, Borders DB. J Am Chem Soc. 1992;114:7371–7374. [Google Scholar]
- 9.(a) Brufani M, Cellai L, Musu C, Keller-Schierlein W. Helv Chim Acta. 1972;55:2329–2346. doi: 10.1002/hlca.19720550706. [DOI] [PubMed] [Google Scholar]; (b) Rhodes A, Fantes KH, Boothroyd B, McGonagle MP, Crosse R. Nature. 1961;192:952–954. doi: 10.1038/192952a0. [DOI] [PubMed] [Google Scholar]
- 10.Smith RM, Peterson WH, McCoy E. Antibiot Chemother. 1954;4:962–970. [PubMed] [Google Scholar]
- 11.Masamune S, Sehgal JM, Van Tamelen EE, Strong FM, Peterson WH. J Am Chem Soc. 1958;80:6092–6095. [Google Scholar]
- 12.(a) Thompson RQ, Hoehn MM, Higgens CE. Antimicrob Agents Chemother. 1961:474–480. [Google Scholar]; (b) Shaw PD. In: Antibiotics. Gottlieb D, Shaw PD, editors. Vol. 1. Springer-Verlag; Berlin: 1967. pp. 585–610. [Google Scholar]
- 13.Von Glehn M, Norrestam R, Kierkegaard P, Maron L, Ernster L. FEBS Lett. 1972;20:267–269. doi: 10.1016/0014-5793(72)80083-8. [DOI] [PubMed] [Google Scholar]
- 14.Arnoux B, Garcia-Alvarez MC, Marazano C, Das BC, Pascard C, Merienne C, Staron T. J Chem Soc, Chem Commun. 1978:318–319. [Google Scholar]
- 15.Nakata M, Ishiyama T, Hirose Y, Maruoka H, Tatsuta K. Tetrahedron Lett. 1993;34:8439–8442. [Google Scholar]
- 16.Evans DA, Rieger DL, Jones TK, Kaldor SW. J Org Chem. 1990;55:6260–6268. [Google Scholar]
- 17.Carter GT. J Org Chem. 1986;51:4264–4271. [Google Scholar]
- 18.Morris GA, Richards MS. Magn Reson Chem. 1985;23:676–683. [Google Scholar]
- 19.Szilagyi L, Feher K. J Mol Struct. 1998;471:195–207. [Google Scholar]
- 20.Palmer RA, Potter BS. J Chem Crystallogr. 2008;38:243–253. [Google Scholar]
- 21.Yang PW, Li MG, Zhao JY, Zhu MZ, Shang H, Li JR, Cui XL, Huang R, Wen ML. Folia Microbiol. 2010;55:10–16. doi: 10.1007/s12223-010-0002-0. [DOI] [PubMed] [Google Scholar]
- 22.Kobayashi K, Nishino C, Ohya J, Sato S, Mikawa T, Shiobara Y, Kodama M, Nishimoto N. J Antibiot. 1987;40:1053–1057. doi: 10.7164/antibiotics.40.1053. [DOI] [PubMed] [Google Scholar]
- 23.Wagenaar MM, Williamson RT, Ho DM, Carter GT. J Nat Prod. 2007;70:367–371. doi: 10.1021/np060519u. [DOI] [PubMed] [Google Scholar]
- 24.Yamazaki M, Yamashita T, Harada T, Nishikiori T, Saito S, Shimada N, Fujii A. J Antibiot. 1992;45:171–179. doi: 10.7164/antibiotics.45.171. [DOI] [PubMed] [Google Scholar]
- 25.Laatsch H, Kellner M, Wolf G, Lee YS, Hansske F, Konetschny-Rapp S, Pessara U, Scheuer W, Stockinger H. J Antibiot. 1993;46:1334–1341. doi: 10.7164/antibiotics.46.1334. [DOI] [PubMed] [Google Scholar]
- 26.Enomoto Y, Shiomi K, Matsumoto A, Takahashi Y, Iwai Y, Harder A, Kolbl H, Woodruff HB, Omura S. J Antibiot. 2001;54:308–313. doi: 10.7164/antibiotics.54.308. [DOI] [PubMed] [Google Scholar]
- 27.(a) Penefsky HS. Proc Natl Acad Sci U S A. 1985;82:1589–1593. doi: 10.1073/pnas.82.6.1589. [DOI] [PMC free article] [PubMed] [Google Scholar]; (b) Symersky J, Osowski D, Walters DE, Mueller David M. Proc Natl Acad Sci U S A. 2012;109:13961–13965. doi: 10.1073/pnas.1207912109. [DOI] [PMC free article] [PubMed] [Google Scholar]
- 28.Li YC, Fung KP, Kwok TT, Lee CY, Suen YK, Kong SK. Chemotherapy. 2004;50:55–62. doi: 10.1159/000077803. [DOI] [PubMed] [Google Scholar]
- 29.Salomon AR, Voehringer DW, Herzenberg LA, Khosla C. Chem Biol. 2001;8:71–80. doi: 10.1016/s1074-5521(00)00057-0. [DOI] [PubMed] [Google Scholar]
- 30.(a) Huang X-c, Sun Y-L, Salim AA, Chen Z-S, Capon RJ. Biochem Pharmacol. 2013;85:1257–1268. doi: 10.1016/j.bcp.2013.02.005. [DOI] [PubMed] [Google Scholar]; (b) Henrich CJ, Bokesch HR, Dean M, Bates SE, Robey RW, Goncharova EI, Wilson JA, McMahon JB. J Biomol Screening. 2006;11:176–183. doi: 10.1177/1087057105284576. [DOI] [PubMed] [Google Scholar]
Associated Data
This section collects any data citations, data availability statements, or supplementary materials included in this article.


