Abstract
Purpose
Metabolic response to treatment measured by FDG PET has prognostic implications in many cancers. This study investigated the association between survival and early changes on FDG PET/CT for patients with BRAF-mutant melanoma receiving combined BRAF and MEK inhibition therapy.
Material/Methods
24 patients with advanced BRAF-mutant melanoma were included. Patients were treated with a BRAF inhibitor (Vemurafenib or Dabrafenib) and a MEK inhibitor (Cobimetinib or Trametinib) and were imaged at baseline, and shortly thereafter with FDG PET/CT. Each scan yielded two values of SUVmax: one for the most metabolically active focus and one for the least responsive focus. Short-term treatment response was assessed by evaluating the target lesions using EROTC criteria. A Cox proportional hazards model was used to examine associations between overall survival (OS) and progression-free survival (PFS) and changes in SUVmax.
Results
Mean time to follow-up FDG PET/CT was 26 days. At follow-up, 2 patients had a complete response. For the most metabolically active focus, 22 patients had a partial response. For the least responsive focus, 18 patients had a partial response, 2 had stable disease, and 2 had progressive disease.
16 patients were living at the end of the study. For the most metabolically active tumor, no association was observed between changes in SUVmax and OS (p=0.73) or PFS (p=0.17). For the least responsive tumor, change in SUVmax was associated with PFS (HR=1.34, 95% CI: 1.06 to 1.71, p=0.01) but not OS (p=0.52). ECOG score was associated with OS (HR=11.81, 95% CI: 1.42 to 97.60, p=0.02) and PFS (HR=24.72, 95% CI: 3.23 to 189.42, p=0.002).
Conclusion
Change in SUVmax for the least responsive tumor and baseline functional performance may be useful prognostic indicators for progression-free survival in patients with BRAF-mutant melanoma.
Keywords: melanoma, FDG, PET/CT, BRAF, MEK, vemurafenib, dabrafenib, cobimetinib, trametinib
Introduction
18F-FDG PET/CT is a powerful imaging tool widely used to stage and evaluate treatment response in multiple malignancies such as melanoma, breast cancer, lung cancer, lymphoma, and head/neck cancers. Primary tumor maximum standardized uptake value (SUVmax) has been shown to have prognostic implications in non-small cell lung cancer [1,2]. In patients with lymphoma, FDG PET/CT provides valuable early monitoring of treatment response allowing patient-specific tailoring of therapies [3–6]. In addition to providing evidence of early treatment response, FDG PET/CT can provide significant post-therapeutic prognostic implications; in a cohort of post-treatment lymphoma patients, FDG positive patients had a 53.2% event-free survival at 3 years as compared to 90.5% for FDG-negative patients [4]. Similarly, complete remission on FDG PET/CT examination in patients treated for head and neck cancer correlated significantly with progression-free status [15]. Beyond post-treatment FDG prognostic implications, relative changes in FDG uptake between scans during treatment demonstrate prognostic implications with regard to histopathologic response in breast cancer [7–9] and even survival in patients with treated hepatic metastases from breast cancer [10]. Similar “in-treatment” FDG response prognostic data has been found in NSCLC patients treated with erlotinib [11–14].
In patients with metastatic melanoma treated with chemotherapy, a positive treatment response (defined as a decrease in size and FDG uptake of metastases of at least 30%), on follow-up FDG PET/CT examinations correlated with a significantly longer 1 year survival (80% vs. 40%) and median survival (18 months vs. 11 months) when compared to non-responders [16].
In addition to chemotherapy, relatively new tools in the oncologist’s arsenal of melanoma therapeutics include targeted cancer therapies in which small molecules interfere with altered, constitutively activated proteins and inhibit abnormal cellular proliferation of cancer cells. Examples of altered proteins constitutively activated in melanoma include BRAF kinase and MEK kinase. Altered BRAF kinase has been identified in 50–68% of cutaneous metastatic melanoma lesions. BRAF kinase mutations result in abnormal activation of the RAS-RAF pathway and promotion of tumor growth [17–20]. Vemurafenib and dabrafenib are FDA approved BRAF inhibitors for the treatment of BRAF-mutant melanoma. Inhibition of BRAF by vemurafenib in patients with melanoma has resulted in better treatment response and improved overall survival compared with conventional chemotherapy [21]. MEK kinase is a substrate of BRAF and its inhibition by molecules including GDC-0973 (Cobimetinib©, Roche-Genetech) has resulted in reduced cellular proliferation among other anti-neoplastic properties during in vitro studies [22]. Trametinib is another MEK kinase inhibitor and is FDA approved for the treatment of BRAF-mutant melanoma in combination with dabrafenib.
Melanoma patients treated with vemurafenib have shown homogeneously, dose-dependent decreased FDG uptake in metastases 15 days after starting treatment [23] confirming the modality’s usefulness in documenting treatment response early on in the course of therapy. In addition to demonstrating FDG PET/CT’s ability to evaluate functional treatment response, McArthur et al. were able to demonstrate that a median reduction in SUVmax of 82% resulted in significantly different median times of progression free survival (PFS). The median PFS in patients who had less than an 82% reduction in SUVmax was 183 days, versus 484 days for patients who achieved a greater than 82% reduction in SUVmax. However, no definitive relationship was observed between metabolic response and duration of response according to Response Evaluation Criteria In Solid Tumors (RECIST) criteria, PFS or overall survival at day 15.
The aim of this study is to determine if changes in 18F-FDG uptake in melanoma patients observed shortly after starting treatment with combination therapy consisting of BRAF and MEK inhibitors has prognostic implications in progression-free and overall survival.
Materials and Methods
After obtaining IRB approval, a retrospective review of patients who received combination BRAF and MEK inhibitors for the treatment of metastatic melanoma was conducted. Patients with baseline PET/CT and post treatment PET/CT exams performed at our tertiary care center, the University of Colorado Hospital, from 2011 to 2012 were eligible for inclusion in the study. All PET/CT exams were performed on a PET/CT scanner (Discovery ST -16, GE Healthcare). 18F-FDG (370–740 MBq) was injected approximately 60 minutes before image acquisition. All patients had a blood glucose level <200 mg/dL at the time of injection.
Baseline demographics and cancer staging information for 24 patients with metastatic melanoma were collected [Table 1]. All patients were treated with targeted drug therapy (vemurafenib plus cobimetinib, or dabrafenib plus trametinib) upon entry into the study. We recorded the date of the baseline PET/CT, the date of initiation of therapy, the date of the follow-up PET/CT, the date the patient was removed from the protocol due to disease progression, and the date of death or last follow-up. The average time from baseline scan to initiation of treatment was 8.5 days (range 0–60 days).
Table 1.
Baseline Demographics
| Overall (N=24) | Surviving Participants (N=16) |
Deceased Participants (N=8) |
|
|---|---|---|---|
| Age | 54.25 ± 8.9 | 55.19 ± 6.46 | 52.38 ± 12.83 |
| Sex | |||
| Male | 14 (58.33%) | 10 (62.50%) | 4 (50.00%) |
| Female | 10 (41.67%) | 6 (37.50%) | 4 (50.00%) |
| ECOG | |||
| 0 | 13 (54.17%) | 12 (75.00%) | 1 (12.50%) |
| 1 | 11 (45.83%) | 4 (25.00%) | 7 (87.50%) |
| Treatment | |||
| Dabrafenib + trametinib | 3 (12.50%) | 2 (12.50%) | 1 (12.50%) |
| Vemurafenib + cobimetinib | 21 (87.50%) | 14 (87.50%) | 7 (87.50%) |
The PET portion of each imaging exam was evaluated by an experienced nuclear medicine physician using the EORTC (European Organisation for Research and Treatment of Cancer) criteria for PET response [26]. For each patient, the SUVmax for all tumors visible on the baseline study and follow-up study was evaluated. Then, the change in SUVmax from baseline to follow-up for each tumor was calculated. For each patient, we identified two tumors for use in the prognostic models: 1) the tumor with the highest standardized uptake value (SUVmax) at baseline, and 2) the tumor that showed the least change in SUVmax from baseline to follow-up.
The primary outcomes of interest were progression-free survival and overall survival. Progression-free survival was calculated as the time from the follow-up PET/CT exam to disease progression, death, or last follow-up. Overall survival was calculated as the time from the start of drug therapy to death or last follow-up. For progression-free survival, patients were considered censored if they did not experience disease progression and were still living at the last known follow up. For overall patient survival, patients were considered censored if they were still living at the last known follow up, regardless of disease progression.
We calculated descriptive statistics for baseline demographics and clinical findings, both overall, and stratified by survival status. We produced Kaplan-Meier survival plots overall, and then stratified by gender and ECOG score [24].
We assessed four hypotheses:
Overall survival is associated with baseline SUVmax, and the change in SUVmax for the tumor with the highest baseline SUVmax.
Progression-free survival is associated with baseline SUVmax, and the change in SUVmax for the tumor with the highest baseline SUVmax.
Overall survival is associated with baseline SUVmax, and the change in SUVmax for the tumor that showed the smallest change in SUVmax between baseline and follow-up.
Progression-free survival is associated with baseline SUVmax, and the change in SUVmax for the tumor that showed the smallest change in SUVmax between baseline and follow-up.
For each hypothesis, we fit a planned sequence of Cox proportional hazards models [25]. We describe the approach for the first hypothesis. Our approach for the other three hypotheses was exactly parallel.
The full model included the following predictors: age, gender, the change in SUVmax for the tumor with the highest baseline SUVmax, baseline SUVmax for the tumor with the highest baseline SUVmax, ECOG score, and the interaction between ECOG score and change in SUVmax.
In order, we sequentially examined the contribution of the following predictors:
the interaction between ECOG score and change in SUVmax,
the change in SUVmax for the tumor with the highest baseline SUVmax,
baseline SUVmax for the tumor with the highest baseline SUVmax, and
ECOG score.
Non-significant terms were removed from the model. All hypothesis tests were performed with an alpha = 0.05.
For the final, best fitting models, we produced hazard ratios, 95% confidence limits, and p-values.
Results
Twenty-four patients were included in the analysis. Baseline demographics and clinical findings are summarized in Tables 1 and 2. The average time between baseline PET/CT to the follow-up PET/CT was 26 days (SD=25 days). Time to follow-up ranged from 13 to 117 days. At the follow-up PET/CT, 2 (8%) patients showed a complete response to therapy based on EORTC criteria [26]. For the tumor with the highest SUVmax at baseline, all remaining patients showed a partial response to treatment. For the least responsive tumor, 18 (75%) patients showed a partial response, 2 (8%) had stable disease, and 2 (8%) had progressive disease by EORTC criteria [26].
Table 2.
FDG PET/CT Findings
| Overall (N=24) | Surviving Participants (N=16) |
Deceased Participants (N=8) |
|
|---|---|---|---|
| Time from Baseline to Follow-up FDG PET/CT | 26.08 ± 24.81 | 27.5 ± 28.87 | 23.25 ± 14.95 |
| Tumor with the highest baseline SUVmax | |||
| Baseline SUVmax | 18.48 ± 10.91 | 16.62 ± 10.66 | 22.19 ± 11.14 |
| Follow-up SUVmax | 5.55 ± 3.62 | 4.92 ± 3.23 | 6.79 ± 4.26 |
| Change from Baseline | −12.93 ± 9.38 | −11.7 ± 9.72 | −15.4 ± 8.74 |
| Percent Change from Baseline | −0.68 ± 0.18 | −0.68 ± 0.18 | −0.67 ± 0.19 |
| Tumor that showed the smallest change in SUVmax between baseline and follow-up | |||
| Baseline SUVmax | 10.91 ± 6.72 | 11.09 ± 6.84 | 10.59 ± 6.97 |
| Follow-up SUVmax | 6.81 ± 6.29 | 7.09 ± 6.51 | 6.34 ± 6.29 |
| Change from Baseline | −4.1 ± 4.81 | −4.01 ± 4.93 | −4.25 ± 4.92 |
| Percent Change from Baseline | −0.40 ± 0.34 | −0.39 ± 0.38 | −0.42 ± 0.27 |
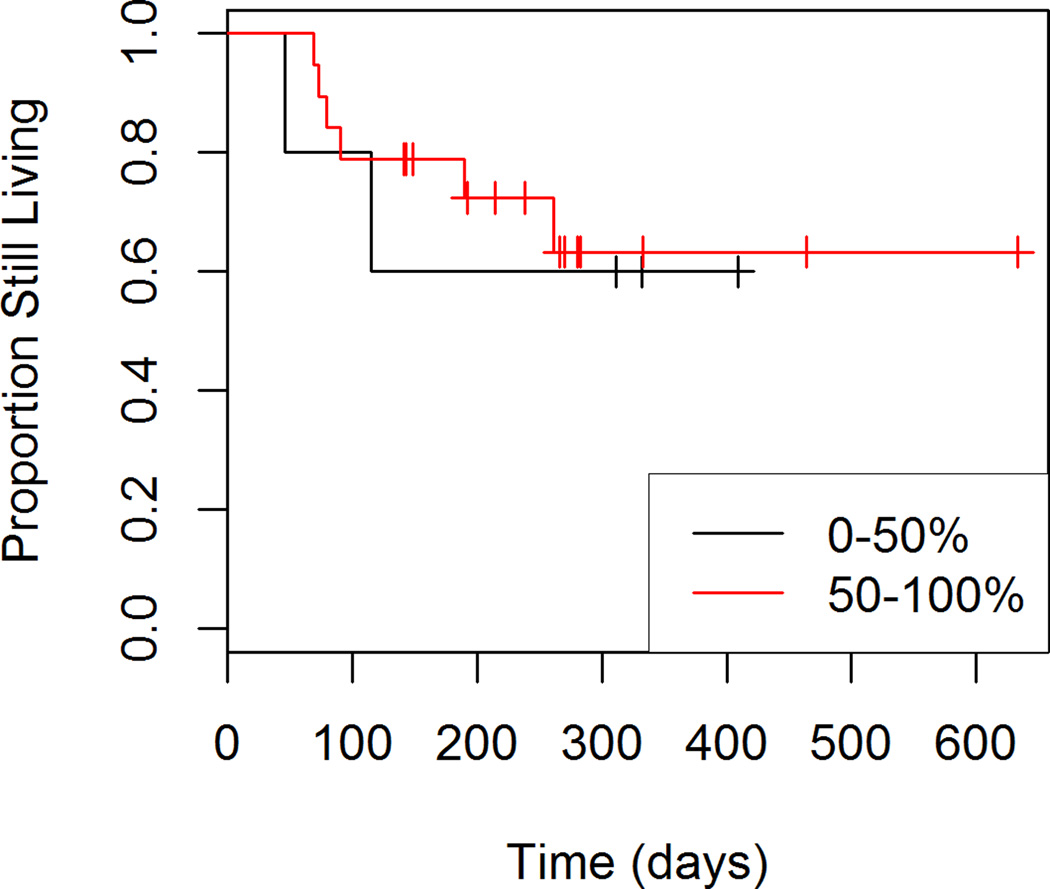
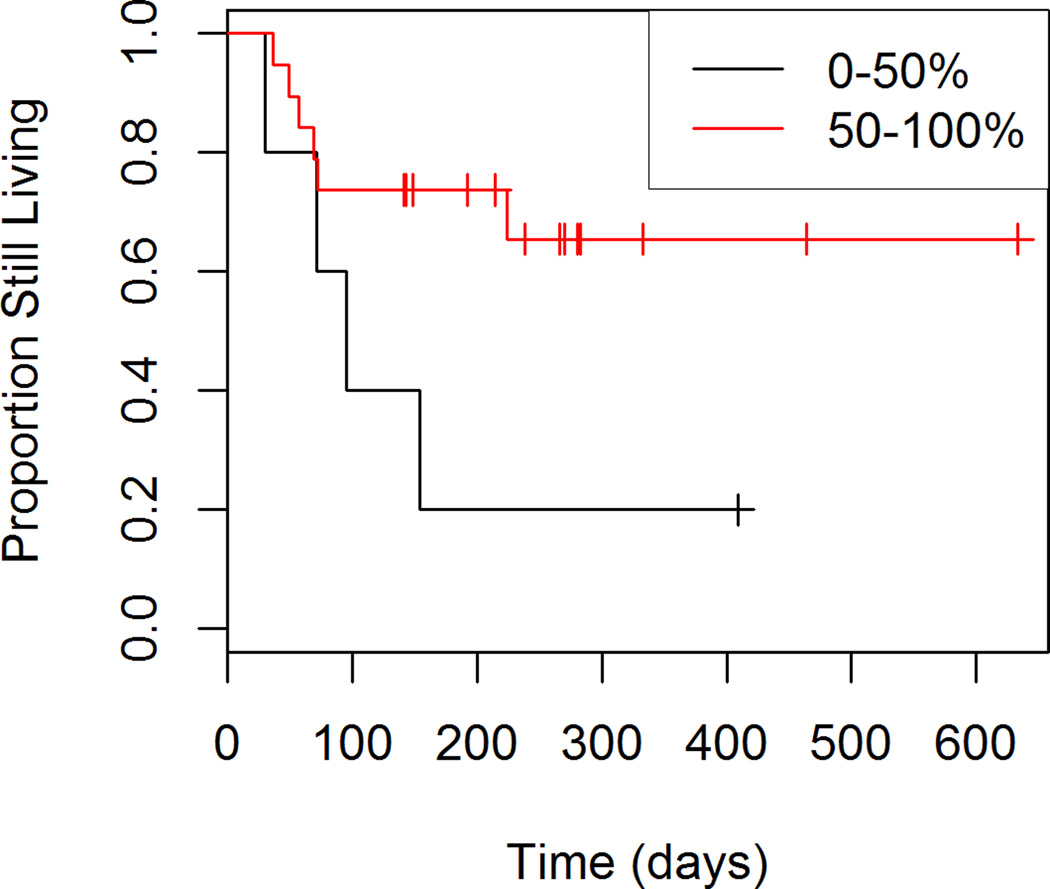
Number of Patients with Overall change in SUVmax of 0–50%: 5
Number of Patients with Overall change in SUVmax of 50–100%: 19
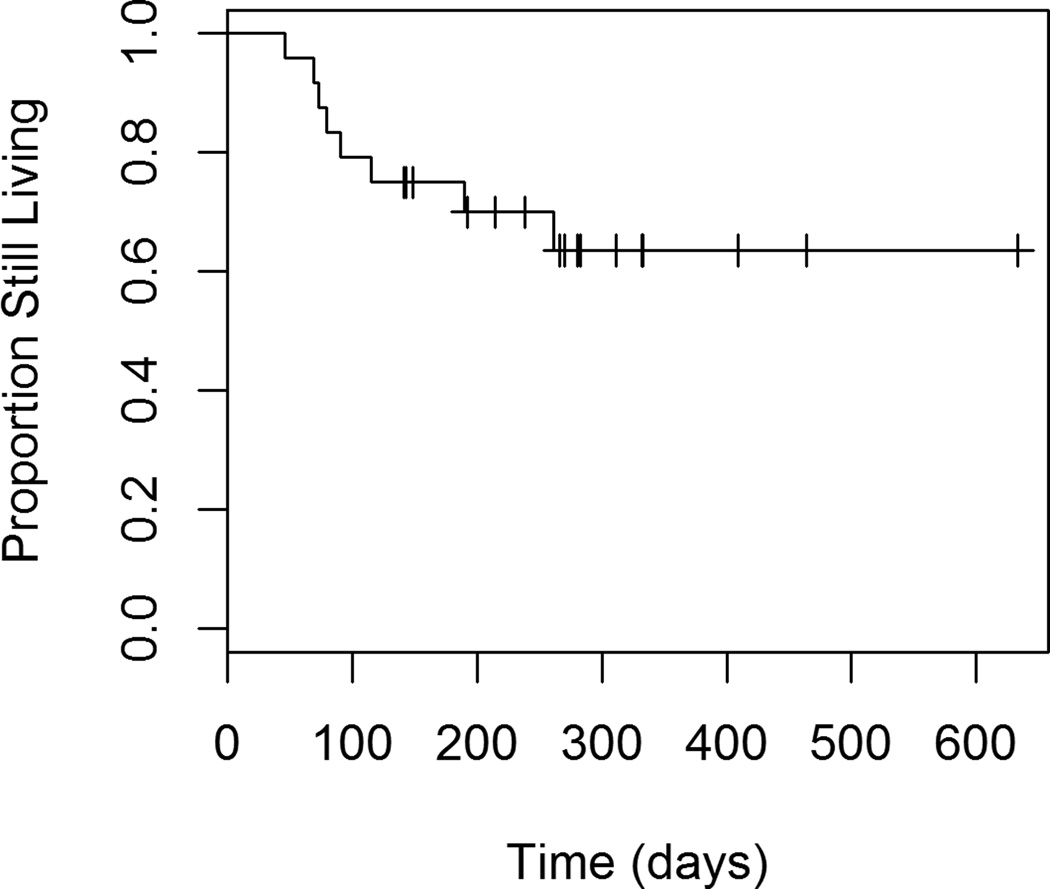
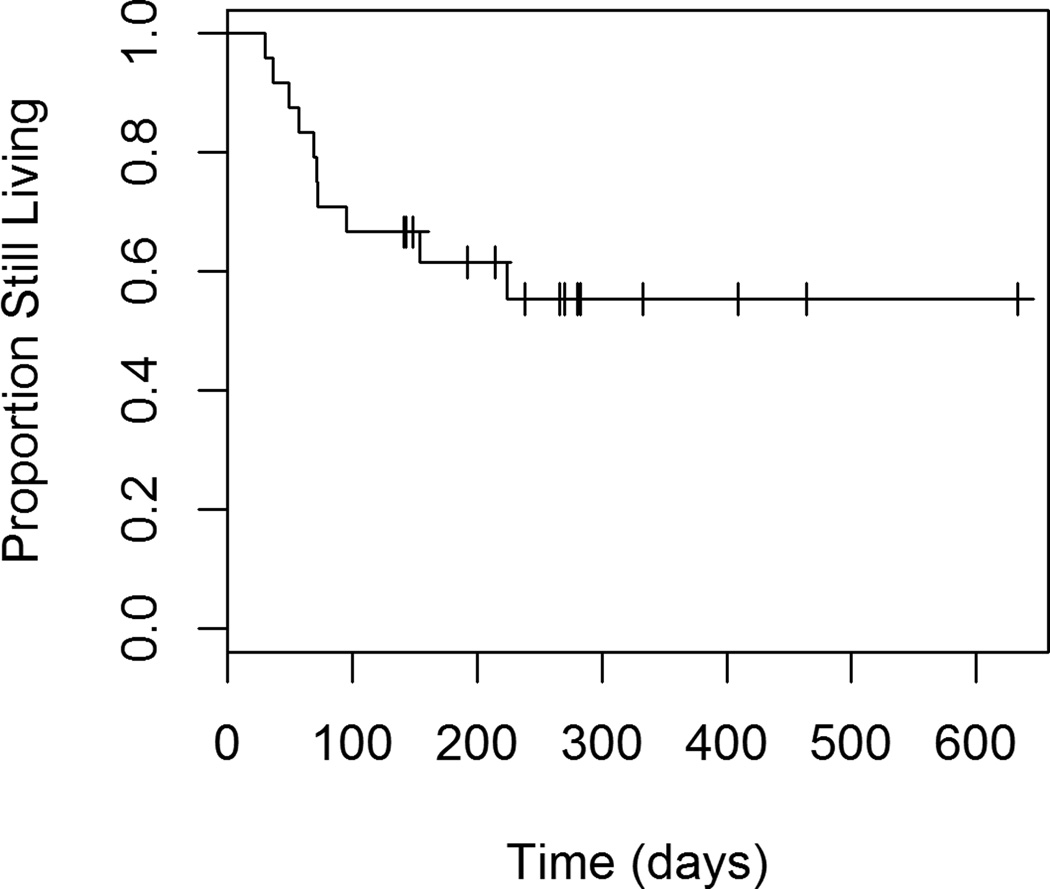
Of the 24 patients receiving targeted drug therapy, 16 (67%) were alive at the end of the observation period, and 13 (54%) patients were alive without disease progression. We were unable to estimate median survival since greater than 50% of participants were still living at the end of the study.
Overall Survival
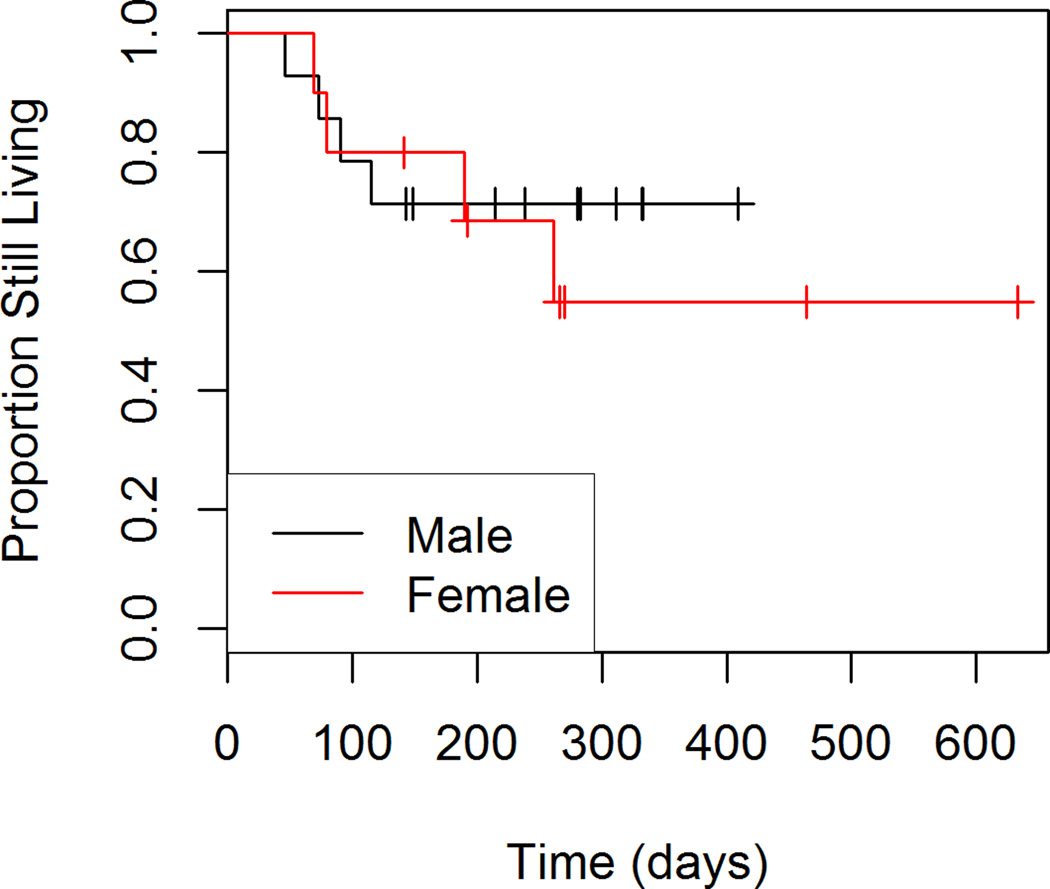
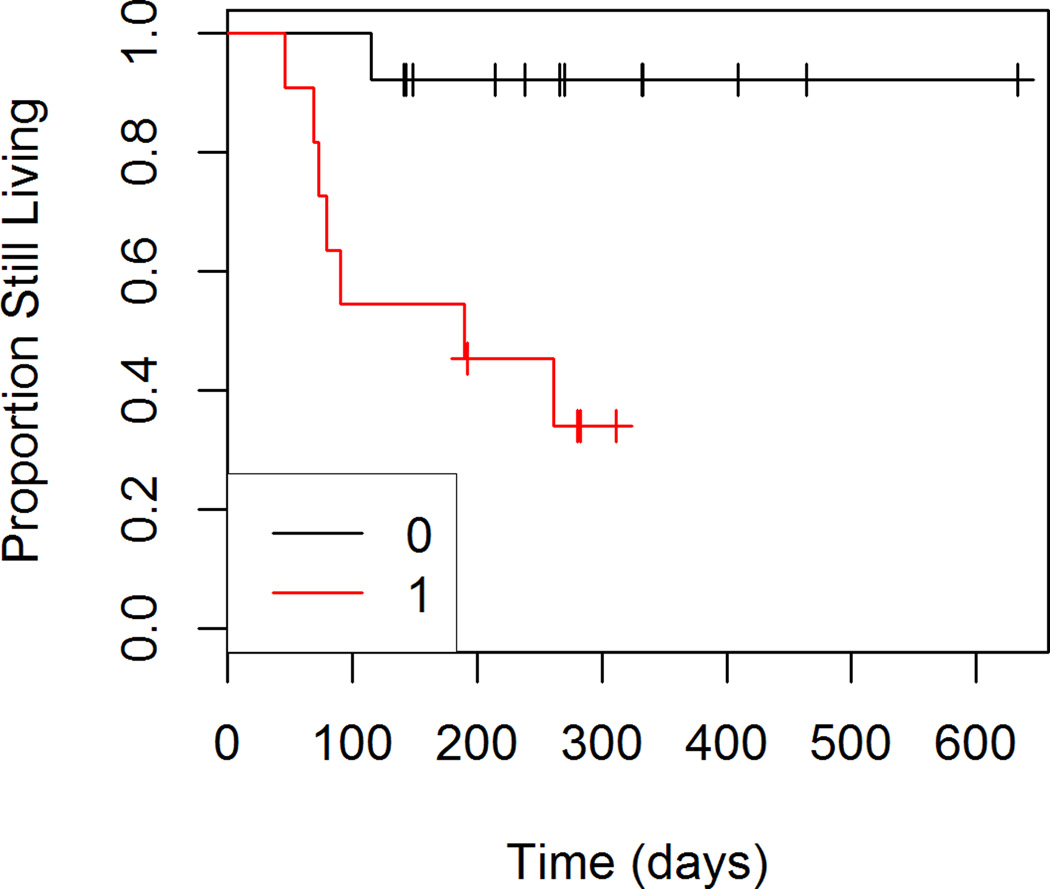
Figures 1 through 4 show the unadjusted survival curves for all participants, and the participants stratified by gender, ECOG and percent decrease in SUVmax between baseline and follow-up. Survival times were roughly similar between males and females for the first 250 days, with females showing shorter survival times after 250 days. Shorter survival times were observed among patients with an ECOG of 1 compared to those with an ECOG of 0.
Figure 1.
Overall Survival
Figure 4.
Overall Survival by Percent Response to Treatment
We assessed the association between overall survival, and results for the tumor with the highest baseline SUVmax. We did not observe a significant interaction between the change in SUVmax and ECOG score (p=0.50). No associations were observed between overall survival and change in SUVmax (HR=1.04, 95% CI: 0.85 to 1.26, p=0.73) or baseline SUVmax (HR=1.00, 95% CI: 0.94 to 1.06, p=0.97).
We assessed the association between overall survival and results for the tumor that showed the smallest change in SUVmax between baseline and follow-up. We did not observe a significant interaction between ECOG score and change in SUVmax (p=0.68). No associations were observed between overall survival and change in SUVmax (HR=1.01, 95% CI: 0.78 to 1.30, p=0.97) or baseline SUVmax (HR=0.97, 95% CI: 0.88 to 1.07, p=0.52).
In the reduced model, ECOG score was significantly associated (p=0.02) with patient survival. The risk of death was 11.81 times higher (95% CI: 1.42 to 97.60) for patients with an ECOG score of 1 compared to those with an ECOG score of 0.
Progression-Free Survival
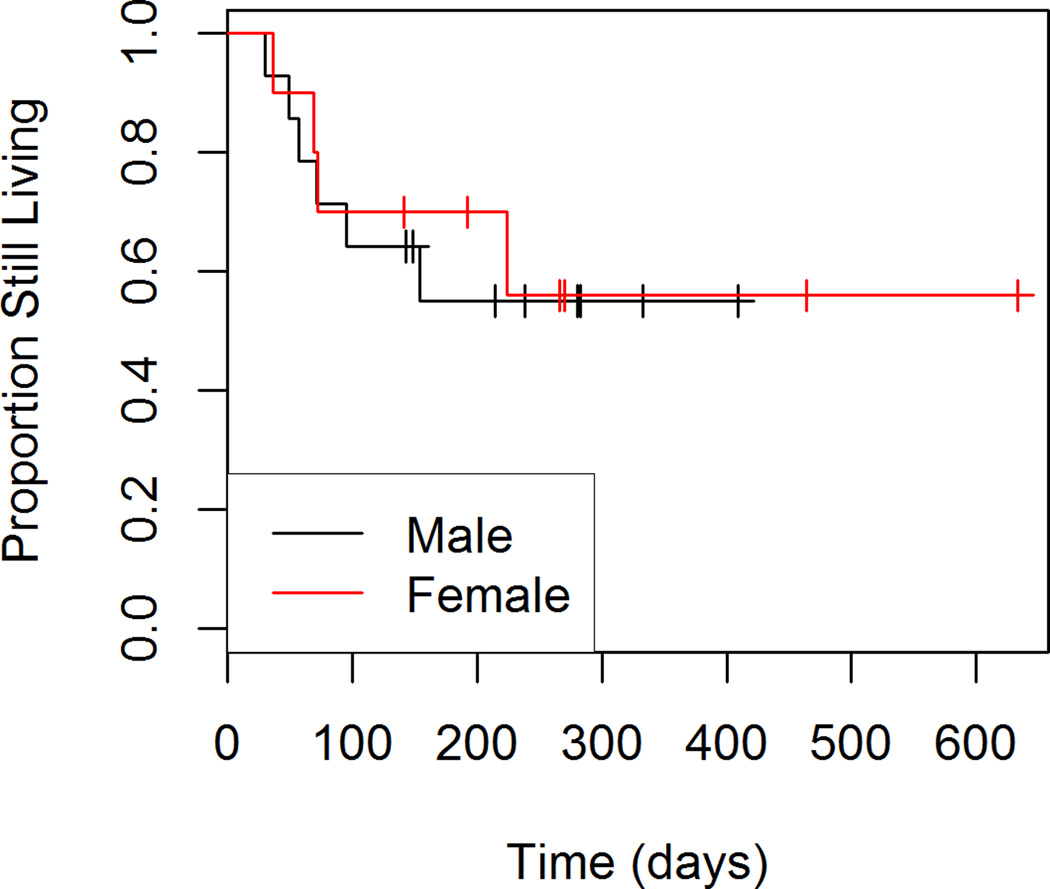
Figures 5 through 8 show the unadjusted progression-free survival curves for all participants, and the participants stratified by gender, ECOG and percent decrease in SUVmax between baseline and follow-up. Results were similar to those observed for overall survival, with the exception that progression-free survival for males and females was similar throughout the observation period, and not just in the first 200 days.
Figure 5.
Progression-free Survival
Figure 8.
Progression-free Survival by Percent Response to Treatment
When we used results for the tumor with the highest baseline SUVmax as predictors, we did not observe a significant interaction between ECOG score and change in SUVmax (p=0.90). No associations were observed between progression-free survival and change in SUVmax (HR=1.15, 95% CI: 0.94 to 1.41, p=0.17) or baseline SUVmax (HR=1.01, 95% CI: 0.96 to 1.06, p=0.78).
When we used results for the tumor that showed the smallest change in SUVmax between baseline and follow-up as predictors, we did not observe a significant interaction between ECOG score and change in SUVmax (p=0.35). In the reduced model, the change in SUVmax was significantly associated with progression-free survival (p=0.01). When controlling for baseline SUVmax and ECOG status for the least responsive tumor, the risk of progression or death increased by 1.34 times (95% CI: 1.06 to 1.71) for every 1 unit increase in the change in SUVmax. Note that higher change scores (follow-up minus baseline) indicate poorer response to treatment. In addition, ECOG score was significantly associated (p=0.002) with progression-free survival. The risk of progression or death was 24.72 times higher (95% CI: 3.23 to 189.42) for patients with an ECOG score of 1 compared to those with an ECOG score of 0.
Discussion
Combination therapies targeting molecular pathways are exciting new developments for the treatment of advanced melanoma. The FDA recently approved the first ever combination therapy for advanced melanoma which combines dabrafenib, a BRAF inhibitor, with trametinib, a MEK inhibitor. We present data that demonstrates the use of 18F-FDG PET/CT after combination targeted therapy to assess early response with respect to progression free survival.
When we used results for the tumor that showed the smallest change in SUVmax between baseline and follow-up, we observed a significant association between change in SUVmax and progression-free survival (p=0.01), but not overall survival (p=0.52). We did not observe associations between SUVmax and progression-free survival or overall survival for the tumor with the highest baseline SUVmax. The smallest change in SUVmax, rather than highest baseline SUVmax may be more important in progression-free survival because change in FDG metabolism is a surrogate marker of drug efficacy and thus tumors with the smallest change in SUVmax are less responsive to treatment. ECOG score was significantly associated with both progression-free survival (p=0.002) and overall survival (p=0.02). The data suggest that change in SUVmax for the tumor that showed the smallest change in SUVmax between baseline and follow-up, as well as baseline functional performance, may be useful prognostic indicators for progression-free survival in patients with BRAF-mutant melanoma.
Baudy et al. suggested that FDG-PET may be a good biomarker of early response and acquired resistance in mice treated with BRAF and MEK inhibitors [27]. Our results are concordant with their study. To our knowledge, this is the first study in humans that has shown a correlation between early response on FDG PET/CT and progression free survival.
The main limitations to our study are the retrospective design and the short duration of follow-up. Patients who progressed during treatment with BRAF and MEK inhibition were removed from the drug trial and changed therapies adding a confounding factor and limiting assessment of overall survival. The timing of the imaging exams was not well controlled as can be seen by the large standard deviation from baseline to time to follow up PET/CT (13 to 117 days). The short duration for follow-up did not allow for a reasonable calculation of overall survival. Larger studies with more patients and longer follow-up need to be done to further evaluate this.
Conclusion
Combination targeted cancer therapy for unresectable metastatic melanoma has been shown in phase 3 clinical trials to improve the rate of progression-free survival compared to single agent targeted cancer therapy [28]. This study demonstrates that FDG PET/CT may be a useful prognostic indicator in patients undergoing combination targeted cancer therapy.
Figure 2.
Overall Survival by Gender
Figure 3.
Overall Survival by ECOG Score
Figure 6.
Progression-free Survival by Gender
Figure 7.
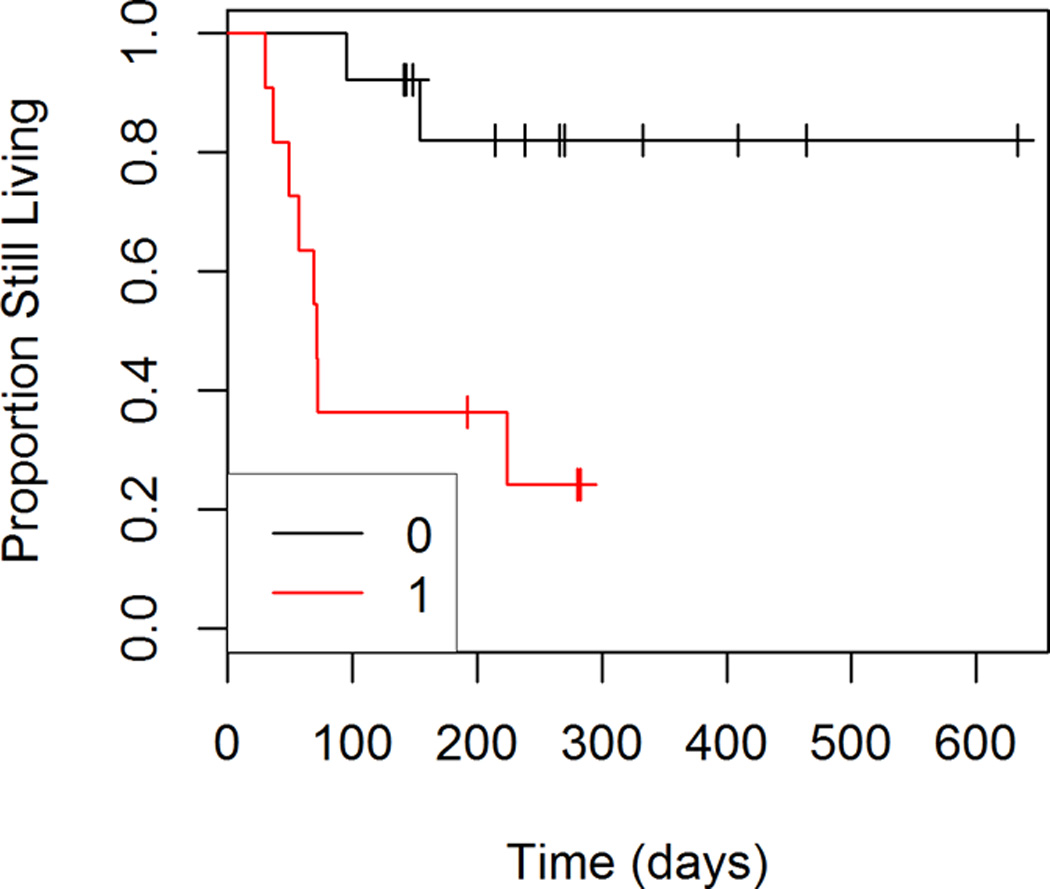
Progression-free Survival by ECOG Score
Acknowledgments
Source of Funding: Rene Gonzalez receives research funding from Roche/Genentech, Bristol-Myers Squibb, GlaxoSmithKline, Merck, Castle Bioscience and Novartis. Rodabe Amaria receives research support from Novartis.
Footnotes
Conflicts of Interest For the remaining authors none were declared.
Data presented previously at the Society of Nuclear Medicine and Molecular Imaging 2015 annual meeting.
Trial drugs were supplied by Roche/Genentech and GlaxoSmithKline.
References
- 1.Higuchi M, Takeo H, Osugi J, Suzuki H, Gotoh M. Prognostic Impact of FDG-PET in Surgically Treated Pathologic Stage I Lung Adenocarcinoma. Annals of Thoracic and Cardiovascular Surgery. 2013:1–7. doi: 10.5761/atcs.oa.12.02219. [DOI] [PubMed] [Google Scholar]
- 2.Berghmans T, Dusart M, Paesmans M, Hossein-Foucher C, Buvat I, Castaigne C, et al. Primary tumor standardized uptake value (SUVmax) measured on fluorodeoxyglucose positron emission tomography (FDG-PET) is of prognostic value for survival in non-small cell lung cancer (NSCLC): a systematic review and meta-analysis (MA) by the European Lung Cancer Working Party for the IASLC Lung Cancer Staging Project. J Thorac Oncol. 2008;3:6–12. doi: 10.1097/JTO.0b013e31815e6d6b. [DOI] [PubMed] [Google Scholar]
- 3.Pauwels E, Coumou A, Kostkiewicz M, Kairemo K. 18F Fluoro-2-Deoxy-D-Glucose Positron Emission Tomography/Computed Tomography Imaging in Oncology: Intial Staging and Evaluation of Cancer Therapy. Medical Principles and Practice. 2013:1–11. doi: 10.1159/000346303. [DOI] [PMC free article] [PubMed] [Google Scholar]
- 4.Cerci JJ, Pracchia LF, Linardi CC, Pitella FA, Delbeke D, Izaki M, et al. 18F-FDG PET after 2 cycles of ABVD predicts event-free survival in early and advanced Hodgkin lymphoma. J Nucl Med. 2010;51:1337–1443. doi: 10.2967/jnumed.109.073197. [DOI] [PubMed] [Google Scholar]
- 5.Juweid ME. FDG-PET/CT in lymphoma. Methods Mol Biol. 2011;727:1–19. doi: 10.1007/978-1-61779-062-1_1. [DOI] [PubMed] [Google Scholar]
- 6.Zanoni L, Cerci JJ, Fanti S. Use of PET/CT to evaluate response to therapy in lymphoma. J Nucl Med Mol Imaging. 2011;55:633–647. [PubMed] [Google Scholar]
- 7.Schwarz-Dose J, Untch M, Tiling R, Sassen S, Mahner S, Kahlert S, et al. Monitoring primary systemic therapy of large and locally advanced breast cancer by using sequential positron emission tomography imaging with [18F] fluorodeoxyglucose. J Clin Oncol. 2009;27:535–541. doi: 10.1200/JCO.2008.17.2650. [DOI] [PubMed] [Google Scholar]
- 8.Martoni AA, Zamagni C, Quercia S, Rosati M, Cacciari N, Bernardi A, et al. Early (18)F-2-fluoro-2-deoxy-D-glucose positron emission tomography may identify a subset of patients with estrogen receptor-positive breast cancer who will not respond optimally to preoperative chemotherapy. Cancer. 2010;116:805–813. doi: 10.1002/cncr.24820. [DOI] [PubMed] [Google Scholar]
- 9.Keam B, Im SA, Koh Y, Han SW, Oh DY, Cho N, et al. Early metabolic response using FDG PET/CT and molecular phenotypes of breast cancer treated with neoadjuvant chemotherapy. BMC Cancer. 2011;11:452. doi: 10.1186/1471-2407-11-452. [DOI] [PMC free article] [PubMed] [Google Scholar]
- 10.Haug AR, Tiega Donfack BP, Trumm C, Zech CJ, Michl M, Laubender RP, et al. 18F-FDG PET/CT predicts survival after radioembolization of hepatic metastases from breast cancer. J Nucl Med. 2012;53:371–377. doi: 10.2967/jnumed.111.096230. [DOI] [PubMed] [Google Scholar]
- 11.Benz MR, Herrmann K, Walter F, Garon EB, Reckamp KL, Figlin R, et al. (18)F-FDG PET/CT for monitoring treatment responses to the epidermal growth factor receptor inhibitor erlotinib. J Nucl Med. 2011;52:1684–1689. doi: 10.2967/jnumed.111.095257. [DOI] [PMC free article] [PubMed] [Google Scholar]
- 12.Mileshkin L, Hicks RJ, Hughes BG, Mitchell PL, Charu V, Gitlitz BJ, et al. Changes in 18F-fluorodeoxyglucose and 18F-fluorodeoxythymidine positron emission tomography imaging in patients with non-small cell lung cancer treated with erlotinib. Clin Cancer Res. 2011;17:3304–3315. doi: 10.1158/1078-0432.CCR-10-2763. [DOI] [PubMed] [Google Scholar]
- 13.Kahraman D, Scheffler M, Zander T, Nogova L, Lammertsma AA, Boellaard R, et al. Quantitative analysis of response to treatment with erlotinib in advanced non-small cell lung cancer using 18F-FDG and 3′-deoxy-3′-18F-fluorothymidine PET. J Nucl Med. 2011;52:1871–1877. doi: 10.2967/jnumed.111.094458. [DOI] [PubMed] [Google Scholar]
- 14.Zander T, Scheffler M, Nogova L, Kobe C, Engel-Riedel W, Hellmich M, et al. Early prediction of nonprogression in advanced non-small-cell lung cancer treated with erlotinib by using [(18)F]fluorodeoxyglucose and [(18)F]fluorothymidine positron emission tomography. J Clin Oncol. 2011;29:1701–1708. doi: 10.1200/JCO.2010.32.4939. [DOI] [PubMed] [Google Scholar]
- 15.Passero VA, Branstetter BF, Shuai Y, Heron DE, Gibson MK, Lai SY, et al. Response assessment by combined PET-CT scan versus CT scan alone using RECIST in patients with locally advanced head and neck cancer treated with chemoradiotherapy. Ann Oncol. 2010;21:2278–2283. doi: 10.1093/annonc/mdq226. [DOI] [PMC free article] [PubMed] [Google Scholar]
- 16.Strobel K, Dummer R, Steinert HS, Conzett KB, Schad K, Lago MP, et al. Chemotherapy response assessment in stage IV melanoma patients—comparison of 18 F-FDG-PET/CT, CT, brain MRI, and tumor marker S-100B. Eur J Nucl Med Mol Imaging. 2008;35:1786–1795. doi: 10.1007/s00259-008-0806-1. [DOI] [PubMed] [Google Scholar]
- 17.Beeram M, Patnaik, Rowinsky EK. Raf: a strategic target for therapeutic development against Cancer. J Clin Oncol. 2005;(23):6771–6790. doi: 10.1200/JCO.2005.08.036. [DOI] [PubMed] [Google Scholar]
- 18.Maldonado JL, Fridlyand J, Patel H, Jain AN, Busam K, Kageshita T, et al. Determinants of BRAF mutations in primary melanomas. J Natl Cancer Inst. 2003;(95):1878–1890. doi: 10.1093/jnci/djg123. [DOI] [PubMed] [Google Scholar]
- 19.Lang J, Mackie RM. Prevalence of exon 15 BRAF mutations in primary melanoma of the superficial spreading, nodular, acral, and lentigo maligna subtypes. J Invest Dermatol. 2005;(125):575–579. doi: 10.1111/j.0022-202X.2005.23833.x. [DOI] [PubMed] [Google Scholar]
- 20.Curtin JA, Fridlyand J, Kageshita T, Patel HN, Busam KJ, Kutzner H, et al. Distinct sets of genetic alterations in melanoma. N Engl J Med. 2005;(353):2135–2147. doi: 10.1056/NEJMoa050092. [DOI] [PubMed] [Google Scholar]
- 21.Chapman PB, Hauschild A, Robert C, Haanen JB, Ascierto P, Larkin J, et al. Improved survival with vemurafenib in melanoma with BRAF V600E mutation. N Engl J Med. 2011;364:2507–2516. doi: 10.1056/NEJMoa1103782. [DOI] [PMC free article] [PubMed] [Google Scholar]
- 22.Solit DB, Garraway LA, Pratilas CA, Sawai A, Getz G, Basso A, et al. BRAF mutation predicts sensitivity to MEK inhibition. Nature. 2006;(439):358–362. doi: 10.1038/nature04304. [DOI] [PMC free article] [PubMed] [Google Scholar]
- 23.McArthur G, Puzanov I, Amaravadi R, Ribas A, Chapman P, Kim KB, et al. Marked, Homogenous, and Early 18F Fluorodeoxyglucose Positron Emission Tomography Responses to Vemurafenib in BRAF-Mutant Advanced Melanoma. Journal of Clinical Oncology. 2012;30:1628–1634. doi: 10.1200/JCO.2011.39.1938. [DOI] [PMC free article] [PubMed] [Google Scholar]
- 24.Kaplan EL, Meier P. Nonparametric Estimation from Incomplete Observations. Journal of the American Statistical Association. 1958;53(282):457. [Google Scholar]
- 25.Cox DR, Oakes D. Analysis of survival data. Boca Raton, FL: CRC Press; 1984. [Google Scholar]
- 26.Young H, Baum R, Cremerius U, Herholz K, Hoekstra O, Lammertsma AA, et al. Measurement of clinical and subclinical tumour response using [18F]-fluorodeoxyglucose and positron emission tomography: review and 1999 EORTC recommendations. European Organization for Research and Treatment of Cancer (EORTC) PET Study Group. Eur J Cancer. 1999;35(13):1773–1782. doi: 10.1016/s0959-8049(99)00229-4. [DOI] [PubMed] [Google Scholar]
- 27.Baudy AR, Dogan T, Flores-Mercado JE, Hoeflich KP, Su F, van Bruggen N, et al. FDG-PET is a good biomarker of both early response and acquired resistance in BRAFV600 mutant melanomas treated with vemurafenib and the MEK inhibitor GDC-0973. EJNMMI Res. 2012 May 31;2(1):22. doi: 10.1186/2191-219X-2-22. [DOI] [PMC free article] [PubMed] [Google Scholar]
- 28.Long GV, Stroyakovskiy D, Gogas H, Levchenko E, de Braud F, Larkin J, et al. Combined BRAF and MEK inhibition versus BRAF inhibition alone in Melanoma. N Engl J Med. 2014;371:1877–1888. doi: 10.1056/NEJMoa1406037. [DOI] [PubMed] [Google Scholar]


