Abstract
Purpose
To restore 12-lead ECG signal fidelity inside MRI by removing magnetic-field gradient induced-voltages during high gradient-duty-cycle sequences.
Theory and Methods
A theoretical equation was derived, providing first- and second-order electrical fields induced at individual ECG electrode as a function of gradient fields. Experiments were performed at 3T on healthy volunteers, using a customized acquisition system which captured full amplitude and frequency response of ECGs, or a commercial recording system. The 19 equation coefficients were derived by linear regression of data from accelerated sequences, and used to compute induced-voltages in real-time during full-resolution sequences to remove ECG artifacts. Restored traces were evaluated relative to ones acquired without imaging.
Results
Measured induced-voltages were 0.7V peak-to-peak during balanced Steady-State Free Precession (bSSFP) with heart at the isocenter. Applying the equation during gradient echo sequencing, three-dimensional fast spin echo and multi-slice bSSFP imaging restored nonsaturated traces and second-order concomitant terms showed larger contributions in electrodes farther from the magnet isocenter. Equation coefficients are evaluated with high repeatability (ρ = 0.996) and are subject, sequence, and slice-orientation dependent.
Conclusion
Close agreement between theoretical and measured gradient-induced voltages allowed for real-time removal. Prospective estimation of sequence-periods where large induced-voltages occur may allow hardware removal of these signals.
Keywords: cardiac magnetic resonance imaging, image-guided intervention, 12-lead ECG, gradient induced noise, Maxwell's equations
Introduction
Physiological monitoring using a 12-lead ECG may be essential for MR imaging of patients with ischemic histories and acute-stroke, or during conduction of high-risk surgeries and interventions under MR guidance. However, ECG artifacts induced by the magnetic field gradients, whose amplitude may exceed the real ECG by one to two orders of magnitude, severely affect ECG trace quality and fidelity, and frequently lead to an inability to observe the true ECG (Fig. 1). Additional ECG artifacts are induced inside the MRI bore by the MagnetoHydrodynamic (MHD) effect, which are not addressed in this paper. Interested parties can view previous publications1, 2.
Figure 1.
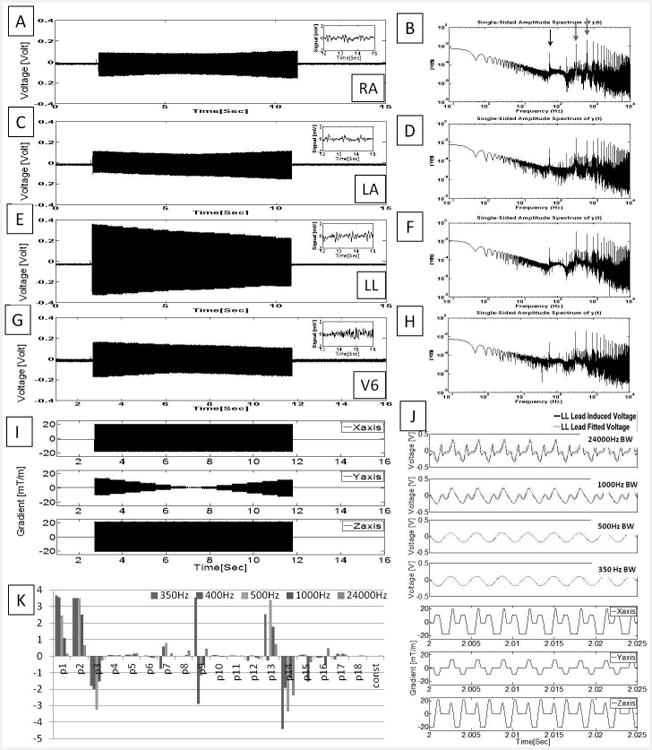
Unfiltered ECG traces recorded at a rate of 48 kHz during an axial bSSFP scan using acquisition Set-up I. (A, C, E, G)Voltages measured during imaging from three limb leads (LA, RA and LL) and the precordial lead with the largest induced voltage, V6'. Insets showed 30Hz low-pass filtered ECG (in mV) extracted from the period without gradient activity. (B, D, F, H) Spectral analysis from 0.1-10KHz. Notable peaks (red arrows) are seen at the fundamental (320 Hz) and 2nd harmonic (640 Hz) corresponding to the repetition time (TR) and at 60 Hz noise (black arrow). (I) Gradient waveforms simultaneously recorded while imaging. (J) Expanded induced noise in LL traces filtered below noted frequencies (black traces), overlaid on data fitted to the 19-parameter equation (green traces), and corresponding gradient waveforms (blue traces). (K) The 19-parameter plot for ECG traces with the bandwidths of (I), and their units are listed in Table 1. Note that even at 350 Hz bandwidth, some 2nd order coefficients remain very large.
Removal of the induced voltages has been attempted using both hardware and software approaches. Commercial MRI compatible ECG systems employ 3-4 closely spaced ECG electrodes along with high-impedance (10 kΩ or more) transmission-lines to reduce the magnitude of the induced voltages. A dedicated hardware switching circuit was previously developed to reduce the gradient-induced artifacts in 12-lead MRI-conditional ECG by blocking/blanking ECG transmissions during all gradient ramps1, which has been shown feasible at 1.5T in MR sequences with repetition times (TRs) > 4ms.
Most approaches apply strong (< 50 Hz) low-pass filters to the ECG traces to remove the high-frequency components in the induced voltages. This approach is limited, however, by the retention of low-frequency components of the gradient-induced voltages in the ECG traces, and it leads to distorted waveforms that are less useful for patient monitoring. Another approach used adaptive digital filters 3-8 to reduce the ECG noise by detecting the gradient waveforms generated by the MR pulse sequences and modeling the noise responses as a linear time-invariant system to convolve with the temporal response of the gradients. It has been assumed that time derivatives of gradients are the major contributor in those studies, but a systematic derivation of the relationship between the gradients and the induced noise has not been demonstrated.
Each of the three gradient coils used in MRI generate magnetic fields in all three spatial directions during imaging, although imaging only makes direct use of the Z-component (Bz). Via Maxwell's equations, the time-varying gradients also generate electric fields in all directions. The distribution of induced electrical fields has been studied experimentally and theoretically due to its role in nerve stimulation. These studies have shown a linear relationship between the induced electric fields E and temporal derivatives of the magnetic field ∂B/∂t 9-11. They also showed that, with the heart at the isocenter of the magnet, high voltages of approximately 0.6 V between the Right Arm (RA) and Left Leg (LL) can be generated in specific off-center body regions, such as thighs and shoulders, and that when the heart is not at the isocenter, the 12-lead ECG electrodes can record even higher voltages (2–5 V).
Other studies have examined the effect of time-varying gradients fields produced along the x and y directions (concomitant gradients), because they affect MRI images in specific sequences, such as phase-contrast velocity measurements, especially when imaging is performed far from the magnet isocenter 12-14.
In this study we merge derivations from Maxwell's equations 11 and concomitant field 14 to arrive at a theoretical equation that provides, to second order, the three components of the expected vectorial induced voltage at each ECG lead. All of the coefficients within this equation cannot be measured with conventional ECG electrodes, since these electrodes measure only the magnitude of the total vectorial field, not its individual components.
To obtain accurate estimates of the coefficients, we measured gradient-induced voltages during several MRI sequences using two experimental constructs. We also devised and tested a fast method to measure the coefficients, by executing abbreviated imaging sequences. Once all equation terms were established, we applied the equation in real-time to remove the gradient-induced voltages from ECG traces obtained during full-length high-duty-cycle MRI sequences and validated the quality of the induced-voltage removal.
Theory
We derived the gradient-induced voltages recorded by the 12-lead ECG electrodes based on the interaction of the electric fields induced by the three MRI gradient coils on the human body, using Maxwell's equations (see Appendix).
In the linear approximation, which results in a 7-parameter equation (Appendix equation A10), we assumed that only the z-component of the magnetic field induced by the gradients is relevant. This equation has dependencies on the gradients and on their temporal derivatives.
In the 2nd order approximation, which becomes increasingly relevant when the ECG electrodes are placed further away from the MRI isocenter, we took into account the fact that the three gradient coils also create magnetic fields in the x and y directions. This fact was originally investigated in the context of the effect of these fields on MRI imaging further from magnet's center, and is referred to as concomitant field theory13. The equation (Appendix equation A15) we reached for the induced voltage Sk(t), where k represents individual ECG channel, defined as
| (1) |
The 2nd order terms will be important, in the 12-lead ECG context, in two instances; (a)when the heart is at magnet isocenter (e.g. during cardiac imaging), the higher terms are expected to be large in the precordial leads V5 and V6, and in all the limb leads (RA, Left Arm (LA), LL), and (b) when other body organs are at isocenter (e.g. during imaging of the head, the knees, etc.), then the higher order terms can be important for all the 12-lead ECG leads, and much higher induced voltages may be observed, as also shown by numerical simulation.
Methods
Recording of 12-Lead ECG
We define gradient-duty-cycle as
| (2) |
To enable observing the full amplitude and frequency spectrum of the ECG traces acquired during imaging under short TR and high- GDC (GDC>30%) conditions, the 12-lead MRI-conditional ECG system was modified from our previous setup, which was composed of transmission lines to reduce radiofrequency induction and switching circuits to remove induced voltages. 1. These changes were required because 1) at higher gradient slew-rate and peak amplitude, the magnitude of the induced voltage, particularly in the limb and off-center precordial leads can be as high as 1 Volt, and 2) blocking signal transmission during high-GDC imaging results in the loss of most of the temporal information in real ECG traces.
In the data acquisition system shown in Fig. 2, each ECG channel, including the precordial leads V1-V6 and the limb leads RA, LL, LA, augmented Vector Right (aVR), augmented Vector Left (aVL), and augmented Vector Foot (aVF), entered the system via an unity-gain differential amplifier/delay-line (model AL181-25k-179A, TTE Incorporated, Los Angeles, CA), with the Right-Leg (RL) input acting as the reference voltage. This TTE unit utilized a 10-pole Chebyshev filter to provide an 80-μs signal delay and a 25 kHz low-pass frequency, replacing a previously used passive filter1. It provided impedance matching between the human body and the front-end electronics, and preserved linear-phase, unity-gain, ECG traces without signal distortion and attenuation. A low-noise operational-amplifier adder (AD8674, Analog Devices, Norwood, MA) was placed before the single pole double throw (SPDT) switch, in order to correct for DC offsets introduced by the delay-line low-pass filter and the SPDT switch during periods when signal transmission was blocked1. The front-end ECG analog output was acquired with a CompactRIO microprocessor (National Instruments, Austin, TX) for DC-offset monitoring. A feedback loop, with the feedback voltage controlled by a microprocessor, removed most of the DC offsets (down to 0.05mV) produced by the switch and the delay-line/ low-pass filter (data not shown).
Figure 2.
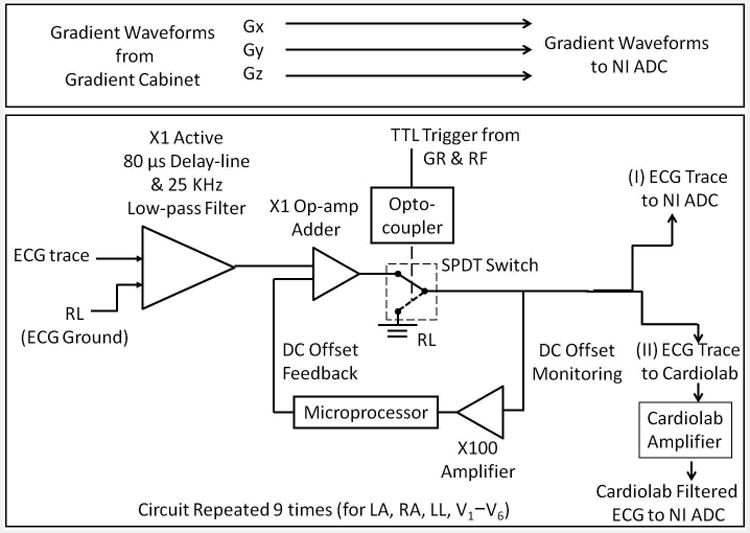
Block diagram of the MRI-conditional 12-lead ECG front end. The front end enabled patient-isolation via a differential pre-amp/delay-line at its input. It also allowed for blocking strong signals via a TTL-controlled single pole, double throw (SPDT) switch. The circuit had two outputs. Set-up I sampled ECG waveforms in their spectral form without any filtering, while Set-up II sampled using the CardioLab IT digital electrophysiology recording system.
We provided two methods for sampling the ECG traces (Fig. 2, rightmost):
Set-up I: In order to measure the full spectrum of the ECG signal, as well as the gradient induced voltages superimposed on the ECG signals, the circuit output was sent directly to a PCI-6251 Digital Acquisition (DAQ) board (National Instruments, Austin, TX) which digitized the ECG waveforms at a rate of 48 kHz. The maximum input voltage of the NI DAQ board was set at ±10 Volts, so none of the ECG traces were clipped. All ECG measurements were referenced to the RL lead.
Set-up II: In order to measure the ECG spectrum as it appears after filtering, the circuit output was sent to a CardioLab IT digital electrophysiology recording system (General Electric, Waukesha, WI) which applied Butterworth 1st -order 0.05Hz high-pass and 3rd -order 100Hzlow-pass filters to the input signal. The CardioLab amplifier gain was set to either 1000 or 100, which allowed precordial leads to be acquired without saturation. The CardioLab pre-processing and larger-input gain, relative to set-up I, resulted in a maximum input amplitude of ∼10 mV peak-to-peak (with the amplifier gain set at 1000) after the hardware filtering, so that most limb lead traces acquired during imaging were saturated, and their traces are therefore not shown in the context of set-up II. On the other hand, the noise figure of the precordial lead traces from CardioLab was superior to those obtained with set-up I, primarily due to the induction of 60 Hz noise present in the MRI operator room into the NI ADC. The ECG traces were output from CardioLab in analog form and re-digitized by the NI DAQ board. All measurements were referenced to the RL lead. The precordial lead traces to had each lead voltage (V1 to V6) subtracted by the Wilson Central Terminal (WCT) voltage, i.e. , where WCT = (LL + RA + LA)/3 and k =1 to 6;
The x, y and z gradient waveforms were transmitted from the MRI gradient cabinet and digitized by the NI DAQ board simultaneously with the ECG traces, as illustrated in Fig. 2's top panel. The SPDT switching feature has been previously detailed 1 and was not utilized in this study. Its possible role will be addressed in the Discussion section.
Data Processing
First, a clean ECG trace of a complete cardiac cycle, which will be referred to as a template, for a given ECG channel k was extracted from the portion of ECG traces acquired during pauses in acquisition (i.e., time periods without gradient activity). This template was then concatenated to align with an ECG trace acquired during gradient activity, which will be referred to as the corrupted ECG trace, for the same channel. By subtracting the clean ECG from the corrupted ECG trace for each channel, the gradient-induced ECG voltages Sk(t) were computed for all channels.
In the signal processing workflow (Fig. 3), a training step using a parallel imaging accelerated MRI pulse sequence, detailed in the Human studies section, was performed, during which ECG traces and gradient waveforms were recorded. To calculate the 19 coefficients of Eq. 1, a total of 4 steps (Fig. 3 left panel) consisted of performing numerical differentiation of the gradient waveforms, and calculating a template of clean ECGs for each channel by averaging over the QRS cycles without gradient-activity after these were adjusted to be of the same temporal duration, in cases of heart-rate variability.
Figure 3.
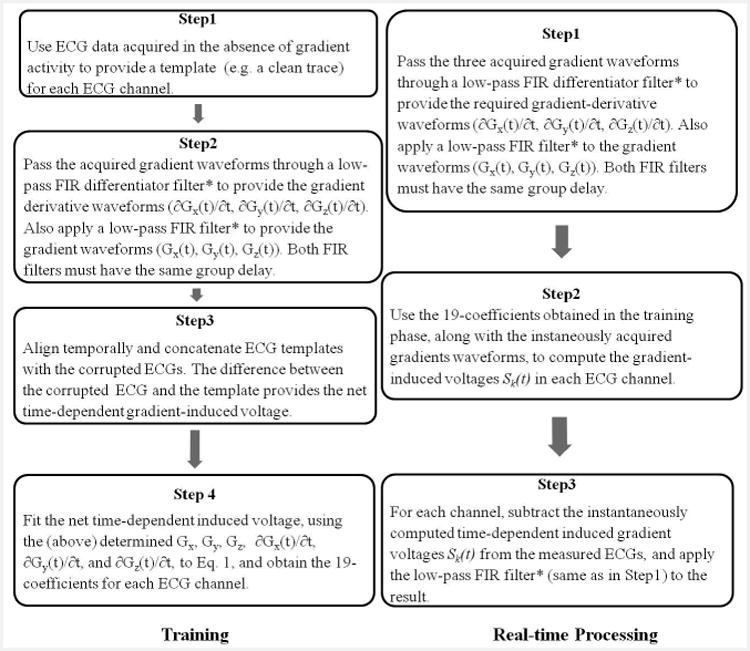
The workflow of training (left) and real-time processing (right) stages. The signal processing performed to remove the gradient-induced voltages consisted of two stages. A training stage followed by real-time induced-voltage removal during image acquisition with continuous display of restored ECG traces. *The FIR filter cut-off frequency was above 500Hz or above 200Hz for ECGs acquisition with Set-up I or II respectively, and has a group delay <5ms.
For data acquired with hardware Set-ups I or II, Finite Input Response (FIR) low-pass filtering with cut-off frequencies of above 500 or above 200 Hz, respectively, were applied to the gradient waveforms and their derivatives, removing higher-frequency components. For set-up II, this cut-off frequency aligned with filtering performed by the CardioLab system during ECG signal acquisition.
The template was then aligned with the corrupted ECG traces, with their difference providing the net gradient-induced voltage on each ECG channel, i.e. Sk(t) of Eq. 1. The over-determined system, with over 105 data points per electrode for 19 unknowns, was solved by calculating the least-square solution (Matlab, Natick, MA), which delivered the 19 coefficients in Eq. 1 for each ECG channel. Total processing time was approximately 10 seconds on an HP XW8600 workstation.
After the training stage was completed, real-time processing was performed to remove the induced voltages (Fig.3 right panel), during the acquisition of a full-length MRI sequence, with the induced-voltage for each channel continuously calculated, based on Eq. 1, using the simultaneously acquired gradient waveforms as input. The computed induced voltage was then subtracted from the corresponding channel's corrupted ECGs, providing restored ECG signal in real-time (lag time of <5ms) during the imaging acquisition.
Performance Evaluation Parameters
The quality of the gradient-induced voltage removal was measured by computing the following metrics over complete cardiac cycles:
-
Fitting Assessment: Let s(n) and ŝ(n) represent the fitted and measured gradient-induced voltages, with n being the discrete time index. FIT estimates the goodness of the fit between s(n) and ŝ(n), and is defined as the following
(3) -
Correlation Assessment: Let x(n) represent the clean ECG trace acquired with no gradient activity, and y(n) represent the restored ECGs during gradient-activity (i.e. the corrupted trace with the gradient-induced voltage removed), with n being the discrete time index. The cross-correlation coefficient CORR between x and y is
(4)
where 〈·〉 denotes the average over the observed time series, μx and σx are the mean and standard deviation of x, and μy and σy are the mean and the standard deviation of y.
We also studied the variation of the gradient induced voltage between different imaging orientations using the same imaging sequence, between imaging sequences, as well as between subjects with differing chest geometries. The repeatability of the parameter regression was analyzed by performing regression twice for each repeated acquisition, covering a range of slice orientations, and displaying the results in Bland-Altman plots.
Human Studies
For each subject, carbon fiber electrodes, as used in the previous study1, were attached to the chest skin, and 12-lead ECG traces were acquired inside a Siemens Skyra 3T (peak gradient 45 mT/m, slew rate 200 mT/m/msec) scanner from 9 male healthy volunteers (age 38 ± 10 yr) under an approved institutional IRB with informed consent. All training stage ECG traces were collected during breath-holds, which were composed of interleaved periods in which the MR sequence was silent or running. In the real-time processing stage, ECG traces were also collected during breath-holds, excluding in a case when a volunteer was studied immediately after leg exercises inside the magnet bore, where the subject maintained shallow breathing. The amplitudes of the ECG traces reported throughout this paper are the initial values before the gain of the amplification system (i.e. the actual ECG voltages emanating from the human body).
Several non-ECG-gated MR sequences were performed, including 2D balanced Steady State Free Precession (bSSFP), 2D Gradient echo (GRE) and 3D Fast Spin Echo (FSE), and their acquisition parameters are listed in Table 2. MR imaging was performed covering the left-ventricle, with orientations along axial, coronal, sagittal and oblique directions. The full-resolution imaging sequences used an acceleration factor (GRAPPA) of 2, while the training sequences used higher parallel-imaging acceleration factors (GRAPPA = 6 - 8), thus skipping phase-encoding steps, but covering the full range of phase-encodings. Additionally, the training sequences were all single-slice sequences, while the full-resolution sequences utilized single- or multiple-(parallel)-slice acquisitions lasting 3-20 seconds.
Table 2.
Parameters of sequences performed during the ECG data acquisition. The sequence durations depended on the number of averages prescribed in the sequence.
| TR (ms) | TE (ms) | Flip Angle (°) | FOV (mm2) | ACQ Matrix | Slice Thickness (mm) | Receiver Bandwidth (Hz/pixel) | Total Duration (sec) | |
|---|---|---|---|---|---|---|---|---|
| 2D bSSFP | 3.09 | 1.32 | 28 | 400 × 280 | 240 × 168 | 8 | 1490 | 3 - 5 |
| 2D GRE | 20 | 1.97 | 25 | 300 × 300 | 128 × 128 | 5 | 1955 | 4 - 10 |
| 3D FSE | 1500 | 151 | 120 | 280 × 192 × 54 | 256 × 176 | 1.5 | 500 | 20 |
Results
Set-up I: Full Bandwidth Acquisitions
Using Set-up I, we acquired the full amplitude and frequency spectrum of the 12-lead ECG traces, including the gradient-induced voltage component. The recorded voltages during a bSSFP acquisition reached up to700mV peak-to-peak (Fig. 1E). QRS complex features (i.e. a clean trace) could be observed after applying a 30-Hz low-pass filter (Fig. 1 A, C, E, G insets) to periods without gradient activity. As demonstrated in Fig. 1B, D, F, H, the gradient-induced voltages for bSSFP had frequency components within the ECG pass-band (up to 100 Hz) as well as at higher requencies. Multiple harmonics of the sequence repetition frequency (TR-1 = 320 Hz) were observed. Regression of the LL lead traces to the 19-parameter equation exhibited a high-degree of agreement under several low-pass filter settings (Fig. 1J). Although the fitted parameters varied with filter settings (Fig. 1K), the 2nd-order coefficients p9, p13 and p14 remained large values even at the lowest cut-off frequency setting.
Set-up II: Restricted Bandwidth Acquisitions
In our restricted bandwidth acquisitions using Set-up II, the commercial ECG recording system incorporated 100Hz low-pass filtering at signal input. Since the magnitude of the gradient- induced voltages was higher than 10 mV in the limb leads, resulting in saturated traces, we are only able to show results from the precordial leads.
An example of restored ECG traces during a GRE sequence is shown in Fig. 4. The lower three rows in Fig. 4A provided the recorded gradient waveforms during imaging. In an expanded view of the imaging period (Fig. 4B), it can be seen that the 19-parameter equation allowed sufficient removal of the spikes (in red), so that the restored ECG traces during imaging segments appeared almost identical to those observed outside the imaging interval, and the QRS complexes could be identified (black arrows in Fig. 4B). The performance evaluation is FIT = 0.71 ± 0.10 and CORR = 0.64 ± 0.12 across all precordial traces.
Figure 4.
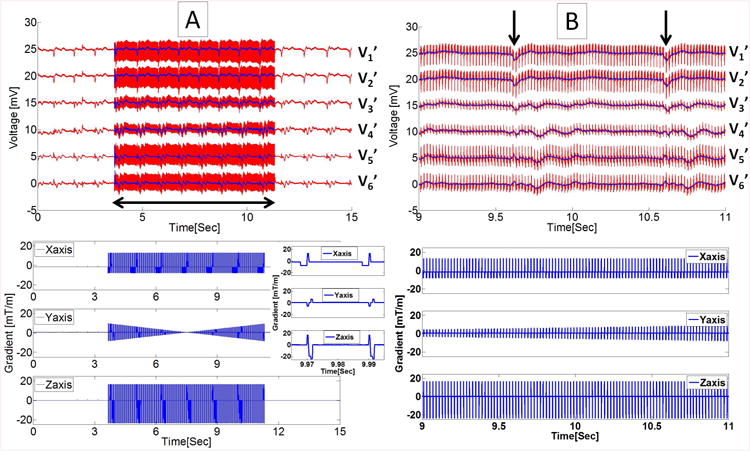
ECG signals, recorded with Set-up II during 20ms TR transverse GRE sequence. (A) Top panel displays recorded traces (red) and restored traces using 19-parameter fit (blue) for the precordial leads V1'-V6', and bottom panel shows the gradient waveforms recorded during the MRI acquisition (horizontal double-sided arrow). The inset shows zoomed view of gradient waveforms during two consecutive TRs. (B) The zoomed view of ECG traces shown in the top with R waves indicated by black vertical arrows, and corresponding gradient waveforms at bottom over a 2 sec period.
An example of ECG traces during 3D FSE acquisition is shown in Fig. 5A. In the expanded portion of the imaging interval (Fig. 5B), induced voltages of ∼5mV appeared at the beginning and end of each echo-train, during slab-select and slab-dephasing gradients along the X-axis. The 19-parameter function was able to largely remove these strong induced voltages, and the performance evaluation is FIT = 0.64 ± 0.10 and CORR = 0.86 ± 0.07 across all precordial traces. The induced-voltages also persisted at the end of each slice, for ∼0.1 seconds after the gradients are no longer pulsing. This residual voltage could be due to the “ringing” of CardioLab's receiver amplifier, which is not currently addressed in Eq. 1.
Figure 5.
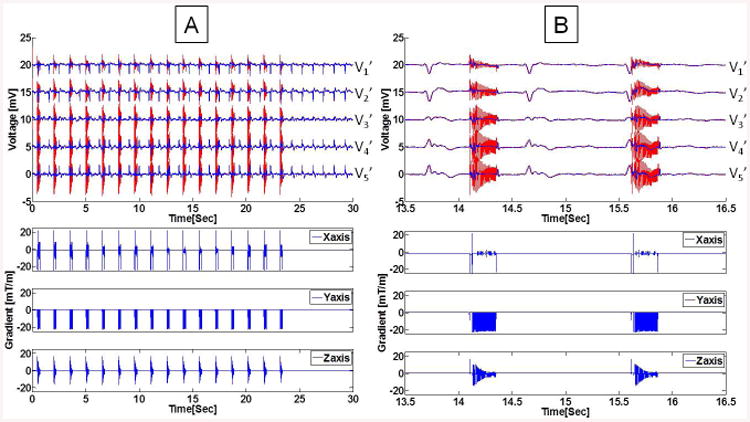
Example of ECG traces during a coronal 3D FSE sequence, collected with Set-up II. (A) Imaging sequence consisting of 16 echo trains, followed by clean ECGs. The restored ECG signal, after subtraction of the 19-parameter system response function, resulted in the blue traces. (B) Expanded view of two FSE bursts show the strong induced voltage at the beginning and end of each echo train (red traces), which are not completely corrected by the 19-parameter equation. The echo train bursts fell in different cardiac cycle phases, due to the use of non-ECG-gated acquisition. V6' was acquired with low quality and omitted in this plot.
In cases of multi-slice bSSFP acquisition recorded in one subject, ECGs were recorded at a stable heart rate (Fig. 6A) and immediately after extensive exercise in the MRI (Fig. 6C) during which the heart rate varied between 90 to 70 beats per minute (BPM). The fitted parameters derived from the training data were sufficient for corrections of multiple parallel slice acquisitions under both conditions (Fig. 6A, C). The statistics of the 19-parameter fit (Fig. 6B, D) show that the fitting (FIT) is consistent across slices, and there are strong correlations (CORR>0.5) between the restored ECG traces and the true ECGs.
Figure 6.
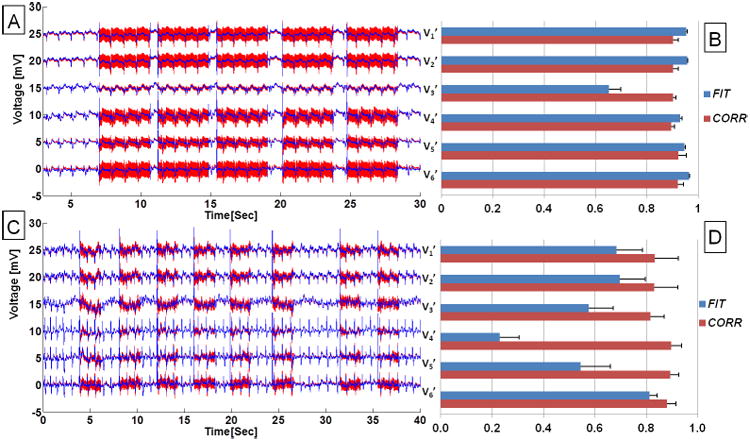
ECGs acquired in a volunteer during a multi-slice bSSFP full resolution acquisition. Precordial ECG traces acquired with set-up II during (A) a stable physiological condition, and (C) relaxation following leg exercises inside the scanner with heart rate dropping from 90 to 70 BPM. Red traces are acquired ECG traces and blue traces are after removal of gradient-induced voltages using the 19-parameter fit. (B, D) Bar plots showing statistics of fit for ECGs acquired and recovered during acquisition of the 5- and 8-parallel bSSFP slices, respectively. FIT and CORR were defined in Eq. 3 and 4, correspondingly.
Supplementary figures are provided to demonstrate, for ECG traces acquired during bSSFP, the importance of using the complete 19-parameter fit model. As shown in Supporting Figure S1B, there is an average of 12% improvement in the fitting error when adding second-order coefficients to the first-order coefficients, with >25% improvement observed in pericardial leads that are farther from isocenter (V5 and V6). When using first-order regression (Supporting Figure S2), there is a statistical significance (p <0.05) using all 7 parameters, versus only the gradient-time-derivatives or only the gradient-strength terms.
We also tested changes in regression parameters with varying TR, FOV, and the spatial resolution in bSSFP. The regression parameters remained unchanged when the spatial resolution stays the same, regardless of FOV changes. The importance of second-order coefficients increased concurrently with a strong reduction in TR of bSSFP, which could be due to an increasing importance of the 2nd order coefficients when gradients along multiple axes are applied simultaneously.
Variation of Induced Voltages across Channels and Subjects
The variation of fitted parameters among 3 volunteers imaged with the same sagittal bSSFP sequence is displayed in vectorial format (Fig. 7A). For purposes of display ease, only the 1st-order parameters p1k – p6k are plotted. It can be seen that the size of the parameters varies consistently between the precordial channels, with the gradient-strength terms p4k – p6k occuring largest in V6′, which is the precordial electrode further closest to the induced hot-spots shown in Bencsik et al. 11, while the gradient-time-derivative terms p1k – p3k vary in a different manner among subjects. The large variation in the size and vectorial orientation of the parameters among subjects, could result from inter-subject variations in the distribution of tissues, such as the size of the adipose fat layer and torso dimensions, which varied greatly among the subjects we imaged.
Figure 7.
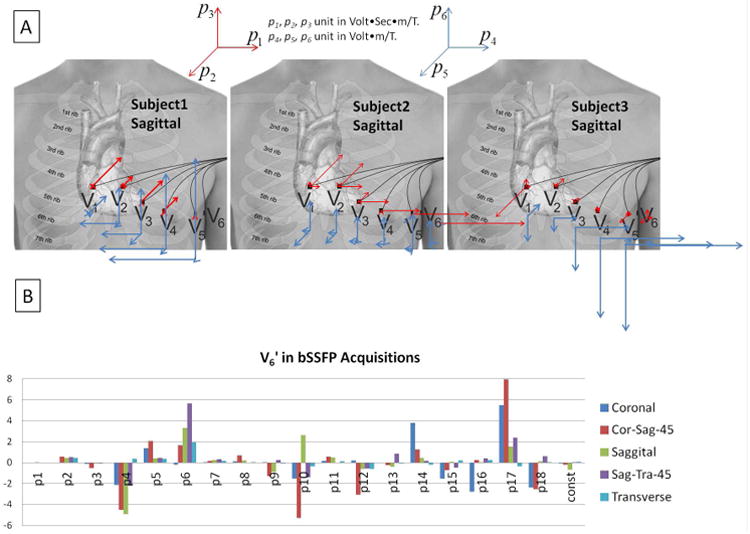
(A) The first 6 fitted parameters (1st-order coefficients) for 3 subjects during sagittal bSSFP imaging with phase-encoding performed along the y direction (Anterior-Posterior). The 3D vector plots in the center illustrate graphically the size and direction of the coefficients for the precordial electrodes V1'-V6', with the origin of each vector placed at the approximate spatial position of the respective electrode. Red arrows denote p1k – p3k, which multiply the gradient derivatives along the 3 directions, and blue arrows denote p4k – p6k, which multiply the 3 gradients. A gradually increasing influence of the magnetic gradient fields on the ECG noise was observed from V1' to V6' in all subjects, although the magnitude of the gradient-induced voltage varied greatly among subjects. (B) Variation of the 19 fit coefficients during bSSFP acquisitions along different slice planes in a volunteer. Cor-Sag-45 and Sag-Tra-45 designate 45-degree oblique angles between the Coronal and Sagittal, and Sagittal and Transverse orientations, respectively.
The large variation of fitted parameters with different slice orientations is illustrated in Fig. 7B. As expected, the largest 2nd order gradient-induced voltages are in the Cor-Sag-45 orientation, since during oblique acquisitions stronger gradients are applied, and multi-directional gradients are applied simultaneously.
Repeatability Experiments to Determine the Stability of Equation 1 Parameter Fitting
ECG traces were acquired during the same bSSFP sequence at two different times within the same imaging session. Data in each time was then regressed independently to examine the repeatability of the parameter evaluation algorithm, and is demonstrated in Bland-Altman plots for all 19 parameters (Fig. 8). The fitted parameters had a wide range because the repeated bSSFP sequences were acquired along various orientations. In addition, the Pearson's correlation coefficient for repeated evalulation of 19 parameters is ρ = 0.996 in average.
Figure 8.
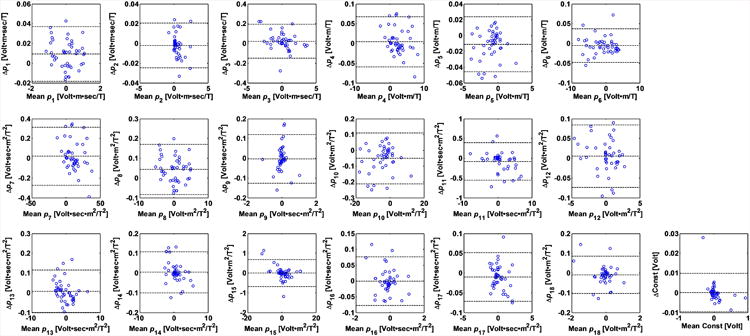
Repeatability measurement of the parameter fitting shown in Bland-Altman plots of all 19 parameters in their SI units listed in Table 1. The 3 dotted lines within each plot indicate upper 95% confidence interval, average, and lower 95% confidence interval of the parameter fitting. The vertical axis represents the difference of the parameters of the repeated scans, and horizontal axis represents the average of the parameters of the repeated scans. ECGs were collected twice during the acquisition of bSSFP sequences along each of 9 different spatial orientations. Since the fitted parameters varied as the orientation changes, a large variation in the fit parameter values can be observed (the abscissa of the graphs). Variations in the fitted parameters can be observed in the small size of the vertical dimension.
Discussion
This study has demonstrated that the magnitude of voltages induced by the MRI gradient coils is of the order of prior theoretical predictions 11. We have shown, for the first time, the frequency spectrum of the induced voltages in the human body in the span of 0 to 24000Hz.
We have also demonstrated that the gradient-induced voltages can be characterized by a theoretically derived equation for the electric field. This equation closely fit the induced voltages observed in all the 12-lead ECG electrodes, during acquisition of all the MRI pulse sequences tested in this study. The fit quality was superior for GRE and bSSFP sequences, relative to 3D FSE. The computed induced voltages did not, however, capture the spikes at the beginning and end of each FSE burst, which may result from the non-linear response of the receiver to strong input signals. We also found that the analysis was sensitive to the temporal alignment between the template (acquired in the absence of gradient activity) to the corrupted traces acquired during imaging. The calculated 19 parameters varied between ECG channels, as predicted by Eq. 1, with the 2nd -order coefficients playing a greater role for electrodes placed farther from the magnet isocenter.
A confounding result of our findings was the directional and sequence dependence of the regressed coefficients. Our explanation is the lack of vectorial components in Eq. 1's coefficients results from use of conventional ECG electrodes which measure the electric-field magnitude. The electric-field perpendicular to the surface is discontinuous at the boundary of the body and air. Each electrode, depending on its individual orientation (as determined by its placement on the body surface), measures some weighted sum of three electric-field components. As the imaging orientation changes, the field that arrives at the body surface is a different mix of these three components. Due to the sensitivity of ECG electrodes to each of these spatial electric fields, a different total induced voltage is measured. This issue was discussed previously in the context of ECG tomography15 It has been shown 10 possible to measure the individual field component using sophisticated electrode designs, which may resolve the individual factor contributing to each of the 19 coefficients (see Eq. A9 and A14), and further allow a single training scan for all orientations of a single sequence.
An additional limitation of Eq. 1 is the insufficient correction for the amplifier's non-linear response following the sudden arrival of strong input signals16,17, which occurred frequently at the beginning of gradient bursts, leading to a DC offset, followed by an exponential relaxation (“ring-down”) period. The constant term (DC offset) in Eq. 1 deals with this effect to the lowest order, but a more general approach may include higher-order time-dependent components (e.g. Cons1kt + Cons2kt2, where Cons1k and Cons2k are electrode-specific constants, and t is time.), or convolving Eq. 1 with an exponential-decay term.
In the future, it is possible to omit the training sequence, and resolve the fitting parameters iteratively during the first few gradient cycles (i.e. TRs) of the imaging sequence, such as those performed during dummy-cycles for establishing equilibrium magnetizations in the bSSFP and GRE sequences.
The current hardware circuit did not incorporate the electronic (SPDT) switch (Fig. 2I). In the future, the SPDT switch may be employed during the imaging sequence, to remove high-amplitude signals that cause amplifier saturation. Employing the switching feature, it might be possible to acquire limb lead traces with set-up II. The instances where large induced-voltages (spikes) occur within imaging sequences can be anticipated, once the coefficients of Eq. 1 are derived. Use of the switching feature also removes the need to perform low-noise acquisition over the full dynamic range of the gradient-induced voltage, which, as shown here, currently spans a 16-bit range (from 100 μV to 10 V). Because the amplitude of gradient-induced voltages is associated with the area of the conduction loops, in our 12-lead ECG setup, the gradient-induced voltages were larger due to the farther placements of electrodes, relative to 4-lead ECGs which are commonly acquired with shorter distances between leads. With the advent of higher-performance (higher slew rate and peak) gradient systems, the dynamic-range requirements are expected to increase.
Supp MaterialS1. Supplementary Material
Supporting Figure S1. Contribution of second-order terms in the fitting of gradient-induced voltages. (A) Goodness of fit in terms of root mean square error (RMSE) of bSSFP sequences along 9 various imaging planes. (B) The improvement of RMSE, calculated by difference of RMSE by 19 parameter and 7 parameter fitting, and then normalized by RMSE of 7 parameter fitting. An average of 12% improvement was observed among all precordial leads, and more than25% improvement in V5 and V6 which are farther from magnet isocenter.
Supporting Figure S2. Comparison of contributions to the fit from constant (Gradient strength) components and time-varying (Gradient time-derivative) first order components for bSSFP in the six precordial leads V1-V6. * represents p < 0.05 in paired two-tail Student's T tests. Here 7param denotes the complete seven-parameter (first-order) regression, 4param_excluding_gradient_strength_terms denotes a 4-parameter regression using only the gradient time derivatives, and 4param_excluding_gradient_time_derivative_terms denotes a 4-parameter regression using only the gradient-strength terms.
Table 1.
The SI units of 19 parameters used in the system response function described in Eq. 1.
| p1 | Volt·m·sec/T |
| p2 | Volt·m·sec/T |
| p3 | Volt·m·sec/T |
| p4 | Volt·m/T |
| p5 | Volt·m/T |
| p6 | Volt·m/T |
| p7 | Volt·sec·m2/T2 |
| p8 | Volt·m2/T2 |
| p9 | Volt·sec·m2/T2 |
| p10 | Volt·m2/T2 |
| p11 | Volt·sec·m2/T2 |
| p12 | Volt·m2/T2 |
| p13 | Volt·sec·m2/T2 |
| p14 | Volt·sec·m2/T2 |
| p15 | Volt·m2/T2 |
| p16 | Volt·sec·m2/T2 |
| p17 | Volt·sec·m2/T2 |
| p18 | Volt·m2/T2 |
| Const | Volt |
Acknowledgments
We appreciate the help from Mikayel Dabaghyan, Ph.D., in data acquisition and Claudio P Mejia in discussions of the GE CardioLab system configurations. We also acknowledge grant support from NIH 1 R03-EB013873-01A1 and P41EB015898, as well as AHA 10SDG261039.
Appendix: The ECG Gradient-Induced Voltage's explicit dependence on the MRI gradient fields
Dynamic magnetic fields B⃗ create electric fields E⃗, according to Maxwell's equation:
| (A1) |
where ∇ × denotes the curl operator.
A. The First order approximation
The magnetic field in an MRI scanner can be expressed as:
where B⃗0 is the static magnetic field of the MR magnet, and Gx, Gy, Gz are its spatial gradients.
Consequently, we can express the time varying magnetic field as:
| (A2) |
which expands as
| (A3) |
The magnetic field created by the gradient coils in the MRI scanner can be expressed as
| (A4) |
where i represents the three gradient coils inside each MRI scanner.
Each gradient coil creates fields in all three spatial directions, so we write
| (A5) |
where j = x, y, z and
We commonly refer to the gradients used in MRI imaging, since only the z-component of the magnetic field is of interest for purposes of changing the phase of transverse spin magnetization, as Gx = G13, Gy = G23, Gz = G33
We further assume that the electric field generated by the gradients can be expressed as a sum of decaying spherical waves, so that
| (A6) |
where E⃗m is the initial amplitude, L is the wave-number, and rm is the source location.
Therefore
| (A7) |
which is true for ionic current flow (velocity outside heart is 20-30 cm/s 18-22) at distances larger than ∼3 cm (at frequencies ≥ 10 Hz), from the sources.
Eq. A1 can therefore be expressed as
| (A8) |
where Ej is the electric field along x, y or z direction and represents the velocity of electrically charged particles (e.g. ions) which change their position over time, so that they are affected by the spatially-varying electric fields and create fields of their own23, 24.
By measuring the current flowing through each gradient coil in the system (a signal which is typically available in the gradient cabinet), we can determine:
Gx =G13(t), and its time derivative
Gy =G23(t), and its time derivative
Gz =G33(t), and its time derivative
Here we make the following assumptions *
These Kij are similar to the Maxwell terms used to reduce artifacts resulting from these magnetic fields in echo planar and phase-contrast imaging 12, 14.
The constants Kij are spatially dependent, and therefore are different for each surface electrode, so that we can further express Eq. A8 as
| (A9) |
This becomes, after regrouping of terms
or
| (A10) |
The system response function for the gradient-induced voltages measured at the 9 independent surface electrodes (k = 1, 2, … 9), in a 12-lead ECG experiment is
| (A11) |
where r is the distance from this electrode to the reference electrode (RL for most ECG systems) and is the vectorial-summed field measured by the electrode. It can therefore be expressed as:
| (A12) |
where Ck is a constant parameter added to adjust for the DC offset frequently observed in the ECG amplifiers during the onset of strong input signals.
The values p1k – p6k and Ck are determined based on the measured ECG gradient-induced voltage Sk, the gradient waveforms G, and their time-domain derivatives .
B. Second order approximation
Concomitant magnetic fields with a non-linear spatial dependence are present whenever a linear gradient is activated. Assuming x and y gradient coils are of the same design, but with a 90° coaxial rotation between them, and assuming they are placed symmetrically inside the bore, the concomitant magnetic field to the lowest order is expressed as 14
| (A13) |
Note that the first three terms involve fields that are proportional to G2, and the last two cross-terms are non-zero only when multiple gradient coils are activated at the same time.
We can then express the time derivatives of this field as
| (A14) |
Overall, grouping the first-order and second-order effects, the induced voltage Sk(t) can then be expressed as a 19-parameter function
| (A15) |
where the coefficients Ck, p1k … p18k are determined based on the ECG gradient-induced voltage Sk(t), the gradient waveforms G and their time-domain derivatives .
The second order terms are expected to be largest in the ECG limb leads (LL, LA, RA), when the heart is placed at the magnet isocenter, since these leads are then farther away from the scanner's isocenter.
* Note that when ∇ × B⃗ = 0, which is not strictly valid for the 12-lead ECG case11, since there are currents flowing in the body, simpler relationships exist between the Gij. 14
References
- 1.Tse ZT, Dumoulin CL, Clifford GD, Schweitzer J, Qin L, Oster J, Jerosch-Herold M, Kwong RY, Michaud G, Stevenson WG, Schmidt EJ. A 1.5t mri-conditional 12-lead electrocardiogram for mri and intra-mr intervention. Magn Reson Med. 2013;71:1336–1347. doi: 10.1002/mrm.24744. [DOI] [PMC free article] [PubMed] [Google Scholar]
- 2.Gregory TS, Schmidt EJ, Zhang SH, Ho Tse ZT. 3dqrs: A method to obtain reliable qrs complex detection within high field mri using 12-lead electrocardiogram traces. Magnetic Resonance in Medicine. 2014;71:1374–1380. doi: 10.1002/mrm.25078. [DOI] [PMC free article] [PubMed] [Google Scholar]
- 3.Wu V, Barbash IM, Ratnayaka K, Saikus CE, Sonmez M, Kocaturk O, Lederman RJ, Faranesh AZ. Adaptive noise cancellation to suppress electrocardiography artifacts during real-time interventional mri. J Magn Reson Imaging. 2011;33:1184–1193. doi: 10.1002/jmri.22530. [DOI] [PMC free article] [PubMed] [Google Scholar]
- 4.Oster J, Pietquin O, Kraemer M, Felblinger J. Nonlinear bayesian filtering for denoising of electrocardiograms acquired in a magnetic resonance environment. IEEE Trans Biomed Eng. 2010;57:1628–1638. doi: 10.1109/TBME.2010.2046324. [DOI] [PubMed] [Google Scholar]
- 5.Oster J, Pietquin O, Abacherli R, Kraemer M, Felblinger J. Independent component analysis-based artefact reduction: Application to the electrocardiogram for improved magnetic resonance imaging triggering. Physiol Meas. 2009;30:1381–1397. doi: 10.1088/0967-3334/30/12/007. [DOI] [PubMed] [Google Scholar]
- 6.Odille F, Pasquier C, Abacherli R, Vuissoz PA, Zientara GP, Felblinger J. Noise cancellation signal processing method and computer system for improved real-time electrocardiogram artifact correction during mri data acquisition. IEEE Trans Biomed Eng. 2007;54:630–640. doi: 10.1109/TBME.2006.889174. [DOI] [PubMed] [Google Scholar]
- 7.Abacherli R, Hornaff S, Leber R, Schmid HJ, Felblinger J. Improving automatic analysis of the electrocardiogram acquired during magnetic resonance imaging using magnetic field gradient artefact suppression. J Electrocardiol. 2006;39:S134–139. doi: 10.1016/j.jelectrocard.2006.05.028. [DOI] [PubMed] [Google Scholar]
- 8.Abacherli R, Pasquier C, Odille F, Kraemer M, Schmid JJ, Felblinger J. Suppression of mr gradient artefacts on electrophysiological signals based on an adaptive real-time filter with lms coefficient updates. MAGMA. 2005;18:41–50. doi: 10.1007/s10334-004-0093-1. [DOI] [PubMed] [Google Scholar]
- 9.Bowtell R, Bowley RM. Analytic calculations of the e-fields induced by time-varying magnetic fields generated by cylindrical gradient coils. Magn Reson Med. 2000;44:782–790. doi: 10.1002/1522-2594(200011)44:5<782::aid-mrm16>3.0.co;2-7. [DOI] [PubMed] [Google Scholar]
- 10.Glover PM, Bowtell R. Measurement of electric fields due to time-varying magnetic field gradients using dipole probes. Phys Med Biol. 2007;52:5119–5130. doi: 10.1088/0031-9155/52/17/001. [DOI] [PubMed] [Google Scholar]
- 11.Bencsik M, Bowtell R, Bowley R. Electric fields induced in the human body by time-varying magnetic field gradients in mri: Numerical calculations and correlation analysis. Phys Med Biol. 2007;52:2337–2353. doi: 10.1088/0031-9155/52/9/001. [DOI] [PubMed] [Google Scholar]
- 12.Meier C, Zwanger M, Feiweier T, Porter D. Concomitant field terms for asymmetric gradient coils: Consequences for diffusion, flow, and echo-planar imaging. Magn Reson Med. 2008;60:128–134. doi: 10.1002/mrm.21615. [DOI] [PubMed] [Google Scholar]
- 13.Zhou XJ, Du YP, Bernstein MA, Reynolds HG, Maier JK, Polzin JA. Concomitant magnetic-field-induced artifacts in axial echo planar imaging. Magn Reson Med. 1998;39:596–605. doi: 10.1002/mrm.1910390413. [DOI] [PubMed] [Google Scholar]
- 14.Bernstein MA, Zhou XJ, Polzin JA, King KF, Ganin A, Pelc NJ, Glover GH. Concomitant gradient terms in phase contrast mr: Analysis and correction. Magn Reson Med. 1998;39:300–308. doi: 10.1002/mrm.1910390218. [DOI] [PubMed] [Google Scholar]
- 15.Mantynen V, Konttila T, Stenroos M. Investigations of sensitivity and resolution of ecg and mcg in a realistically shaped thorax model. Phys Med Biol. 2014;59:18. doi: 10.1088/0031-9155/59/23/7141. [DOI] [PubMed] [Google Scholar]
- 16.Stuart RD. Transient response of direct current amplifier systems. Br J Appl Phys. 1959;10:326–336. [Google Scholar]
- 17.Bardelli L, Poggi G, Bini M, Pasquali G, Taccetti N. Time measurements by means of digital sampling techniques: a study case of 100 ps FWHM time resolution with a 100 MSample/s 12 bit digitizer. Nucl Instrum Methods Phys Res A. 2004;521:480–492. [Google Scholar]
- 18.Gima K, Rudy Y. Ionic current basis of electrocardiographic waveforms: A model study. Circ Res. 2002;90:889–896. doi: 10.1161/01.res.0000016960.61087.86. [DOI] [PMC free article] [PubMed] [Google Scholar]
- 19.Yan GX, Antzelevitch C. Cellular basis for the brugada syndrome and other mechanisms of arrhythmogenesis associated with st-segment elevation. Circulation. 1999;100:1660–1666. doi: 10.1161/01.cir.100.15.1660. [DOI] [PubMed] [Google Scholar]
- 20.Yan GX, Shimizu W, Antzelevitch C. Characteristics and distribution of m cells in arterially perfused canine left ventricular wedge preparations. Circulation. 1998;98:1921–1927. doi: 10.1161/01.cir.98.18.1921. [DOI] [PubMed] [Google Scholar]
- 21.Yan GX, Antzelevitch C. Cellular basis for the normal t wave and the electrocardiographic manifestations of the long-qt syndrome. Circulation. 1998;98:1928–1936. doi: 10.1161/01.cir.98.18.1928. [DOI] [PubMed] [Google Scholar]
- 22.Yan GX, Antzelevitch C. Cellular basis for the electrocardiographic j wave. Circulation. 1996;93:372–379. doi: 10.1161/01.cir.93.2.372. [DOI] [PubMed] [Google Scholar]
- 23.Cohen D. Measurement of the magnetic field produced by the human heart, brain and lungs. IEEE Trans Magnetics. 1975;11:694–700. [Google Scholar]
- 24.Cohen DP Y, Cuffin BN, Schmid SJ. Magnetic fields produced by steady currents in the body. Proc Natl Acad Sci USA. 1980;77:1447–1451. doi: 10.1073/pnas.77.3.1447. [DOI] [PMC free article] [PubMed] [Google Scholar]
Associated Data
This section collects any data citations, data availability statements, or supplementary materials included in this article.
Supplementary Materials
Supporting Figure S1. Contribution of second-order terms in the fitting of gradient-induced voltages. (A) Goodness of fit in terms of root mean square error (RMSE) of bSSFP sequences along 9 various imaging planes. (B) The improvement of RMSE, calculated by difference of RMSE by 19 parameter and 7 parameter fitting, and then normalized by RMSE of 7 parameter fitting. An average of 12% improvement was observed among all precordial leads, and more than25% improvement in V5 and V6 which are farther from magnet isocenter.
Supporting Figure S2. Comparison of contributions to the fit from constant (Gradient strength) components and time-varying (Gradient time-derivative) first order components for bSSFP in the six precordial leads V1-V6. * represents p < 0.05 in paired two-tail Student's T tests. Here 7param denotes the complete seven-parameter (first-order) regression, 4param_excluding_gradient_strength_terms denotes a 4-parameter regression using only the gradient time derivatives, and 4param_excluding_gradient_time_derivative_terms denotes a 4-parameter regression using only the gradient-strength terms.


