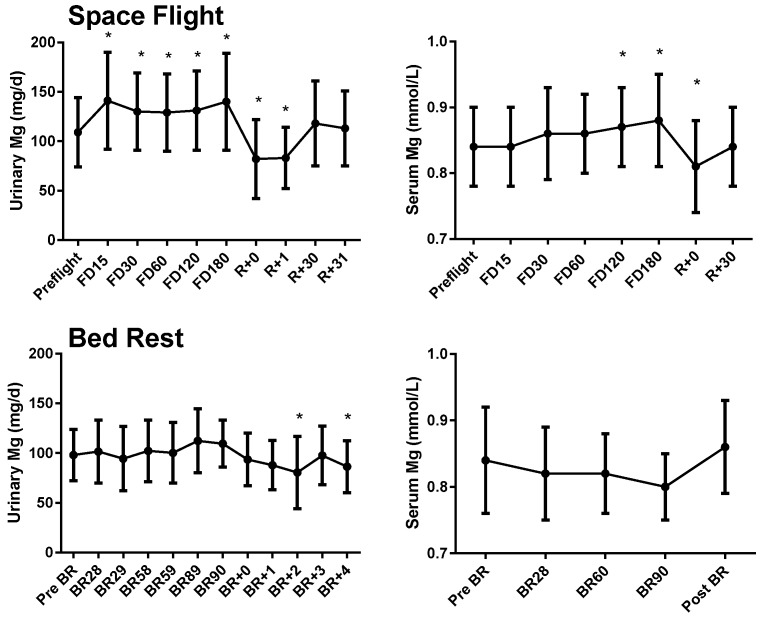
Figure 1.
Urinary (n = 43) and serum (n = 39) magnesium before, during (flight days 15, 30, 60, 120, and 180), and after space flight (0, 1, 30, and 31 days after landing) (upper panels), and before, during, and after bed rest (lower panels, n = 27 urine and serum). Circles and error bars represent mean and SD respectively. * Significantly different from preflight mean (p < 0.05). For bed rest serum magnesium data, there was a significant effect of time (p < 0.05), but the post hoc Bonferroni test did not identify any individual group differences compared to baseline.

