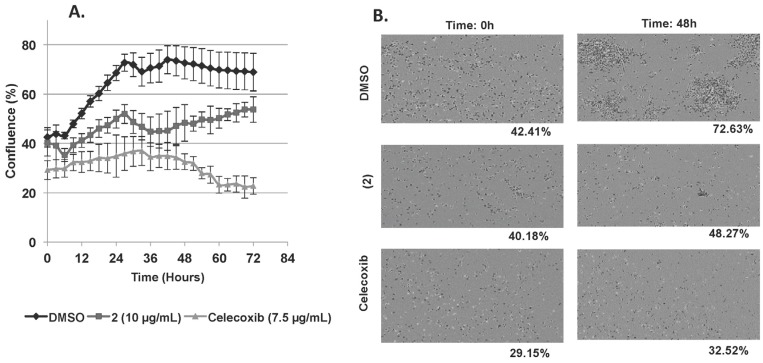
Figure 6.
(A,B) Anti-proliferative effect of (2) at 10 µg/mL on U937 cells was evaluated by Incucyte TM Live-Cell Imaging System and is presented here as U937 cells growth curve plotting confluence vs. time at six hour intervals (A); DMSO and Celecoxib (7.5 µg/mL) were used respectively as negative and positive controls. Data are the mean ± SD (Standard Deviation) of three independent experiments with three samples per experiment. IncuCyte TM images of U937 confluence after 48 h of treatment with (2) versus DMSO and Celecoxib (B).

