

Abstract
Background
The identification of factors involved in the host range definition and evolution is a pivotal challenge in the goal to predict and prevent the emergence of plant bacterial disease. To trace the evolution and find molecular differences between three pathotypes of Xanthomonas citri pv. citri that may explain their distinctive host ranges, 42 strains of X. citri pv. citri and one outgroup strain, Xanthomonas citri pv. bilvae were sequenced and compared.
Results
The strains from each pathotype form monophyletic clades, with a short branch shared by the Aw and A pathotypes. Pathotype-specific recombination was detected in seven regions of the alignment. Using Ancestral Character Estimation, 426 SNPs were mapped to the four branches at the base of the A, A*, Aw and A/Aw clades. Several genes containing pathotype-specific nonsynonymous mutations have functions related to pathogenicity. The A pathotype is enriched for SNP-containing genes involved in defense mechanisms, while A* is significantly depleted for genes that are involved in transcription. The pathotypes differ by four gene islands that largely coincide with regions of recombination and include genes with a role in virulence. Both A* and Aw are missing genes involved in defense mechanisms. In contrast to a recent study, we find that there are an extremely small number of pathotype-specific gene presences and absences.
Conclusions
The three pathotypes of X. citri pv. citri that differ in their host ranges largely show genomic differences related to recombination, horizontal gene transfer and single nucleotide polymorphism. We detail the phylogenetic relationship of the pathotypes and provide a set of candidate genes involved in pathotype-specific evolutionary events that could explain to the differences in host range and pathogenicity between them.
Electronic supplementary material
The online version of this article (doi:10.1186/s12864-015-2310-x) contains supplementary material, which is available to authorized users.
Keywords: Xanthomonas citri, Plant pathogen, Genome evolution, Pathotype evolution, Host range determination, Recombination, Gene islands, Ancestral character estimation, Pathogenicity, Gene presence/absence
Background
Bacteria from the genus Xanthomonas are major phytopathogens of a wide variety of plants and represent species of great agricultural and economic importance [1]. In general, Xanthomonas species have restricted host ranges, each only specializing in the infection of a small number of plant species [2]. Xanthomonas citri pv. citri (previously X. axonopodis pv. citri) is a pathogenic bacterium that infects citrus plants and is the global cause of Asiatic citrus canker [3], resulting in significant crop losses around the world and giving X. citri pv. citri the status of a quarantine organism in some countries that do not face it [3]. X. citri pv. citri invades citrus plants through the stomata or wounds and attacks the plant cells with a range of different virulence factor proteins transported out of the bacterial cell by the Type II-Type VI secretion systems [4]. Both the pathogen and its host species originate from Asia [2, 5].
Strains of Xanthomonas citri pv. citri were subdivided into different pathotypes based on their host specificity and the defense response to infection by different citrus host species. To date there have been three main groups identified, designated A, A* and Aw pathotypes [6, 7]. Pathotype A has the broadest host range, infecting most Citrus species and related genera and is the most agriculturally important of the pathotypes. Conversely, A* and Aw have very limited host ranges and have only been isolated from Key lime (Citrus aurantifolia) and alemow (C. macrophylla). The A* strains were isolated from Key lime in several countries in Asia, and were recognized as a distinct pathotype from the A strains due to their inability to develop canker lesions on grapefruit [7, 8]. The Aw pathotype differ from the A* strains in their ability to elicit a hypersensitive response (HR) on grapefruit and sweet orange [6]. The avrGf1 (syn. xopAG) gene that hasn’t yet been found in the other pathotypes than Aw is at least partly responsible for HR in grapefruit and sweet orange [9–11]. Deletion reduces the HR symptoms in grapefruit and sweet orange, but doesn’t increase the host range of the strain indicating a more complex determination of host range. Transconjugation of avrGf1 or its homolog avrGf2 into A strains elicits a HR in grapefruit, indicating that it can act as a host range restriction factor, even if it isn’t the primary cause of Aw host range restriction [12].
Identifying the underlying causes for the different host ranges of the three closely related X. citri pv. citri pathotypes may provide new targets to aid in the prevention of bacterial diseases and possibly inform new strategies to treat and manage citrus canker outbreaks. Most notably, it would also allow the improvement of our understanding of how bacterial pathogens evolve in terms of host range variations when coevolving with their host(s) in agrosystems, and more generally on plant bacterial disease emergence [13]. Here we use NGS data from 42 strains of X. citri pv. citri representing the three pathotypes and selected on the basis of our current knowledge of the bacterium’s genetic diversity as well as one outgroup strain of X. citri pv. bilvae (also pathogenic to rutaceous species but with a distinct symptomatology [14]), to construct a phylogeny using aligned non-recombinant genomic regions from all strains. Based on this phylogeny, we identify pathotype-specific genomic changes from the level of single base changes to the level of multi-gene islands and regions of recombination.
Results
Sequencing
A summary of the genome sequencing results for the strains is given in Table 1. The GC content, GC-skew and sequence diversity measured for 8 kb sliding-windows over the alignment of all the strains are shown in Fig. 1. There is a clear correspondence between regions of high sequence diversity and low GC content. These regions also regularly coincide with detected genomic islands of differential gene content between the pathotypes, and detected regions of recombination. At the pathotype level, A* strains are the most diverse with an average genome polymorphism of 9.62 × 10⁻⁴ substitutions per site, compared to 6.41 × 10⁻⁴ and 5.27 × 10⁻⁴ substitutions per site for A and Aw respectively as measured by the Hamming distance of their aligned genomes.
Table 1.
X. citri pv. citri strain isolation origin and sequencing information
| Strain | Pathotype | Geographic origin | Isolation host | Year isolated | Reads | Contig number | Total (bp) | N50 | Sequenced by | Mapped (bp) | % reads mapped |
|---|---|---|---|---|---|---|---|---|---|---|---|
| JJ10-1 | A | Rodrigues Island | C. aurantifolia | 1985 | Single reads (100 bp) | 335 | 5179910 | 54680 | GATC | 5027732 | 97.06 |
| LG98 | A | Bangladesh | C. aurantifolia | 2006 | Single reads (100 bp) | 383 | 5164450 | 40179 | GATC | 5022236 | 97.25 |
| JK143-11 | A* | Thailand | Citrus sp. | 1990 | Single reads (100 bp) | 384 | 5278157 | 54326 | GATC | 4993196 | 94.60 |
| LB100-1 | A | Seychelles | C. sinensis x Poncirus trifoliata | 2005 | Single reads (100 bp) | 388 | 5263741 | 54697 | GATC | 5084444 | 96.59 |
| JK4-1 | A | China | Citrus sp. | 1985 | Single reads (100 bp) | 401 | 5203097 | 42527 | GATC | 5065830 | 97.36 |
| LG115 | Aw | India | Citrus sp. | 2007 | Single reads (100 bp) | 408 | 5241689 | 48679 | GATC | 4921584 | 93.89 |
| LG117 | A | Bangladesh | Citrus sp. | 2009 | Single reads (100 bp) | 429 | 5245224 | 53906 | GATC | 5046226 | 96.21 |
| JM35-2 | A* | Saudi Arabia | C. aurantifolia | 1992 | Single reads (100 bp) | 441 | 5251255 | 54005 | GATC | 4956852 | 94.39 |
| JS581 | A* | Iran | C. limetta | 1997 | Single reads (100 bp) | 450 | 5254826 | 54306 | GATC | 5019698 | 95.53 |
| NCPPB 3607 | A* | India | C. aurantifolia | 1988 | Single reads (100 bp) | 520 | 5361783 | 28525 | GATC | 5003494 | 93.32 |
| LH37-1 | A | Senegal | C. paradisi | 2010 | Single reads (100 bp) | 567 | 5405509 | 44606 | GATC | 5093867 | 94.23 |
| NCPPB 3612 | A | India | C. aurantifolia | 1988 | Single reads (100 bp) | 585 | 5349385 | 52462 | GATC | 5082867 | 95.02 |
| LE3-1 | A* | Ethiopia | C. aurantifolia | 2008 | Single reads (100 bp) | 1028 | 5300998 | 10596 | GATC | 4961125 | 93.59 |
| JK48 | A* | Saudi Arabia | C. aurantifolia | 1988 | Single reads (100 bp) | 1054 | 5253806 | 9931 | GATC | 4917915 | 93.61 |
| LG97 | A | Bangladesh | Citrus sp. | 2006 | Single reads (100 bp) | 1211 | 5252003 | 8460 | GATC | 4972934 | 94.69 |
| LB302 | Aw | Florida | C. aurantifolia | 2002 | Single reads (100 bp) | 1222 | 5239509 | 8709 | GATC | 4921146 | 93.92 |
| LG102 | A | Bangladesh | Citrus sp. | 2006 | Single reads (100 bp) | 1232 | 5305763 | 8636 | GATC | 5015092 | 94.52 |
| NCPPB 3610 | A | India | Poncirus trifoliata | 1988 | Single reads (100 bp) | 1247 | 5168073 | 7578 | GATC | 5027071 | 97.27 |
| JK143-9 | A* | Thailand | Citrus sp. | 1990 | Single reads (100 bp) | 1314 | 5227724 | 7886 | GATC | 4939914 | 94.49 |
| LE116-1 | A | Mali | C. aurantifolia | 2008 | Single reads (100 bp) | 1451 | 5355671 | 7770 | GATC | 5024296 | 93.81 |
| NCPPB 3615 | A* | India | C. aurantifolia | 1989 | Single reads (100 bp) | 1546 | 5370437 | 6587 | GATC | 4938386 | 91.96 |
| JS582 | A* | Iran | C. sinensis | 1997 | Single reads (100 bp) | 1622 | 5250292 | 6561 | GATC | 4892742 | 93.19 |
| LD7-1 | A | Mali | C. aurantifolia | 2008 | Single reads (100 bp) | 1692 | 5340074 | 6225 | GATC | 5019242 | 93.99 |
| LMG 9322 | A* | Florida | C. aurantifolia | 1986 | Paired End (300/500 bp) | 138 | 5195773 | 165596 | Genoscope | 5091334 | 97.99 |
| FDC 1083 | A | Brazil | C. reticulata | 1980 | Paired End (300/500 bp) | 140 | 5219643 | 170725 | Genoscope | 5137607 | 98.43 |
| FDC 217 | A | Brazil | C. sinensis | 2003 | Paired End (300/500 bp) | 146 | 5219970 | 148569 | Genoscope | 5138314 | 98.44 |
| JJ238-10 | A | Maldives Islands | C. aurantifolia | 1987 | Paired End (300/500 bp) | 158 | 5262497 | 164415 | Genoscope | 5125732 | 97.40 |
| JF90-8 | Aw | Oman | C. aurantifolia | 1986 | Paired End (300/500 bp) | 164 | 5283250 | 120466 | Genoscope | 5120165 | 96.91 |
| CFBP 2852 | A | India | Citrus sp. | NA | Paired End (300/500 bp) | 170 | 5274028 | 171317 | Genoscope | 5044668 | 95.65 |
| X2003-3218 | Aw | Florida | Citrus sp. | 2003 | Paired End (300/500 bp) | 171 | 5312286 | 110163 | Genoscope | 5052960 | 95.12 |
| LD71a | A* | Cambodia | Citrus sp. | 2007 | Paired End (300/500 bp) | 173 | 5282605 | 148601 | Genoscope | 4998550 | 94.62 |
| JJ238-24 | A* | Thailand | C. aurantifolia | 1989 | Paired End (300/500 bp) | 173 | 5284713 | 164186 | Genoscope | 5049892 | 95.56 |
| LC80 | A | Mali | C. reticulata x C. sinensis | 2006 | Paired End (300/500 bp) | 182 | 5232382 | 144093 | Genoscope | 5139614 | 98.23 |
| JW160-1 | A | Bangladesh | C. aurantifolia | 2000 | Paired End (300/500 bp) | 202 | 5256256 | 155164 | Genoscope | 5055053 | 96.17 |
| CFBP 2911 | A* | Pakistan | Citrus sp. | 1984 | Paired End (300/500 bp) | 202 | 5411197 | 163541 | Genoscope | 5111677 | 94.46 |
| JF90-2 | A* | Oman | C. aurantifolia | 1986 | Paired End (300/500 bp) | 225 | 5257575 | 152298 | Genoscope | 4996177 | 95.03 |
| NCPPB 3562 | A | India | C. limon | 1988 | Paired End (300/500 bp) | 230 | 5519974 | 148562 | Genoscope | 5112011 | 92.61 |
| LE20-1 | A* | Ethiopia | C. aurantifolia | 2008 | Paired End (300/500 bp) | 462 | 5309008 | 138224 | Genoscope | 5047671 | 95.08 |
| NCPPB 3608 | Aw | India | C. aurantifolia | 1988 | Paired End (300/500 bp) | 517 | 5389095 | 114454 | Genoscope | 5061159 | 93.91 |
| JS584 | A* | Iran | Citrus sp. | 1997 | Paired End (300/500 bp) | 575 | 5270551 | 144272 | Genoscope | 4961554 | 94.14 |
| C40 | A | Reunion Island | C. sinensis | 1988 | Single reads (100 bp) + Mate Pair (8 kb) | 177 | 5241070 | 98653 | Genoscope | 5117602 | 97.64 |
| JK2-10 | A* | Saudi Arabia | C. aurantifolia | 1988 | Single reads (100 bp) + Mate Pair (8 kb) | 318 | 5277475 | 67947 | Genoscope | 4959019 | 93.97 |
Fig. 1.
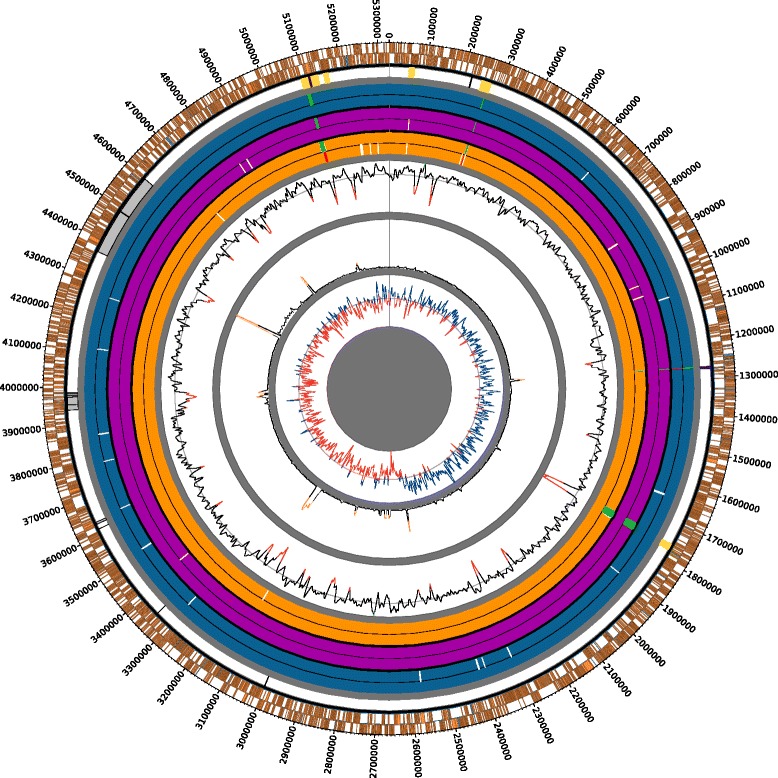
Circular map representing the genome alignment of 43 X. citri and 1 X. bilvae strain. The outermost tracks depict the protein-coding (orange) and RNA (blue) genes found on the forward (outer) and reverse (inner) strands of X. citri strain 306 that have been mapped onto the alignment. The next innermost track represents the regions of detected recombination in Aw (yellow), A* (dark blue) and non pathotype-specific events (grey). Further towards the centre, the gene islands and pseudogenes for A* (dark blue), A (dark purple), and Aw (dark brown) pathotypes are show respectively. Each pathotype track has an inner (pseudogene, truncation and protein length difference locations in white and missing genes in red) and outer (additional genes present in green) track. The three innermost tracks from outside to inside represent average GC content, sequence diversity and GC skew measured by a sliding window of 8 kb across the alignment. Green and red peaks on the GC content track represent two standard deviations either side of the mean (grey line). Orange tips on the sequence diversity track represent peaks that are more than two standard deviations above the mean. Blue and red peaks on the GC skew track are positive and negative values respectively
Contig mapping
The results of the assembled contig-mapping to the strain IAPAR 306 reference are shown in Table 1. Between 91.96 and 98.43 % of the sequenced data was mapped to strain IAPAR 306 depending on the strain, with an average of 95.13 %. The regions from each strain that were not mapped to strain IAPAR 306 were not included in the comparative analysis because the exact relationships between homologous regions from these unmapped regions are difficult to define. While it was possible to map some contigs from each strain onto the two plasmids from IAPAR 306, there were no regions from the resulting alignment that were represented in all of the strain genomes or that were pathotype-specific.
Recombination
Regions inferred to have undergone recombination across the X. citri pv. citri clade and the corresponding ranges of genes in strain IAPAR 306 are shown in Table 2 and Additional file 1. In total 21 regions were identified as likely being recombinant. Of these, seven events are inferred to have occurred on branches leading to the different pathotypes, five that are unique to the Aw pathotype and two that are unique to the A* pathotype. The five Aw-specific recombination regions cover 80 genes in strain IAPAR 306 (Table 2 and Additional file 2), many of which were conferred Aw-specific residues by the horizontal transfer. In general, the level of Aw-specific residues is much higher in genes in these regions than in the rest of the genome with an average of 1.03 nonsynonymous SNPs per gene compared to a genome average in Aw strains of 0.0085 per gene (based on the Aw strain X2003-3218 annotation). Of the five events in the Aw pathotype, four of them appear to originate from X. citri pv. bilvae or a closely related bacterium. Of particular interest, an A*-specific recombination event and an Aw-specific recombination event coincide within the xopAD gene, a type III effector. The effect of the different recombination events is that xopAD differs at many sites in a pathotype specific manner across all three pathotypes (Additional file 2).
Table 2.
Regions of detected recombination in the whole genome alignment of all strains
| Event | IAPAR 306 Coordinates | Alignment Coordinates | IAPAR 306 Start Gene | IAPAR 306 End Gene | Strain Presence | Putative Origin | Island |
|---|---|---|---|---|---|---|---|
| 1 | 51959-65492 | 52850-66390 | XAC0042 | XAC0053 | Aw | X. citri pv.bilvae | |
| 2 | 214827-217043 | 219088-221270 | XAC0174 | XAC0176 | JM35-2, JF90-2 | Unknown | |
| 3 | 243703-265596 | 248213-273302 | XAC0198 | XAC0217 | Aw | X. citri pv.bilvae | Island1 |
| 4 | 1253042-1259543 | 1272074-1278440 | XAC1101 | XAC1107 | A* | Unknown | Island2 |
| 5 | 1729051-1743732 | 1758692-1774868 | XAC1497 | XAC1509 | Aw | Unknown | Island3 |
| 6 | 2931468-2932633 | 3000594-3001946 | XAC2505 | XAC2506 | LE3-1, LE20-1 | Unknown | |
| 7 | 3256265-3256278 | 3344395-3344409 | Intergenic | Intergenic | JJ10-1, C40 | Unknown | |
| 8 | 3525240-3525417 | 3615434-3615613 | XAC3016 | XAC3016 | JS581, JS582, JS584, JK48, JK2-10 | Unknown | |
| 9 | 3538019-3542103 | 3629086-3634840 | XAC3028 | XAC3029 | JM35-2 | Unknown | |
| 10 | 3839344-3842570 | 3940513-3945476 | XAC3259 | XAC3262 | LB302, NCPPB 3218 | Unknown | |
| 11 | 3850723-3851839 | 3954394-3955620 | XAC3269 | XAC3269 | JJ238-24, LD71a | Unknown | |
| 12 | 3867931-3872268 | 3974477-3979351 | XAC3288 | XAC3293 | NCPPB 3607 | Unknown | |
| 13 | 3868626-3877708 | 3975273-3986173 | XAC3289 | XAC3298 | LG115 | Unknown | |
| 14 | 3872787-3872972 | 3980062-3980250 | XAC3294 | XAC3294 | NCPPB 3607, JK143-9, JK143-11, LD71a, JJ238-24 | Unknown | |
| 15 | 3876659-3877403 | 3985023-3985867 | XAC3298 | XAC3298 | LB302, X2003-3218 | Unknown | |
| 16 | 4257584-4467356 | 4370989-4598311 | XAC3590 | XAC3797 | JJ238-10, LB100-1, CFBP 2852, JW160, NCPPB 3610, C40, JJ10-1, LMG 9322, JK4-1, FDC 217, IAPAR 306, FDC 1083, LC80, LG117 | X. citri pv.bilvae | |
| 17 | 4257584-4414966 | 4370989-4541201 | XAC3590 | XAC3740 | LG98 | X. citri pv.bilvae | |
| 18 | 4364984-4366535 | 4490348-4491900 | XAC3687 | XAC3688 | LG98 | X. citri pv.bilvae | |
| 19 | 4952518-4988729 | 5094257-5137776 | XAC4204 | XAC4227 | Aw | X. citri pv.bilvae | Island4 |
| 20 | 4965286-4969165 | 5113255-5117325 | XAC4213 | XAC4213 | A* | Unknown | Island4 |
| 21 | 5004702-5016321 | 5154088-5165863 | XAC4239 | XAC4250 | Aw | X. citri pv.bilvae |
Phylogeny
The phylogeny inferred from the whole genome alignment is shown in Fig. 2. Each pathotype in the phylogeny resolves into monophyletic groups, with the A and Aw pathotypes sharing a short branch after the divergence of A*. Consistent with previous Amplified Fragment Length Polymorphism and Multi Locus Variable number of tandem repeat Analysis (MLVA-31), A* strains formed robust subclusters in relation to their geographic origin [8, 10, 15]. Our phylogeny confirmed that the Indian subcontinent hosts unique A strains, including the ones referred to as DAPC 2 based on MLVA-31 [15] (NCPPB 3562, NCPPB 3612) and strains isolated in Bangladesh (LG97, LG98 and LG102), which form distinct subclusters within the A clade. In addition to strains originating from this region, the DAPC 2 lineage also included strains emerging in Mali and Senegal (LD7-1, LE116-1 and LH37-1) [16]. The strains JF90-8, LG115 and NCPPB 3608, previously designated as part of the A* pathotype [10], share a well supported branch with the other Aw strains, and are assigned as Aw in our work for this reason in conjunction with containing the gene island containing avrGf1, previously identified specifically in an Aw strain [11]. A second phylogeny constructed with recombination as part of the alignment and a reduced distribution of A strains similar to that of Zhang et al. [17] revealed the same pathotype branching structure as in this publication with the A* and Aw strains that share a branch (Additional file 3). Support for the pathotype-specific branches is very strong in both the recombination-containing and recombination-free phylogenies despite their differing topologies.
Fig. 2.
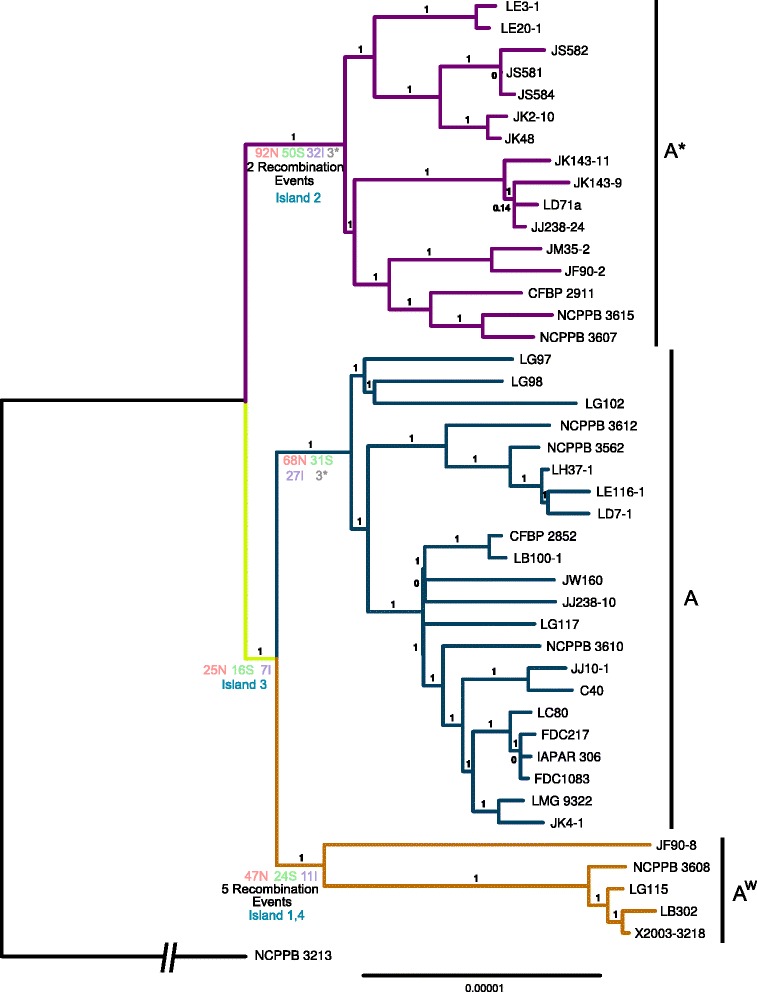
Phylogeny reconstructed from the whole genome alignment with removed regions of recombination. The pathotypes are colored blue (A), mauve (A*) and orange (Aw) and the shared branch ancestral to A and Aw is colored yelow. The number of inferred nonsynonymous (N), synonymous (S), intergenic (I) and nonsense (*) SNPs, gene gains and losses and gene islands are marked along each branch. The outgroup branch has been shortened (indicated by the broken line) and is not to scale, to facilitate legibility of the figure
Presence/absence analysis
We used orthologs identified by BLAST best reciprocal hits (BRH) (Additional file 4) in order to estimate the core-genome, pan-genome and number of singletons in our dataset, as well as to catalog gene presence and absence between pathotypes that are differentially present or absent in all strains of a pathotype. Genes related to IS elements and phages were excluded from the analysis due to their similarity, which makes orthology difficult to assign. We estimate that there are 2513 genes in the core-genome, 10,011 genes in the pan-genome and 2445 singletons spread across the 43 X. citri pv. citri strains. We identified four gene islands that are differentially present or absent between the pathotypes (Table 3, Fig. 1). Several genes previously identified as playing roles in pathogenicity or biofilm formation are found on these islands including the Aw-specific avrGf1 gene on Island 1 (previously identified as being differentially present between strain IAPAR 306 and Aw strain Xcaw12879 [12]), and xrvA, mobL, XAC1496, XAC1499 and XAC1509 on Island 3 that are absent from A*. Islands 2–4 all contain at least one gene that is usually plasmid-associated indicating their probable origin as plasmidic.
Table 3.
Gene islands differentially present or absent across pathotypes
| Island | A | Aw | A* | Note | IAPAR 306 gene | X2003-3218 (Aw) gene | LD71a (A*) gene | Gene name | Recombination |
|---|---|---|---|---|---|---|---|---|---|
| Island1 | + | - | + | Absent in Aw | XAC0211 | XAC71A_110067 | gloA | Event 3 | |
| - | + | - | Unique to Aw | XAC3218_110003 | avrGf1 | Event 3 | |||
| - | + | - | Unique to Aw | XAC3218_110004 | Event 3 | ||||
| Island2 | + | + | - | Absent in A* | XAC1101 | XAC3218_260032 | Event 4 | ||
| - | - | + | Unique to A* | XAC71A_230028 | Event 4 | ||||
| - | - | + | Unique to A* | XAC71A_230029 | ccdB | Event 4 | |||
| - | - | + | Unique to A* | XAC71A_230030 | Event 4 | ||||
| - | - | + | Unique to A* | XAC71A_240006 | Event 4 | ||||
| - | - | + | Unique to A* | XAC71A_240007 | Event 4 | ||||
| - | - | + | Unique to A* | XAC71A_240008 | Event 4 | ||||
| - | - | + | Unique to A* | XAC71A_240009 | Event 4 | ||||
| Island3 | + | + | - | Absent in A* | XAC1492 | XAC3218_380022 | |||
| +/− | + | - | Absent in A* | XAC3218_390001 | |||||
| + | + | - | Absent in A* | XAC1493 | XAC3218_390002 | ||||
| + | + | - | Absent in A* | XAC1494 | XAC3218_390003 | orf2 | |||
| +/− | + | - | Absent in A* | XAC3218_390004 | |||||
| +/− | + | - | Absent in A* | XAC3218_390005 | |||||
| + | + | - | Absent in A* | XAC1495 | XAC3218_390006 | xrvA | |||
| +/− | + | - | Absent in A* | XAC3218_390007 | |||||
| + | + | - | Absent in A* | XAC1496 | XAC3218_390008 | ||||
| + | + | - | Absent in A* | XAC1497 | XAC3218_390009 | Event 5 | |||
| +/− | + | - | Absent in A* | XAC3218_390010 | Event 5 | ||||
| +/− | + | - | Absent in A* | XAC3218_390011 | Event 5 | ||||
| + | + | - | Absent in A* | XAC1499 | XAC3218_390012 | Event 5 | |||
| + | + | - | Absent in A* | XAC1500 | XAC3218_390014 | Event 5 | |||
| +/− | + | - | Absent in A* | XAC3218_390015 | Event 5 | ||||
| +/− | + | - | Absent in A* | XAC3218_390016 | Event 5 | ||||
| +/− | + | - | Absent in A* | XAC3218_390017 | Event 5 | ||||
| +/− | + | - | Absent in A* | XAC3218_390018 | Event 5 | ||||
| + | + | - | Absent in A* | XAC1501 | XAC3218_400002 | Event 5 | |||
| + | + | - | Absent in A* | XAC1502 | XAC3218_400003 | Event 5 | |||
| + | + | - | Absent in A* | XAC1503 | XAC3218_400004 | Event 5 | |||
| + | + | - | Absent in A* | XAC1506 | XAC3218_400005 | Event 5 | |||
| +/− | + | - | Absent in A* | XAC3218_400006 | Event 5 | ||||
| +/− | + | - | Absent in A* | XAC3218_400007 | Event 5 | ||||
| + | + | - | Absent in A* | XAC1507 | XAC3218_400008 | mobL | Event 5 | ||
| + | +/− | - | Absent in A* | XAC1508 | XAC3218_400010 | Event 5 | |||
| + | +/− | - | Absent in A* | XAC1509 | XAC3218_400011 | Event 5 | |||
| Island4 | + | - | + | Absent in Aw | XAC4205 | XAC71A_950084 | Event 18 | ||
| + | - | +/− | Absent in Aw | XAC4206 | Event 18 | ||||
| + | - | + | Absent in Aw | XAC4209 | XAC71A_960001 | cvaB | Event 18 | ||
| - | ψ | - | Unique to Aw | XAC3218_960285 | Event 18 | ||||
| - | ψ | - | Unique to Aw | XAC3218_960286 | Event 18 | ||||
| - | + | - | Unique to Aw | XAC3218_970001 | Event 18 | ||||
| - | ψ | - | Unique to Aw | XAC3218_970002 | Event 18 | ||||
| - | ψ | - | Unique to Aw | XAC3218_970003 | Event 18 |
+ present in all strains of a pathotype; − absent in all strains of a pathotype; +/− present in some strains of a pathotype; ψ putative pseudogene
All of the islands except the Aw-specific Island 1 containing avrGf1 coincide with island locations identified in strain IAPAR 306 with IslandViewer [18]. Island 3 partially coincides with an Aw-specific recombination event of unknown origin, while Island 1 and Island 4 fully overlap Aw-specific recombination events originating from X. citri pv. bilvae. Island 2 fully overlaps an A*-specific recombination region of unknown origin. Apart from these islands and several likely pseudogene fragments (see below), we did not identify any genes that were exclusively present or absent in a given pathotype.
Ancestral character estimation
Using ancestral character estimation, a total of 426 SNPs were mapped onto the four branches leading to the three pathotypes, of which 350 are genic and 76 are intergenic based on the annotation of strain IAPAR 306 (Fig. 1 and Additional file 5). There are 220 nonsynonymous mutations and 124 synonymous mutations as well as nonsense mutations in three A and three A* genes.
Among the nonsynonymous SNPs, there are many in genes with previously identified putative roles related to pathogenicity or biofilm formation in various Xanthomonas species. Specific to the A pathotype, these include genes related to secretion systems or effectors: avrBs2, xopN, xopL, hrpE, hrcU, lamA [18–23]; genes related to EPS production and biofilm formation or regulated by DSF: rpfA, rpfB, gumL, gumD, cyoC, fecA [11, 24–35]; and iron transport: fhuA [11]. On the A* branch are nonsynonymous SNP-containing genes related to secretion systems or effectors: hrpB5, hrpXct, xopX, xopK, xopL, xcsG, xcsN, secE [18–22, 34]; biofilm formation: tsr and gumL [27–29, 32, 35, 36]; and iron transport: fhuA [11]. Aw-specific nonsynonymous-SNP containing genes include genes related to secretion systems or effectors: xopP, xopL, hpaB [20, 22, 23]; genes related to EPS production and biofilm formation: gumM, gumD, tsr [27–29, 35–37], organic hydroperoxide resistance gene osmC [36], a xylanase xynB [38] and XAC4203, a mutant of which is biofilm defective [35]. Finally, on the shared A/Aw branch, there are nonsynonymous mutations in rpfB, and the adhesion-associated protein yapH [39, 40].
Pseudogenes, frameshifts and truncations
Pseudogenes, frameshifts and truncations were identified by the complementary approaches of the protein length analysis, ancestral character estimation and the presence/absence analysis (Table 4). There are eight identified putative pseudogenes in pathotype A strains, 15 in A* strains and five in Aw strains. Several of the putative pseudogenes are reported to have roles in defence: the catalase catB [41, 42] and permease rarD [43] involved in drug resistance in the A strains and yojM [44], a superoxide dismutase-like gene in the Aw strains. There are also putative pseudogenes in the A* strains that are involved in pathogenicity or biofilm formation: rpfB [24, 25, 29–31], a regulator of pathogenicity factors, a GGDEF domain-containing protein-encoding gene [29, 36] and the type III effectors xopN and xopL [20, 22].
Table 4.
Pathotype-specific putative pseudogenes, genic frameshifts and truncations
| Pathotype | Gene | Description | Native coordinates | Alignment coordinates | Gene fragment 1 | Gene fragment 2 | Note |
|---|---|---|---|---|---|---|---|
| A | methyltransferase domain | 60851-61836 | 61748-62734 | XANAC_0061 | XAC0050 | Putative ψ | |
| LacZ | beta-galactosidase | 838208-841101 | 850951-853845 | XAC0707 | XAC0708 | Putative ψ | |
| putative secreted protein | 986002-986826 | 999771-1000595 | XAC0825 | XANAC_0965 | Putative ψ | ||
| oppD/yliA | ABC transporter | 1021079-1022728 | 1034920-1036570 | XAC0859 | XAC0860 | Putative ψ | |
| araJ | MFS transporter | 3326112-3327329 | 3414846-3416063 | XAC2837 | XAC2836 | Putative ψ | |
| rarD | Permease – chloramphenicol resistence | 4693056-4693966 | 4830382-4831292 | XAC4000 | XAC4001 | Putative ψ | |
| catB | catalase | 4719198-4720710 | 4856716-4858239 | XAC4029 | XAC4030 | Putative ψ | |
| A* | PbsX Transcription Factor | 614013-614472 | 630726-631530 | XAC71A_130207 | XAC71A_130208 | Putative ψ | |
| acyl-CoA synthetase | 1041072-1042552 | 1063009-1064489 | XAC71A_170122 | XAC71A_170123 | Putative ψ | ||
| 1622056-1625651 | 1640494-1644089 | XAC71A_280103 | XAC71A_280104 | Putative ψ | |||
| 1860274-1860803 | 1904352-1904881 | XAC71A_310052 | XAC71A_310053 | Putative ψ | |||
| rpfB | acyl-CoA synthetase | 2187629-2189311 | 2300143-2301825 | XAC71A_390075 | XAC71A_390076 | Putative ψ | |
| 2269033-2269866 | 2382037-2382870 | XAC71A_410007 | XAC71A_410008 | Putative ψ | |||
| GGDEF family protein | 2286218-2289170 | 2399383-2402335 | XAC71A_410020 | XAC71A_410021 | Putative ψ | ||
| comA | competence protein | 2447016-2449565 | 2572127-2574695 | XAC71A_450029 | XAC71A_450030 | Putative ψ | |
| XACSR11 | carboxypeptidase | 3101427-3102721 | 3299904-3301198 | XAC71A_660002 | XAC71A_660003 | Putative ψ | |
| xopN | type III effector | 3293500-3295557 | 3508783-3510840 | XAC71A_730134 | Putative ψ, truncated 3′ | ||
| yagT | putative oxidoreductase, 2Fe-2S subunit | 3420879-3421529 | 3641125-3641775 | XAC71A_740038 | XAC71A_740039 | Putative ψ | |
| yodB | Cytochrome B561 | 3563369-3564046 | 3785148-3785825 | XAC71A_750009 | frameshift, longer 3′ | ||
| xopL | type III effector | 3641485-3643372 | 3864216-3866109 | XAC71A_760048 | XAC71A_760049 | Putative ψ | |
| rimK | Ribosomal protein S6 modification protein | 3847131-3848050 | 4111446-4112365 | XAC71A_840004 | XAC71A_840005 | Putative ψ | |
| 3998076-3997795 | 4263201-4262920 | XAC71A_880069 | Putative ψ, truncated 5′ | ||||
| Aw | 59860-61116 | 60605-61861 | XAC3218_20024 | XAC3218_20025 | Putative ψ | ||
| adh | alcohol dehydrogenase | 247107-247385 | 256015-256293 | XAC3218_100056 | Putative ψ, truncated 3′ | ||
| yojM | superoxide dismutase-like | 256565-257695 | 265546-267635 | XAC3218_110001 | XAC3218_110002 | Putative ψ | |
| 3010085-3008397 | 3123577-3121889 | XAC3218_630012 | longer | ||||
| LysR Transcription Factor | 4453733-4452393 | 4671211-4669871 | XAC3218_910186 | longer | |||
| exported | 4957802-4960197 | 5228371-5230773 | XAC3218_960285 | XAC3218_960286 | Putative ψ | ||
| 4962702-4964291 | 5233406-5234995 | XAC3218_970002 | XAC3218_970003 | Putative ψ | |||
| ttcA | 2-thiocytidine biosynthesis protein TtcA | 4988408-4989507 | 5261994-5263093 | XAC3218_990014 | XAC3218_990015 | Putative ψ | |
| xylB | xylulose B | 5015663-5013780 | 5290774-5288891 | XAC3218_990034 | longer |
COG enrichment analysis
COG categories enriched in the nonsynonymous SNP, missing and recombination gene sets are shown in Additional file 6. The majority of COGs enriched in the gene sets appear to be involved in the transport and metabolism of various compounds. The gene set with the most enriched COGs are the missing genes from A*, which has 21 enriched COGs. Both A* and Awmissing gene sets are enriched for COGs involved in defense mechanisms, while all the missing genes that are COG-enriched in A-strains are involved in compound transport and metabolism. The most significantly enriched category in A* missing genes is transcription, involving three different transcriptional regulator genes, two of which reside in Island 3. Amongst the nonsynonymous SNP gene sets, the A/Aw branch has the most enriched COGs that are mostly involved in transport and metabolism (11 of 14 genes). Despite having the most branch-specific nonsynonymous SNPs, the only enriched category for A*-specific SNP genes is for genes that have not been assigned a COG. In pathotype A, the most significantly enriched COG in the SNP gene set is involved in defense mechanisms, and includes the transport protein gene acrD and the multidrug efflux protein genes mexB and smeB. Energy production and conversion processes are also over-represented by avrBs2 and glpQ, genes that both contain a glycerophosphoinositol phosphodiesterase (GDE) domain [18]. The shared A/Aw branch, has several enriched COGs. In the recombinant regions in Aw, COGs for intracellular trafficking, secretion, and vesicular transport and inorganic ion transport and metabolism are enriched due to the presence of the tatA/tatB translocation system and two modular superoxide dismutase genes respectively.
Discussion
The focus of our study is to trace the evolutionary events that led to the emergence of three pathotypes of X. citri pv. citri that may explain differences in host range and virulence between them. As each pathotype is defined by its host-range or HR on different hosts, we searched for the genomic differences that appear to be entirely present or entirely absent from a pathotype ranging from the level of single base changes to multi-gene islands (Table 3 and Fig. 1). These events were placed into their evolutionary context by a phylogenetic reconstruction of all strains from non-recombinant regions of the multiple genome alignment.
Detection and removal of recombinant sequences allows the construction of a phylogeny that theoretically represents the true relationship of the vertically inherited genome portions of the strains (Fig. 2). The phylogeny shows monophyletic groups for each pathotype and suggests that the Aw and A pathotypes share a branch to the exclusion of the A* pathotype. The topology agrees with the overall structure of previous AFLP [10] and MLVA [15] phylogenies of the X. citri pv. citri group. Some strains studied by Escalon et al. [10] assigned to A* (JF90-8, LG115 and NCPPB 3608) are probably in fact Aw strains based on the molecular phylogeny presented here and consistent with the hypersensitive response in grapefruit and sweet orange due to the presence of avrGf1 [10, 11]. A recent publication [17] reconstructed a tree with a different branching order of the three pathotypes to that found in our reconstruction. In the published phylogeny, the Aw and A* pathotypes clade together to the exclusion of A strains. By reconstructing the relationship between the pathotypes both with (Additional file 3) and without regions of recombination (Fig. 2), we show that the topology from this publication is influenced by regions of recombination which were not removed before the reconstruction of the phylogeny, making it most likely incorrect. Because regions of recombination violate the core assumption of common evolutionary history for all of the sites in an alignment, it is important to control for their presence when reconstructing phylogenies [45]. Additionally, as the tests of positive selection used in the publication rely on a correct tree topology, the major result of this publication – that positive selection is the main driving force behind the evolution of citrus canker-causing Xanthomonas species – is therefore uncertain.
The only widely distributed common host species for all of the X. citri pv. citri pathotypes and the outgroup X. citri pv. bilvae is Key lime (Citrus aurantifolia). Based on our phylogeny, any differences in pathogenicity and host range between the A and Aw pathotypes should be isolated to events occurring on either or both of the branches leading to the two groups. Apart from a hypersensitive response in grapefruit and sweet orange [10, 11], which can largely be explained by the presence of avrGf1 [11], the host range and specificity of Aw is narrow and similar to that of A* [10], suggesting that the larger host range of the A group has developed along the branch leading to the A pathotype alone and that the ancestor of the A and Aw pathotypes had a host range and virulence similar to the Aw and A* groups. Less parsimonious scenarios cannot be ruled out, e.g. that Aw (or indeed both Aw and A*) evolved a restricted host range from an ancestor that had a broad host range.
The four gene island regions that show differential presence and absense of genes across the pathotypes are all coincident with detected regions of pathotype-specific recombination, which suggests that these islands have been gained in certain pathotypes rather than lost in pathotypes where they are absent. In addition, the fact that all but the island containing the avrGf1 gene contain genes that are normally associated with plasmids (ccdB, mobL, cvaB) indicates a likely xenologous plasmid origin. Interestingly, gene islands were also regions that contained missing genes between pathotypes. Except for putative pseudogenes (Table 4) all of the genes whose presence or absence is different between pathotypes are associated with regions of recombination or islands that are mostly of probable plasmid origin.
Although it might be expected that genes contained on these islands could define host range, there are no genes that are present or absent exclusively in A strains. Genes differentially present between the A and Aw pathotypes are found on Island 1 and Island 4 (Table 3), including avrGf1. Although avrGf1 deletion does not confer A-like host range to Aw strains, indicating that the presence or absence of other factors is also necessary to explain differing host ranges [10, 11], expression of avrGf1 or its homolog avrGf2 in A strains does illicit a HR in grapefruit [12]. Furthermore, in the case of both of these islands, A and A* strains share the same presence and absence patterns, indicating that they are likely not host range determining. Despite containing genes involved in virulence and biofilm formation (xrvA, mobL, XAC1496, XAC1499 and XAC1509) [34, 35, 46, 47], Island 3 is also unlikely to be a key factor in host range because it is present in A and Aw strains. In any case, the presence and absence differences restricted to gene islands that tend to coincide with zones of detected recombination outline the large role of horizontal transfer, plasmid insertion and recombination in the genomic evolution of X. citri pv. citri pathotypes.
In contrast to a recent analysis of X. citri pv. citri strains [17] we did not identify any additional pathotype-specific genes in the A strains. To validate our results, we checked the genes that differ between that analysis and our results (Additional file 7). Overall the majority of differences are due to fragments of existing genes that appear to have been split or pseudogenized, genes that are in fact found in other pathotypes, or genes found restricted to a pathotype, but not in all member strains.
A gene region identified in A-strains [17] that is involved in LPS biosynthesis is a gene island that corresponds to a region of detected recombination (event 16) in our data. However, the distribution is restricted to 14 of the 22 A-strains meaning that while it may have a large effect on biofilm formation and O-antigen composition in these strains as demonstrated by SDS-polyacrilamide gel electrophoresis [17], it is not the key factor to different host ranges between the pathotypes as a whole.
As well as gene islands and regions of recombination, host range differences may also be caused by pseudogenization. However, caution is needed when inferring pseudogenes from frameshifts or stop codons, as ribosomal frameshifting and transcriptional realignment can lead to fully-functional transcripts and proteins despite apparent non-functional coding sequences [48].
In the A pathotype, the only putative pseudogene known to be involved in virulence, is catB, a putative monofunctional catalase that may be involved in the detoxification of reactive oxygen species produced by plants during their defense processes [41, 42]. An EZ::TN transposon insertion in catB in X. campestris pv. campestris reduces virulence of the bacterium on its host plant [41]. Supporting its pseudogenic nature in strain IAPAR 306, Tondo et al. [42] could not detect catB product in X. citri pv. citri using RT-PCR.
Although several potential pseudogenes associated with infection are found in A* strains, e.g. rpfB, xopL, xopN and a GGDEF family protein (Table 4), these are unlikely to be the root cause of host range differences between the pathotypes given the phylogeny and their distribution across the different pathotypes, however they may still cause differences in virulence between the pathotypes.
The pathotypes also differ by mutations and recombination events that have overwritten homologous native sequence. A large number of the molecular differences between A and Aw strains comes from the five Aw-specific recombination events (Fig. 1, Table 2, Additional file 2) spanning 80 genes in strain IAPAR 306 (Additional file 1). Many of the genes contain one or more Aw-specific nonsynonymous substitution and in several cases also contain frameshifts, truncations and indels that are specific to Aw strains. Interestingly, four out of the five detected pathotype-specific recombination events in Aw appear to originate from X. citri pv. bilvae, as well as three other detected events, indicating a physical interaction must have occurred at some time in the past, most likely in India and probably on the common lime host. X. citri pv. bilvae has thus played a large role in the genomic evolution of the X. citri complex, specifically in the Aw pathotype.
Notably, one of the regions of Aw recombination contains xopAD, a type III effector that has previously been noted by Escalon et al. [10], as being the likely subject of recombination. Interestingly, the region containing xopAD appears to have undergone pathotype-specific recombination in both Aw and A* pathotypes, meaning that there are pathotype-specific versions in all three pathotypes. The A* and Aw versions contain multiple pathotype-specific amino acid residues (69 and 59 respectively). Furthermore, in the Aw strains (excluding JF90-8) a transposase from an ISXac5 element interrupts the xopAD gene at the 3′ end [10]. Jalan et al. [11] found that xopAD is upregulated in Xcaw12879 compared to strain IAPAR 306, suggesting that the IS interruption may not have completely pseudogenized this gene in Aw, although the truncation could potentially affect its function where it is present. Deletion of xopAD in A strains does not appear to affect its pathogenicity on different citrus hosts in strain IAPAR 306 [10], but as it is a Type III Effector and has unique versions of the gene in each pathotype it remains a good candidate for future study of pathotype-specific host range.
Figure 3 summarizes our results focusing on genes coding for factors that differ between pathotypes in terms of SNPs, pseudogeneization or presence/absence and are potentially involved in host specialization, i.e. related to functions that allow virulence on a plant species but not on another or that differentiate strains that are or are not pathogenic on a given species. For example a bacterial strain would not be pathogenic if: it cannot survive on the plant surface (involving extracellular polysaccharides, quorum sensing etc.); it cannot detect and/or swim to openings (sensors, flagellar system etc.); it cannot inhibit and/or evade plant defenses (Type III effectors (T3E), pathogen/microbe associated molecular patterns, detoxification, iron mobilization, molecular targets of defense mechanisms etc.); it cannot cause symptoms to disrupt plant tissues to liberate nutriments and/or exit (T3E, enzymes, toxins etc.); it cannot uptake and/or use nutriments (CUT system, transport, enzymes etc.). More generally deficient sensing, signal transduction or regulation may be involved in the inability to cause disease.
Fig. 3.
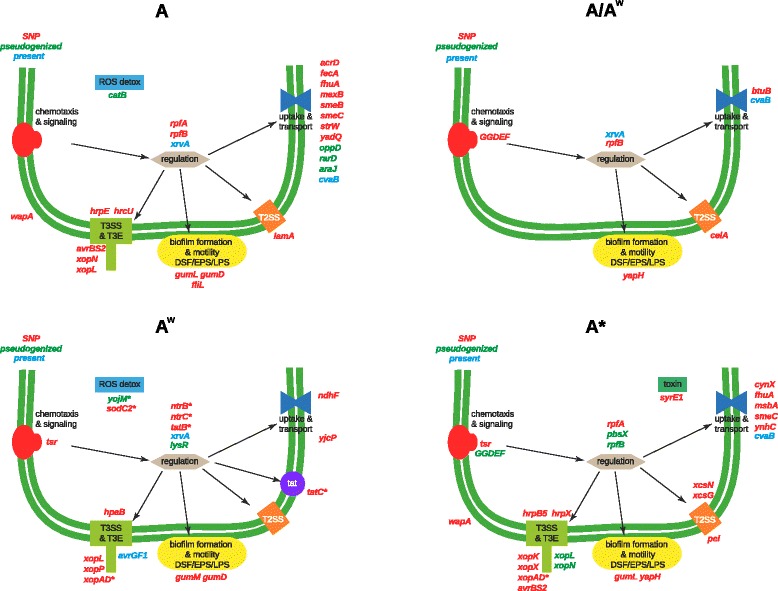
Schematic representation of a selection of genes involved in pathogenicity or fitness functions that are involved in pathotype specific events. Events are SNPs (in red), pseudogenization (in green), or presence in genomic islands (in blue). Events marked with an asterisk are present in regions of detected recombination
In our dataset, the low level of polymorphism along any given branch of the tree (the majority of inferred mutated genes contain only a single polymorphism specific to the pathotype branch) does not provide enough power to estimate selective constraints accurately in a pathotype-specific manner [49]. Several genes contain more than one nonsynonymous mutation per pathotype or across pathotypes, making them interesting candidates as potential targets of selection.
Genes that are already known to play a role in pathogenicity are also prime candidates for the evolution of host range, especially genes that have differences in an A-specific manner. These include nonsynonymous SNP-containing genes involved in secretion systems, hrpE, hrcU, avrBS2, xopN, xopL and lamA; genes involved in regulation of pathogenicity factors, rpfA and rpfB; genes involved in biofilm formation and motility related to diffusable signal factor (DSF), EPS and LPS, gumL, gumD and fliL as well as an array of genes involved in uptake and transport of various compounds including the iron transporters fecA and fhuA. The rpf (regulation of pathogenicity factors) genes are involved in cell-cell signalling via diffusable signal factor and in the regulation of the synthesis, polymerization and secretion of extracellular enzymes and polysaccharides (xanthan) [24–29]. Notably, rpfB has two A-specific nonsynonymous substitutions as well as an A/Aw nonsynonymous substitution and is a putative pseudogene in the A* strains. Mutation of rpfB leads to loss or severe reduction of DSF activity (< 10 % of wild type) in X. campestris pv. campestris [30, 31]. Furthermore, there are at least six A-specific nonsynonymous SNP-containing genes (cyoC, gumL, gumD, mexB, fecA and xopL) that are reportedly regulated by DSF in X. campestris pv. campestris and X. oryzae pv. oryzae [28, 32, 36]. As they are important in cell-cell signalling as well as the regulation of pathogenicity factors and biofilm formation (i.e. they exist at the crossroads of sensing and gene expression), the rpf genes and their regulation targets that contain SNPs are good candidate genes to explain the differentiation of the pathotypes in terms of their virulence and host range.
The significant enrichment of mutated, missing (including putative pseudogenes) or recombined genes in functional categories may also indicate possible selection acting on various bacterial systems. Interestingly in A strains, the enriched missing gene functions are all involved in the transport and metabolism of various compounds (Additional file 6). While Aw and A* missing genes are also enriched for transport and metabolism functions, both pathotypes are also depleted for genes involved in defense mechanisms (XAC1388 and cvaB respectively), and A* is depleted for genes involved in transcription (XAC1493, XAC0524, XAC1499), posttranslational modification, protein turnover, chaperones (XAC1101), energy production and conversion (yagT), replication, recombination and repair (mobL) and cell wall/membrane/envelope biogenesis (rimK). Furthermore the A strains are enriched for genes containing SNPs that are involved in defense mechanisms (acrD, mexB and smeB), energy production and conversion (glpQ and avrBs2) and intracellular trafficking, secretion, and vesicular transport (acrD and smeB), while neither Aw nor A* are enriched for any functions for genes containing SNPs. Multidrug efflux systems may be important in the pathogenicity of the bacteria, potentially by protecting the bacteria against plant antimicrobials released as a defense response [50, 51]. Indeed, knockout of the mexB gene along with associated mexA and oprM genes in Pseudomonas syringae causes a major reduction in the bacterial populations in planta [50]. Furthermore, it has been suggested that multidrug efflux pumps may play a role in exporting quorum sensing molecules out of the cell as well as flagellar motility which is associated with biofilm formation [51].
Conclusion
In this work we present a comparative genomics analysis using one previously sequenced strain and the draft genome sequences of 42 strains of X. citri pv. citri, and one X. citri pv. bilvae strain as an outgroup. Each of the three pathotypes of X. citri pv. citri are monophyletic, and we found multiple differences between the genomes of three pathotypes of X. citri pv. citri ranging from differences in gene content, putative pseudogenization, and nonsynonymous mutations in several genes known to be involved in various aspects of pathogenicity. We find that there is extremely little variation in gene-content at the pathotype level: apart from potential pseudogenes all of the detected differences in gene content are linked to gene islands and regions of recombination, indicating that HGT and recombination have been major factors in the gene content evolution of X. citri pv. citri pathotypes in terms of both the gain and the loss of gene content and mutations. Few content differences exist between A and Aw strains despite Aw strains having a narrow host range similar to that of A*.
Our analysis of recombination detected multiple recombination events across the genomes, with seven detected events that are specifically present only in all members of a pathotype. Five of the pathotype-specific events are in Aw strains, and two are in A*. Four of the Aw-specific recombination events are inferred to originate from a bacterium related to X. citri pv. bilvae due to high sequence similarity, suggesting an interaction between the Aw strain ancestor and this X. citri pv. bilvae-like strain, probably in a lime host. Interestingly, our analyses demonstrated that due to two recombination events, the xopAD gene displays pathotype-specific versions in all three pathotypes, making it a good candidate for further study of the host range or pathogenicity differences between the pathotypes. There are also several other notable differences of potential importance between the pathotypes that may explain differences in host range and pathogenicity, notably rpfA and rpfB genes that are involved in regulating pathogenicity factors and biofilm formation through DSF production. These genes and several of their targets contain multiple SNPs along different pathotype branches. We also identify several COGs that are either significantly enriched or depleted for the individual pathotypes and may suggest selection acting on certain functions in the pathotypes.
Overall, our study provides insights into the genomic evolution of the pathotypes of X. citri pv. citri and provides candidates for further study into their different host ranges and virulence.
Methods
Sequencing and assembly
Xanthomonas strains (Table 1) were stored at −80 °C as freeze-dried cultures and cultivated on YPGA (yeast extract 7 g/L, glucose 7 g/L, peptone 7 g/L, agar 18 g/L, pH 7.2), as described previously [14]. Genomic DNA was isolated using Promega Wizard Genomic DNA Purification kit (Promega, Charbonnières, France) according to the manufacturer instruction. DNA quantity and quality were assessed by nanodrop and gel electrophoresis. Illumina sequencing was performed by GATC (23 strains with single read length of 100 bp) and Genoscope (17 strains paired end reads of 300/500 bp and three strains with combined single reads of length 100 and 8 kb mate-pair reads). Assembly was performed by Genoscope and in-house for the GATC strains using the Velvet assembler [52].
Gaps in xop gene sequences were closed using PCR. All PCR runs were performed with a GeneAmp PCR system 9700 thermocycler (Applied Biosystems, Saint Aubin, France). PCR was performed in 20-μL reaction mixtures containing 1 × Gotaq® green buffer (Promega), 1.5 mM MgCl2, 200 mM of each deoxynucleoside triphosphate (dNTP), 0.3 mM of each primer, 2 ng of template genomic DNA and 0.8 U of GoTaq® Polymerase. The amplification program consisted of 35 cycles of denaturation at 95 °C for 45 s, annealing at 55 °C for 45 s and extension at 72 °C for 0.5–2 min, depending on the length of the PCR product (1 kb/min) (primers used for contigs assembly will be provided upon request). All PCR products to be sequenced (Sanger technology) were sent to Beckman Coulter Genomics (Stansted, Essex, UK). Sequence assembly and alignments were performed using Geneious software v5.5.6 [53].
Contig mapping
The assembled contigs for the 43 strains were mapped onto the complete reference genome of X. citri pv. citri strain IAPAR 306 [54] using BLAST [55] with manual curation. Contigs of less than 200 bp were removed. The contigs were initially filtered for plasmid sequences with BLAST [55] against a database of whole plasmid sequences from X. citri pv. citri strain IAPAR 306, X. euvesicatoria strain 85–10 [19], Xanthomonas fuscans subsp. fuscans [56] and the plasmids from a further two X. citri pv. citri strains, C40 and JK2-10. To map to the reference contigs were required to be at least 90 % identical to the reference over at least 20 % of their length and be the top hit to a given region. In cases of duplicate contigs, the top scoring hit was mapped to the reference. The mapped genomes for all the strains were aligned using Mugsy [57], and the resulting aligned blocks were ordered according to strain IAPAR 306. The same mapping process was attempted using the two plasmids of strain IAPAR 306 as references for the remaining unmapped contigs after the initial genome mapping stage. The genome alignment data were deposited in the Dryad online repository (http://dx.doi.org/10.5061/dryad.8t53k).
Quality checking
Raw reads were mapped to the assembly of each strain using Bowtie2 [58] before compiling information on each position using the Samtools suite [59]. VCFtools [60] was used to convert the output from Samtools into readable plaintext. Positions with a quality score of < 40 were cross-referenced to the multiple genome alignment, corrected where possible, or changed to an “N”.
GC content, GC skew and diversity
A Python script was used to calculate GC content, GC skew and sequence diversity. Sliding windows of 8 kb were passed along the alignment, and the average values were plotted using Circos [61]. Sequence diversity was measured using Hamming distance [62].
Recombination analysis
RDP v4.16 [63] was used to detect regions that have undergone recombination. The alignment was reduced to a length of 56,705 by extracting SNP columns from the whole genome alignment blocks. IAPAR 306 was used to order the SNPs so only SNPs (including gaps) from alignment blocks that were present in strain IAPAR 306 were included in the SNP alignment. The SNPs from regions not present in strain IAPAR 306 were examined but no pathotype-differentiating SNPs between A* and Aw were found. Regions identified as likely recombination events (Table 2, Additional file 1) were subsequently removed from the alignment to mitigate the confounding effects of recombination on other analyses. Regions of detected recombination were checked for spurious signals due to poor alignment, mapping, contig joins or low quality sequence.
Phylogeny
A phylogenetic tree was reconstructed from the full genome alignment (Fig. 2). Detected regions of recombination as well as gap columns and 20 bp either side were removed as these regions are often at the edges of contigs and are more likely to contain sequencing errors or regions of poor alignment. Model selection was performed with jModeltest 2.1.7 [64], and the SYM model chosen using the Bayesian Information Criterion. The phylogeny was reconstructed using PhyML [65] with chi-square branch support. A phylogeny from an alignment containing regions of recombination and a reduced distribution of A strains was also constructed to compare with a recently published phylogeny of X. citri pv. citri strains [17] (Additional file 3). The A strains used were those containing recombination Event 16, which was reported to be present in all A strains in the published dataset. To match the phylogeny in the recent publication, recombination-containing phylogeny was constructed using PhyML under the GTR model, with chi-square branch support values. The trees were visualized with Figtree v1.4.1 [66]. Both phylogenies and alignments were deposited in the Dryad online repository (http://dx.doi.org/10.5061/dryad.8t53k).
Ancestral character estimation
From an alignment of 46,072 SNP positions, strain-specific SNPs were removed to decrease the time for ancestral character estimation concentrating specifically on certain internal branches of the phylogeny. The resulting SNP alignment was 2954 bases long. To check that removal of these sites doesn’t alter the branching orders, a phylogeny was constructed with MrBayes v3.2.1 [67, 68]. Two Markov chains were run for 10,000,000 generations using “reversible jump MCMC” to sample across different substitution schemes, with sampling every 500 generations. The sample parameters and trees were summarized and the first 10 % were removed as burn-in. Tracer [69] was used to check for convergence. The resulting SNP tree (Additional file 8) returned the same pathotype branching topology as the full phylogeny based on the genome alignment.
Using the constructed SNP phylogeny, each node in the alignment was constrained and two runs with four Markov chains were performed simultaneously for 5,000,000 generations and sampled every 500 generations. The sample parameters and trees were summarized with removal of the first 10 % as burn-in and tracer was used to check for convergence for each analysis. Mutations were placed onto specific branches of the phylogeny if different nucleotides were inferred to be at the same alignment position at adjoining nodes, and the average difference in probability for the given residues at the two nodes was greater than 0.5.
Presence/absence analysis
Gene annotations were performed using an automated pipeline implemented by MaGe [70, 71]. Predicted proteins were compiled into a database and an all-against-all BLASTP was performed. Proteins associated with IS elements, and phage-related proteins were flagged and removed. Best reciprocal hits (BRH) to Xanthomonas citri strain IAPAR 306 were assigned from each of the other strains. Proteins from other genomes that were unassigned in the first round BRHs were then used as queries against the remaining genomes until all genomes had been examined. For each group of BRH assignments (Additional file 4), the distribution of the proteins in A, A* and Aw were examined to find those that were completely present in at least one of the pathotypes while being completely absent in at least one of the others. Split genes were identified by comparing each protein against the entire protein set from all strains, and finding instances where it hit adjacent genes in one of the other strains that had no homology among themselves. If a gene missing from a strain coincided with a contig break, it was considered as an unknown requiring manual examination in any cases that conformed to a potential pathotype-specific pattern. We identified groups of adjacent genes differentially present or absent from whole pathotypes as pathotype-specific gene islands. The core-genome, pan-genome and number of singletons were estimated from the BRH table. Notably, these estimates do not include IS elements, because the orthologous relationship for these very similar genes is difficult to define. It should also be noted that given the unfinished nature of the genome sequences, it is not possible to definitively infer the absence of a gene, which may affect both the presence/absence analysis and the core-genome and pan-genome estimates. However given the high coverage of NGS data, it is expected that most if not all non-repetitive regions should be present in the assembled contigs.
Length analysis
To find genes that differed between pathotypes due to indels, splitting of genes or pseudogenization, an analysis of the lengths of annotated proteins from the BRH table (Additional file 4) was performed. The average length, standard deviation and coefficient of variation was measured for a given identified ortholog in each pathotype. Protein alignments were created and manually examined for candidates where the average length varied between pathotypes with a within-pathotype coefficient of variation of less than 0.05 (Additional file 9).
COG enrichment analysis
From the classification in 1837 COGs annotated by MaGe for IAPAR 306, an analysis of COG enrichment was performed on the pathotype-specific presence/absence data, recombinant regions and genic nonsynonymous SNPs. COGs annotated in X. citri strain IAPAR 306 were used for A-specific and A/Aw shared branch nonsynonymous SNPs and also for genes that were missing from the A* and Aw pathotypes (Additional file 6). The missing gene sets include putative split or pseudogenes and truncated genes. For A*-specific SNPs and recombination, COGs and genes from strain LD71a were used, and for Aw-specific SNPs and recombination and A-specific missing genes, COGs and genes from strain X2003-3218 were used. For the genic SNP sets, each gene was considered once even if it contains multiple nonsynonymous mutations. For each COG category in the gene-sets, a contingency table was calculated for its presence in the gene-set compared to the rest of the genome and the presence of the other COGs in the gene-set compared to rest of the genome. R 3.0.2 [72] was used to perform a Fisher’s exact test on each contingency table and to adjust p-values using the Benjamini-Hochberg method [73] of controlling the false discovery rate for multiple testing.
Availability of supporting data
The multiple genome alignment and phylogenetic data are available from the Dryad Digital Repository: http://dx.doi.org/10.5061/. The sequencing data supporting the results of this article are available in the European Nucleotide Archive: [EMBL:ERS540821, EMBL:ERS540822, EMBL:ERS540823, EMBL:ERS540826, EMBL:ERS540825, EMBL:ERS540877, EMBL:ERS540807, EMBL:ERS540874, EMBL:ERS540827, EMBL:ERS540861, EMBL:ERS540860, EMBL:ERS540806, EMBL:ERS540824, EMBL:ERS540820, EMBL:ERS540875, EMBL:ERS540876, EMBL:ERS540837, EMBL:ERS540993, EMBL:ERS541232, EMBL:ERS605528, EMBL:ERP006877, EMBL:ERP006880, EMBL:ERP006881, EMBL:ERP006882, EMBL:ERP006883, EMBL:ERP006884, EMBL:ERP006885, EMBL:ERP006886, EMBL:ERP006887, EMBL:ERP006888, EMBL:ERP006889, EMBL:ERP006890, EMBL:ERP006891, EMBL:ERP006892, EMBL:ERP006893, EMBL:ERP006894, EMBL:ERP006895, EMBL:ERP006896, EMBL:ERP006897, EMBL:ERP006898, EMBL:ERP006899, EMBL:ERP006900, EMBL:ERP006901].
Acknowledgements
The authors would like to thank the teams at the Microbial Genome Annotation & Analysis Platform for their assistance. The research leading to these results has received funding from the European Union’s Seventh Framework Programme ([FP7/2007-2013]) under grant agreement n°263958 (RUN-Emerge project). Sequencing was financed through the Genoscope AP 09/10 project #18. This Work was supported by France Génomique National infrastructure, funded as part of “Investissement d’avenir” program managed by Agence Nationale pour la Recherche (contrat ANR-10-INBS-09). The European Union (ERDF), Conseil Régional de La Réunion and CIRAD provided financial support.
Abbreviations
- BRH
best reciprocal hit
- DSF
diffusable signal factor
- GDE
glycerophosphoinositol phosphoDiEsterase
- HR
hypersensitive response
- MLVA
multi locus variable number of tandem repeat analysis
- SNP
single nucleotide polymorphism
- T3E
type III effector
Additional files
Detected regions of recombination in all strains. Information regarding the 21 detected regions of recombination across all examinied X. citri pv. citri strains, including information about the strains in which the event is detected, the genes contained within the recombination zone and functional information about the genes where available. (XLSX 23 kb)
Pathotype-specific regions of recombination and number of introduced variant residues in genes. Information about the pathotype-specific recombination regions, including which genes are involved in each event, and the number of pathotype-specific variant residues found in each gene. “-” denotes cases where the number of pathotype-specific residues could not be calculated. (XLSX 10 kb)
Phylogeny from whole genome alignment of X. citri pv . citri strains containing regions of recombination. A reconstructed phylogeny containing regions of recombination and with a distribution of A strains that contain recombination event 16. The phylogeny was reconstructed under the GTR model of nucleotide substitution. The pathotypes are colored as follows: A strains are dark blue, Aw strains are orange, A* strains are purple. (PDF 26 kb)
Table of best reciprocal blast hit relationships for genes across all examined strains. Each strain in the dataset is represented as a column, and each row represents best reciprocal hits. The rows are ordered initially by the gene order from IAPAR 306, and then arbitrarily by different strains cycling through the A, Aw and A* pathotypes. The strains are highlighted based on their pathotype: A strains (blue), Aw strains (orange) and A* strains (purple). Additional information for certain genes are contained in parenthesis after the systematic gene name. (XLSX 2199 kb)
Genic and intergenic pathotype-specific SNPs. Information about all identified pathotype-specific SNPs in the dataset, including the SNP location, the codon and amino acid change, and functional gene information where available. (XLSX 34 kb)
Pathotype-specific significantly enriched or depleted ( P <0.05) COG categories for missing genes, SNP-containing genes or genes within zones of recombination. (XLSX 12 kb)
Examination of putative pathotype-specific genes from Zhang et al. [ 17 ]. Each strain in the dataset is represented as a column, and each row represents best reciprocal hits to genes identified as either unique to A strains or unique to Aw and A* strains by Zhang et al. [17] with a description of their status from our dataset, their distribution across all strains in our dataset, and whether they coincide with detected regions of recombination. The strains are highlighted based on their pathotype: A strains (blue), Aw strains (orange) and A* strains (purple). (XLSX 63 kb)
Phylogeny reconstructed from non-tip SNPs in non-recombinant genomic regions for downstream ancestral character estimation. The pathotypes are colored as follows: A strains are dark blue, Aw strains are orange, A* strains are purple and the shared A/Aw branch is yellow. (PDF 73 kb)
Analysis of pathotype-specific protein lengths. The mean lengths, standard deviation and coefficient of variation of the orthologous proteins present in each pathotype are shown for cases where there is a difference in the mean length between the pathotypes and a small (< 0.05) coefficient of variation within a pathotype. (XLSX 11 kb)
Footnotes
Competing interests
The authors declare that they have no competing interests.
Authors’ contributions
JG participated in the study design, analysed the data and drafted the manuscript. AE provided DNA sequences. VB participated in genome sequencing. SC participated in genome sequencing. PL performed sequence assembly, participated in the design of the study, participated in the ancestral character estimation analysis, GC content and genome diversity sliding window calculation and manuscript editing. LG conceived of the study, and participated in its design and coordination and helped to draft the manuscript. OP conceived of the study, and participated in its design and coordination and helped to edit the manuscript. All authors read and approved the final manuscript.
Contributor Information
Jonathan L. Gordon, Email: jonathan.gordon@cirad.fr
Pierre Lefeuvre, Email: pierre.lefeuvre@cirad.fr.
Aline Escalon, Email: escalon.aline@gmail.com.
Valérie Barbe, Email: vbarbe@genoscope.cns.fr.
Stéphane Cruveiller, Email: scruveil@genoscope.cns.fr.
Lionel Gagnevin, Email: gagnevin@cirad.fr.
Olivier Pruvost, Email: olivier.pruvost@cirad.fr.
References
- 1.Swings JG, Civerolo EL. Xanthomonas. London: Chapman & Hall; 1993. [Google Scholar]
- 2.Leyns F, Cleene MD, Swings J-G, Ley JD. The host range of the genus Xanthomonas. Bot Rev. 1984;50:308–356. doi: 10.1007/BF02862635. [DOI] [Google Scholar]
- 3.Gottwald TR, Graham JH, Schubert TS. Citrus canker: the pathogen and its impact. Plant Health Prog. 2002;1-35
- 4.Brunings AM, Gabriel DW. Xanthomonas citri: breaking the surface. Mol Plant Pathol. 2003;4:141–157. doi: 10.1046/j.1364-3703.2003.00163.x. [DOI] [PubMed] [Google Scholar]
- 5.Civerolo EL. Bacterial canker disease of citrus. J Rio Gd Vall Hortic Soc. 1984;37:127–145. [Google Scholar]
- 6.Sun X, Stall RE, Jones JB, Cubero J, Gottwald TR, Graham JH, et al. Detection and characterization of a new strain of citrus canker bacteria from key/Mexican lime and alemow in south Florida. Plant Dis. 2004;88:1179–1188. doi: 10.1094/PDIS.2004.88.11.1179. [DOI] [PubMed] [Google Scholar]
- 7.Vernière C, Hartung JS, Pruvost OP, Civerolo EL, Alvarez AM, Maestri P, et al. Characterization of phenotypically distinct strains of Xanthomonas axonopodis pv. citri from southwest Asia. Eur J Plant Pathol. 1998;104:477–487. doi: 10.1023/A:1008676508688. [DOI] [Google Scholar]
- 8.Bui Thi Ngoc L, Vernière C, Jarne P, Brisse S, Guérin F, Boutry S, et al. From local surveys to global surveillance: three high-throughput genotyping methods for epidemiological monitoring of Xanthomonas citri pv. citri pathotypes. Appl Environ Microbiol. 2009;75:1173–1184. doi: 10.1128/AEM.02245-08. [DOI] [PMC free article] [PubMed] [Google Scholar]
- 9.Rybak M, Minsavage GV, Stall RE, Jones JB. Identification of Xanthomonas citri ssp. citri host specificity genes in a heterologous expression host. Mol Plant Pathol. 2009;10:249–262. doi: 10.1111/j.1364-3703.2008.00528.x. [DOI] [PMC free article] [PubMed] [Google Scholar]
- 10.Escalon A, Javegny S, Vernière C, Noël LD, Vital K, Poussier S, et al. Variations in type III effector repertoires, pathological phenotypes and host range of Xanthomonas citri pv. citri pathotypes. Mol Plant Pathol. 2013;14:483–496. doi: 10.1111/mpp.12019. [DOI] [PMC free article] [PubMed] [Google Scholar]
- 11.Jalan N, Kumar D, Andrade MO, Yu F, Jones JB, Graham JH, et al. Comparative genomic and transcriptome analyses of pathotypes of Xanthomonas citri subsp. citri provide insights into mechanisms of bacterial virulence and host range. BMC Genomics. 2013;14:551. doi: 10.1186/1471-2164-14-551. [DOI] [PMC free article] [PubMed] [Google Scholar]
- 12.Gochez AM, Minsavage GV, Potnis N, Canteros BI, Stall RE, Jones JB. A functional XopAG homologue in Xanthomonas fuscans pv. aurantifolii strain C limits host range. Plant Pathol. 2015;64:1207-14.
- 13.Stukenbrock EH, McDonald BA. The origins of plant pathogens in agro-ecosystems. Annu Rev Phytopathol. 2008;46:75–100. doi: 10.1146/annurev.phyto.010708.154114. [DOI] [PubMed] [Google Scholar]
- 14.Bui Thi Ngoc L, Vernière C, Jouen E, Ah-You N, Lefeuvre P, Chiroleu F, et al. Amplified fragment length polymorphism and multilocus sequence analysis-based genotypic relatedness among pathogenic variants of Xanthomonas citri pv. citri and Xanthomonas campestris pv. bilvae. Int J Syst Evol Microbiol. 2010;60:515–525. doi: 10.1099/ijs.0.009514-0. [DOI] [PubMed] [Google Scholar]
- 15.Pruvost O, Magne M, Boyer K, Leduc A, Tourterel C, Drevet C, et al. A MLVA Genotyping scheme for global surveillance of the citrus pathogen Xanthomonas citri pv. citri suggests a worldwide geographical expansion of a single genetic lineage. PLoS ONE. 2014;9:e98129. doi: 10.1371/journal.pone.0098129. [DOI] [PMC free article] [PubMed] [Google Scholar]
- 16.Leduc A, Traoré YN, Boyer K, Magne M, Grygiel P, Juhasz CC, et al. Bridgehead invasion of a monomorphic plant pathogenic bacterium: Xanthomonas citri pv. citri, an emerging citrus pathogen in Mali and Burkina Faso. Environ Microbiol. 2015;17(11):4429–42. doi: 10.1111/1462-2920.12876. [DOI] [PubMed] [Google Scholar]
- 17.Zhang Y, Jalan N, Zhou X, Goss E, Jones JB, Setubal JC, et al. Positive selection is the main driving force for evolution of citrus canker-causing Xanthomonas. ISME J. 2015;9(10):2128–38. doi: 10.1038/ismej.2015.15. [DOI] [PMC free article] [PubMed] [Google Scholar]
- 18.Zhao B, Dahlbeck D, Krasileva KV, Fong RW, Staskawicz BJ. Computational and biochemical analysis of the Xanthomonas effector AvrBs2 and its role in the modulation of Xanthomonas type three effector delivery. PLoS Pathog. 2011;7:e1002408. doi: 10.1371/journal.ppat.1002408. [DOI] [PMC free article] [PubMed] [Google Scholar]
- 19.Thieme F, Koebnik R, Bekel T, Berger C, Boch J, Buttner D, et al. Insights into genome plasticity and pathogenicity of the plant pathogenic bacterium Xanthomonas campestris pv. vesicatoria revealed by the complete genome sequence. J Bacteriol. 2005;187:7254–7266. doi: 10.1128/JB.187.21.7254-7266.2005. [DOI] [PMC free article] [PubMed] [Google Scholar]
- 20.White FF, Potnis N, Jones JB, Koebnik R. The type III effectors of Xanthomonas. Mol Plant Pathol. 2009;10:749–766. doi: 10.1111/j.1364-3703.2009.00590.x. [DOI] [PMC free article] [PubMed] [Google Scholar]
- 21.Cappelletti PA, dos Santos RF, do Amaral AM, Homem RA, Souza T dos S, Machado MA, et al. Structure-function analysis of the HrpB2-HrcU interaction in the Xanthomonas citri type III secretion system. PLoS ONE. 2011;6:e17614. doi: 10.1371/journal.pone.0017614. [DOI] [PMC free article] [PubMed] [Google Scholar]
- 22.Lorenz C, Büttner D. Secretion of early and late substrates of the type III secretion system from Xanthomonas is controlled by HpaC and the C-terminal domain of HrcU. Mol Microbiol. 2011;79:447–467. doi: 10.1111/j.1365-2958.2010.07461.x. [DOI] [PMC free article] [PubMed] [Google Scholar]
- 23.Büttner D, He SY. Type III protein secretion in plant pathogenic bacteria. Plant Physiol. 2009;150:1656–1664. doi: 10.1104/pp.109.139089. [DOI] [PMC free article] [PubMed] [Google Scholar]
- 24.Siciliano F, Torres P, Sendin L, Bermejo C, Filippone P, Vellice G, et al. Analysis of the molecular basis of Xanthomonas axonopodis pv. citri pathogenesis in Citrus limon. Electron J Biotechnol. 2006;9:0. doi: 10.2225/vol9-issue3-fulltext-20. [DOI] [Google Scholar]
- 25.Tang J-L, Liu Y-N, Barber CE, Dow JM, Wootton JC, Daniels MJ. Genetic and molecular analysis of a cluster of rpf genes involved in positive regulation of synthesis of extracellular enzymes and polysaccharide in Xanthomonas campestris pathovar campestris. Mol Gen Genet. 1991;226:409–417. doi: 10.1007/BF00260653. [DOI] [PubMed] [Google Scholar]
- 26.Wilson TJ, Bertrand N, Tang JL, Feng JX, Pan MQ, Barber CE, et al. The rpfA gene of Xanthomonas campestris pathovar campestris, which is involved in the regulation of pathogenicity factor production, encodes an aconitase. Mol Microbiol. 1998;28:961–970. doi: 10.1046/j.1365-2958.1998.00852.x. [DOI] [PubMed] [Google Scholar]
- 27.Rigano LA, Siciliano F, Enrique R, Sendín L, Filippone P, Torres PS, et al. Biofilm formation, epiphytic fitness, and canker development in Xanthomonas axonopodis pv. citri. Mol Plant Microbe Interact. 2007;20:1222–1230. doi: 10.1094/MPMI-20-10-1222. [DOI] [PubMed] [Google Scholar]
- 28.Vojnov AA, Slater H, Daniels MJ, Dow JM. Expression of the gum operon directing xanthan biosynthesis in Xanthomonas campestris and its regulation in planta. Mol Plant Microbe Interact. 2001;14:768–774. doi: 10.1094/MPMI.2001.14.6.768. [DOI] [PubMed] [Google Scholar]
- 29.Crossman L, Dow JM. Biofilm formation and dispersal in Xanthomonas campestris. Microbes Infect. 2004;6:623–629. doi: 10.1016/j.micinf.2004.01.013. [DOI] [PubMed] [Google Scholar]
- 30.Barber CE, Tang JL, Feng JX, Pan MQ, Wilson TJ, Slater H, et al. A novel regulatory system required for pathogenicity of Xanthomonas campestris is mediated by a small diffusible signal molecule. Mol Microbiol. 1997;24:555–566. doi: 10.1046/j.1365-2958.1997.3721736.x. [DOI] [PubMed] [Google Scholar]
- 31.Slater H, Alvarez-Morales A, Barber CE, Daniels MJ, Dow JM. A two-component system involving an HD-GYP domain protein links cell–cell signalling to pathogenicity gene expression in Xanthomonas campestris. Mol Microbiol. 2000;38:986–1003. doi: 10.1046/j.1365-2958.2000.02196.x. [DOI] [PubMed] [Google Scholar]
- 32.He Y-W, Xu M, Lin K, Ng Y-JA, Wen C-M, Wang L-H, et al. Genome scale analysis of diffusible signal factor regulon in Xanthomonas campestris pv. campestris: identification of novel cell–cell communication-dependent genes and functions. Mol Microbiol. 2006;59:610–622. doi: 10.1111/j.1365-2958.2005.04961.x. [DOI] [PubMed] [Google Scholar]
- 33.He Y-W, Zhang L-H. Quorum sensing and virulence regulation in Xanthomonas campestris. FEMS Microbiol Rev. 2008;32:842–857. doi: 10.1111/j.1574-6976.2008.00120.x. [DOI] [PubMed] [Google Scholar]
- 34.Malamud F, Homem RA, Conforte VP, Yaryura PM, Castagnaro AP, Marano MR, et al. Identification and characterization of biofilm formation-defective mutants of Xanthomonas citri subsp. citri. Microbiol Read Engl. 2013;159(Pt 9):1911–1919. doi: 10.1099/mic.0.064709-0. [DOI] [PubMed] [Google Scholar]
- 35.Li J, Wang N. Genome-wide mutagenesis of Xanthomonas axonopodis pv. citri reveals novel genetic determinants and regulation mechanisms of biofilm formation. PLoS ONE. 2011;6:e21804. doi: 10.1371/journal.pone.0021804. [DOI] [PMC free article] [PubMed] [Google Scholar]
- 36.Rai R, Ranjan M, Pradhan BB, Chatterjee S. Atypical regulation of virulence-associated functions by a diffusible signal factor in Xanthomonas oryzae pv. oryzae. Mol Plant Microbe Interact. 2012;25:789–801. doi: 10.1094/MPMI-11-11-0285-R. [DOI] [PubMed] [Google Scholar]
- 37.Kemp BP, Horne J, Bryant A, Cooper RM. Xanthomonas axonopodis pv. manihotis gumD gene is essential for EPS production and pathogenicity and enhances epiphytic survival on cassava (Manihot esculenta) Physiol Mol Plant Pathol. 2004;64:209–218. doi: 10.1016/j.pmpp.2004.08.007. [DOI] [Google Scholar]
- 38.Rajeshwari R, Jha G, Sonti RV. Role of an in planta-expressed xylanase of Xanthomonas oryzae pv. oryzae in promoting virulence on rice. Mol Plant Microbe Interact. 2005;18:830–837. doi: 10.1094/MPMI-18-0830. [DOI] [PubMed] [Google Scholar]
- 39.Büttner D, Bonas U. Regulation and secretion of Xanthomonas virulence factors. FEMS Microbiol Rev. 2010;34:107–133. doi: 10.1111/j.1574-6976.2009.00192.x. [DOI] [PubMed] [Google Scholar]
- 40.Das A, Rangaraj N, Sonti RV. Multiple adhesin-like functions of Xanthomonas oryzae pv. oryzae are involved in promoting leaf attachment, entry, and virulence on rice. Mol Plant-Microbe Interact. 2009;22:73–85. doi: 10.1094/MPMI-22-1-0073. [DOI] [PubMed] [Google Scholar]
- 41.Qian W, Jia Y, Ren S-X, He Y-Q, Feng J-X, Lu L-F, et al. Comparative and functional genomic analyses of the pathogenicity of phytopathogen Xanthomonas campestris pv. campestris. Genome Res. 2005;15:757–767. doi: 10.1101/gr.3378705. [DOI] [PMC free article] [PubMed] [Google Scholar]
- 42.Tondo ML, Petrocelli S, Ottado J, Orellano EG. The monofunctional catalase KatE of Xanthomonas axonopodis pv. citri is required for full virulence in citrus plants. PLoS ONE. 2010;5(5):e10803. doi: 10.1371/journal.pone.0010803. [DOI] [PMC free article] [PubMed] [Google Scholar]
- 43.Lau SK, Wong GK, Tsang AK, Teng JL, Fan RY, Tse H, et al. Virulence determinants, drug resistance and mobile genetic elements of Laribacter hongkongensis: a genome-wide analysis. Cell Biosci. 2011;1:17. doi: 10.1186/2045-3701-1-17. [DOI] [PMC free article] [PubMed] [Google Scholar]
- 44.Gioia J, Yerrapragada S, Qin X, Jiang H, Igboeli OC, Muzny D, et al. Paradoxical DNA repair and peroxide resistance gene conservation in Bacillus pumilus SAFR-032. PLoS ONE. 2007;2:e928. doi: 10.1371/journal.pone.0000928. [DOI] [PMC free article] [PubMed] [Google Scholar]
- 45.Ruths D, Nakhleh L. Recombination and phylogeny: effects and detection. Int J Bioinforma Res Appl. 2005;1:202–212. doi: 10.1504/IJBRA.2005.007578. [DOI] [PubMed] [Google Scholar]
- 46.Feng J-X, Song Z-Z, Duan C-J, Zhao S, Wu Y-Q, Wang C, et al. The xrvA gene of Xanthomonas oryzae pv. oryzae, encoding an H-NS-like protein, regulates virulence in rice. Microbiol Read Engl. 2009;155(Pt 9):3033–3044. doi: 10.1099/mic.0.028910-0. [DOI] [PubMed] [Google Scholar]
- 47.Yan Q, Wang N. High-throughput screening and analysis of genes of Xanthomonas citri subsp. citri involved in citrus canker symptom development. Mol Plant-Microbe Interact. 2012;25:69–84. doi: 10.1094/MPMI-05-11-0121. [DOI] [PubMed] [Google Scholar]
- 48.Sharma V, Firth AE, Antonov I, Fayet O, Atkins JF, Borodovsky M, et al. A pilot study of bacterial genes with disrupted ORFs reveals a surprising profusion of protein sequence recoding mediated by ribosomal frameshifting and transcriptional realignment. Mol Biol Evol. 2011;28(11):3195–211. doi: 10.1093/molbev/msr155. [DOI] [PMC free article] [PubMed] [Google Scholar]
- 49.Anisimova M, Bielawski JP, Yang Z. Accuracy and power of Bayes prediction of amino acid sites under positive selection. Mol Biol Evol. 2002;19:950–958. doi: 10.1093/oxfordjournals.molbev.a004152. [DOI] [PubMed] [Google Scholar]
- 50.Stoitsova SO, Braun Y, Ullrich MS, Weingart H. Characterization of the RND-Type multidrug efflux pump MexAB-OprM of the plant pathogen Pseudomonas syringae. Appl Environ Microbiol. 2008;74:3387–3393. doi: 10.1128/AEM.02866-07. [DOI] [PMC free article] [PubMed] [Google Scholar]
- 51.Fernando DM, Kumar A. Resistance-nodulation-division multidrug efflux pumps in gram-negative bacteria: role in virulence. Antibiotics. 2013;2:163–181. doi: 10.3390/antibiotics2010163. [DOI] [PMC free article] [PubMed] [Google Scholar]
- 52.Zerbino DR, Birney E. Velvet: algorithms for de novo short read assembly using de Bruijn graphs. Genome Res. 2008;18:821–829. doi: 10.1101/gr.074492.107. [DOI] [PMC free article] [PubMed] [Google Scholar]
- 53.Geneious Version 5.5.6 Created by Biomatters. Available from http://www.geneious.com/.
- 54.da Silva ACR, Ferro JA, Reinach FC, Farah CS, Furlan LR, Quaggio RB, et al. Comparison of the genomes of two Xanthomonas pathogens with differing host specificities. Nature. 2002;417:459–463. doi: 10.1038/417459a. [DOI] [PubMed] [Google Scholar]
- 55.Altschul SF, Gish W, Miller W, Myers EW, Lipman DJ. Basic local alignment search tool. J Mol Biol. 1990;215:403–410. doi: 10.1016/S0022-2836(05)80360-2. [DOI] [PubMed] [Google Scholar]
- 56.Darrasse A, Carrère S, Barbe V, Boureau T, Arrieta-Ortiz ML, Bonneau S, et al. Genome sequence of Xanthomonas fuscans subsp. fuscans strain 4834-R reveals that flagellar motility is not a general feature of xanthomonads. BMC Genomics. 2013;14:761. doi: 10.1186/1471-2164-14-761. [DOI] [PMC free article] [PubMed] [Google Scholar]
- 57.Angiuoli SV, Salzberg SL. Mugsy: fast multiple alignment of closely related whole genomes. Bioinformatics. 2011;27:334–342. doi: 10.1093/bioinformatics/btq665. [DOI] [PMC free article] [PubMed] [Google Scholar]
- 58.Langmead B, Salzberg SL. Fast gapped-read alignment with Bowtie 2. Nat Methods. 2012;9:357–359. doi: 10.1038/nmeth.1923. [DOI] [PMC free article] [PubMed] [Google Scholar]
- 59.Li H, Handsaker B, Wysoker A, Fennell T, Ruan J, Homer N, et al. 1000 Genome Project Data Processing Subgroup: the sequence alignment/map format and SAMtools. Bioinforma Oxf Engl. 2009;25:2078–2079. doi: 10.1093/bioinformatics/btp352. [DOI] [PMC free article] [PubMed] [Google Scholar]
- 60.Danecek P, Auton A, Abecasis G, Albers CA, Banks E, DePristo MA, et al. The variant call format and VCFtools. Bioinformatics. 2011;27(15):2156–8. doi: 10.1093/bioinformatics/btr330. [DOI] [PMC free article] [PubMed] [Google Scholar]
- 61.Krzywinski M, Schein J, Birol İ, Connors J, Gascoyne R, Horsman D, et al. Circos: an information aesthetic for comparative genomics. Genome Res. 2009;19:1639–1645. doi: 10.1101/gr.092759.109. [DOI] [PMC free article] [PubMed] [Google Scholar]
- 62.Hamming RW. Error detecting and error correcting codes. Bell Syst Tech J. 1950;29:147–160. doi: 10.1002/j.1538-7305.1950.tb00463.x. [DOI] [Google Scholar]
- 63.Martin D, Rybicki E. RDP: detection of recombination amongst aligned sequences. Bioinformatics. 2000;16:562–563. doi: 10.1093/bioinformatics/16.6.562. [DOI] [PubMed] [Google Scholar]
- 64.Darriba D, Taboada GL, Doallo R, Posada D. jModelTest 2: more models, new heuristics and parallel computing. Nat Methods. 2012;9:772. doi: 10.1038/nmeth.2109. [DOI] [PMC free article] [PubMed] [Google Scholar]
- 65.Guindon S, Dufayard J-F, Lefort V, Anisimova M, Hordijk W, Gascuel O. New algorithms and methods to estimate maximum-likelihood phylogenies: assessing the performance of PhyML 3.0. Syst Biol. 2010;59:307–321. doi: 10.1093/sysbio/syq010. [DOI] [PubMed] [Google Scholar]
- 66.FigTree. [http://tree.bio.ed.ac.uk/software/figtree/].
- 67.Huelsenbeck JP, Ronquist F, Nielsen R, Bollback JP. Bayesian inference of phylogeny and its impact on evolutionary biology. Science. 2001;294:2310–2314. doi: 10.1126/science.1065889. [DOI] [PubMed] [Google Scholar]
- 68.Huelsenbeck JP, Bollback JP. Empirical and hierarchical bayesian estimation of ancestral states. Syst Biol. 2001;50:351–366. doi: 10.1080/106351501300317978. [DOI] [PubMed] [Google Scholar]
- 69.Drummond A, Rambaut A. Tracer v1.4. Available from http://beast.bio.ed.ac.uk/Tracer. 2007.
- 70.Vallenet D, Labarre L, Rouy Z, Barbe V, Bocs S, Cruveiller S, et al. MaGe: a microbial genome annotation system supported by synteny results. Nucleic Acids Res. 2006;34:53–65. doi: 10.1093/nar/gkj406. [DOI] [PMC free article] [PubMed] [Google Scholar]
- 71.Vallenet D, Belda E, Calteau A, Cruveiller S, Engelen S, Lajus A, et al. MicroScope--an integrated microbial resource for the curation and comparative analysis of genomic and metabolic data. Nucleic Acids Res. 2013;41(Database issue):D636–647. doi: 10.1093/nar/gks1194. [DOI] [PMC free article] [PubMed] [Google Scholar]
- 72.R Development Core Team . {R: A Language and Environment for Statistical Computing} Vienna: R Foundation for Statistical Computing; 2009. [Google Scholar]
- 73.Benjamini Y, Hochberg Y. Controlling the false discovery rate: a practical and powerful approach to multiple testing. J R Stat Soc Ser B Methodol. 1995;57:289–300. [Google Scholar]