

Abstract
Rare genetic syndromes characterized by early-onset type 2 diabetes have revealed the importance of pancreatic β-cells in genetic susceptibility to diabetes. However, the role of genetic regulation of β-cells in disorders that are also characterized by highly penetrant obesity, a major additional risk factor, is unclear. In this study, we investigated the contribution of genes associated with two obesity ciliopathies, Bardet–Biedl Syndrome and Alstrom Syndrome, to the production and maintenance of pancreatic β-cells. Using zebrafish models of these syndromes, we identified opposing effects on production of β-cells. Loss of the Alstrom gene, alms1, resulted in a significant decrease in β-cell production whereas loss of BBS genes, bbs1 or bbs4, resulted in a significant increase. Examination of the regulatory program underlying β-cell production suggested that these effects were specific to β-cells. In addition to the initial production of β-cells, we observed significant differences in their continued maintenance. Under prolonged exposure to high glucose conditions, alms1-deficient β-cells were unable to continually expand as a result of decreased proliferation and increased cell death. Although bbs1-deficient β-cells were similarly susceptible to apoptosis, the overall maintenance of β-cell number in those animals was sustained likely due to increased proliferation. Taken together, these findings implicate discrepant production and maintenance of β-cells in the differential susceptibility to diabetes found between these two genetic syndromes.
Introduction
Genetic regulation of β-cell function has emerged as an important mechanism underlying susceptibility to diabetes, particularly when coupled with other risk factors such as obesity. Recently, genetic studies have revealed important roles for genes implicated in β-cell function in susceptibility to type 2 diabetes (1–6). In addition, defects in genes necessary for β-cell function are often the driver of more extreme early-onset diabetes, including monogenic forms of diabetes. While these observations provide evidence for the importance of β-cell maintenance in mediating diabetes susceptibility, the extent to which genes associated with obesity syndromes contribute to maintenance of β-cell mass and function is unclear.
The obesity ciliopathies, Bardet–Biedl syndrome (BBS) and Alstrom syndrome, represent models of disorders exhibiting highly penetrant childhood obesity often compounded with diabetes. BBS and Alstrom are autosomal recessive syndromes classified among the ciliopathies, diseases resulting from dysfunction in primary cilia (7–11). As such, BBS and Alstrom are thought to be caused by similar cellular etiologies and, therefore, exhibit similar phenotypes. For example, both are characterized by highly penetrant early-onset obesity, afflicting between 75 and 100% of patients (12,13). Interestingly, however, the two disorders exhibit vastly discrepant susceptibilities to childhood onset type 2 diabetes. Alstrom syndrome represents an extreme form of childhood diabetes with 75% of patients developing the disease usually by adolescence (14). BBS patients, however, are less susceptible early in life as the majority of reported BBS cohorts report only 2–6% prevalence in childhood (14–17). These data suggest that the incidence of diabetes in these syndromes may not be entirely caused by the presence of obesity and that other early-onset factors may determine risk.
Relatively little is known about the putative roles of BBS genes or the Alstrom syndrome gene, ALMS1, in regulation of glucose homeostasis. Much of the focus has centered around insulin sensitivity. Severe, early-onset insulin resistance is characteristic of Alstrom patients (18–20). Reports in BBS patients also suggest that insulin resistance can be a common feature of that disorder (16). Much less is known, however, about maintenance of pancreatic β-cell function in BBS and Alstrom patients. Reports in Alstrom syndrome patients indicate impaired β-cell function even without any further worsening of insulin resistance with age (12). Similar studies of β-cell function in BBS patients, however, have not been reported. In light of these observations, it is possible that discrepancies in susceptibility to diabetes between BBS and Alstrom are dictated, in part, by differences in the ability to produce and/or maintain β-cells.
Here, we investigated this possibility in zebrafish models of BBS and Alstrom syndrome. In zebrafish, genes involved in pancreas development are highly conserved compared with mammalian systems (21–25). We suppressed expression of either of two BBS genes, bbs1 or bbs4, as well as the sole Alstrom syndrome gene, alms1, and assessed the impact on initial production of β-cells as well as their adaptive capacity in response to hyperglycemic conditions or to ablation. Our findings suggest that loss of alms1 significantly depletes β-cell mass during development. In contrast, we observed a specific enhancement of β-cell mass with depletion of BBS genes. Investigation of the regulatory program governing β-cell specification suggested that these effects were specific to β-cells. In addition, loss of alms1 resulted in β-cells that do not expand in response to glucose and do not regenerate efficiently, defects not observed in animals depleted of bbs genes. Further investigation into proliferation and apoptosis revealed increased susceptibility to cell death under high glucose conditions in both disease models, but compensatory increased proliferation was only present with loss of bbs1. Taken together, these observations suggest that alms1 is necessary for maintaining β-cell mass whereas loss of BBS genes enhances it. These findings indicate novel contrasting roles for these genes in β-cell survival.
Results
Loss of Alms1 or BBS proteins results in opposing effects on initial β-cell production
To model BBS and Alstrom syndrome in zebrafish, we targeted orthologs of genes underlying the two disorders. We first set out to investigate the effects of depletion of alms1 and either bbs1 or bbs4 on initial production of β-cells by suppressing their expression in zebrafish embryos. To do so, we used previously published translation-blocking morpholino antisense oligonucleotides (MOs) targeting bbs1 or bbs4 (26) or a splice-blocking MO targeting alms1 transcript. For in vivo visualization of β-cells, we injected MOs into one- to two-cell stage embryos of a transgenic zebrafish line, Tg(insa:mCherry), expressing mCherry under the control of the preproinsulin promoter (27). To create a broad picture of β-cell production during development, we examined the area of β-cell mass by fluorescence microscopy at two developmental stages: 48 hours post-fertilization (hpf), when β-cells and other endocrine cell types become organized into an islet, and 5 days post-fertilization (dpf) when the pancreas is morphologically mature (28). Embryos injected with a control MO exhibited an average β-cell area of 8.60 ± 3.31 μm2 at 48 hpf (n = 29) and 7.71 ± 4 μm2 at 5 dpf (n = 41). As an additional indicator of β-cell production, we also assessed the intensity of the fluorescence signal. The average fluorescence intensity in control animals was 4.56 ± 3.31 at 48 hpf (n = 29) and 3.55 ± 2.44 at 5 dpf (n = 41). Both the area and intensity of mCherry expression were significantly reduced with depletion of alms1 expression at either time point (P < 0.0001; Fig. 1A and B). The effects with loss of either bbs1 or bbs4, however, were strikingly different. At 48 hpf both area and intensity of mCherry expression were increased relative to control when bbs1 expression was reduced (P < 0.0001), while loss of bbs4 resulted in β-cell area similar to controls (Fig. 1A and B). By 5 dpf, the increase in area and intensity in bbs1 morphants was still evident, although not significant.
Figure 1.

Loss of Alms1 or BBS proteins results in opposing effects on β-cell production. (A) insa:mCherry expression at 48 hpf. Brightfield image of representative animal shown, boxed area represents area of mCherry fluorescence in control and alms1, bbs1, bbs4 morphants. (B) Quantification of area and intensity of mCherry fluorescence of β-cell mass at 48 hpf and 5 dpf. Intensity represents fluorescence intensity per pixel as calculated by ImageJ software. (C) Visualization of individual β-cells in control and MO-injected animals at 48 hpf and 5 dpf. (D) β-cell count in control and MO-injected animals at 48 hpf and 5 dpf. Student's t-test was performed on the dataset. Error bars represent standard deviation; **P < 0.0001 relative to control after adjustment for multiple testing using Bonferroni correction. n ≥ 20 per experiment. Scale bar = 100 μm.
Changes in β-cell area alone may not be indicative of changes in β-cell mass due to the possibility of general defects in pancreas development. To determine if the observed alterations in β-cell area indeed represented changes in β-cell mass, we measured both the exocrine pancreas and β-cell areas in alms1-, bbs1- and bbs4-depleted Tg(ptf1a:GFP/insa:mCherry) animals. Tg(ptf1a:GFP/insa:mCherry) is a double transgenic zebrafish line expressing GFP under the control of the exocrine pancreas marker ptf1a promoter in addition to mCherry expression in β-cells (29). At 5 dpf, we imaged the exocrine pancreas and quantified the average area of GFP expression using ImageJ software. Although suppression of alms1 resulted in reduced β-cell mass, exocrine pancreas area was similar to control (alms1 = 312.29 ± 74.18 μm2; control = 329.63 ± 89.47 μm2; P = 0.24; Supplementary Material, Fig. S1A and B). Loss of bbs4 also did not impact the average area of GFP expression (328.45 ± 143.52 μm2; P = 0.99; Supplementary Material, Fig. S1A and B), although reduction of bbs1 caused a slightly smaller exocrine pancreas (Supplementary Material, Fig. S1A and B, P = 0.0078). Using these quantifications, we calculated the ratio of β-cell mass area to exocrine area. This ratio indicated a significant decrease in relative β-cell area in alms1 MO-injected animals at 5 dpf as well as a significant increase in bbs1 morphants (Supplementary Material, Fig. S1C, P < 0.0001), suggesting alterations in β-cell mass, relative to total pancreas. The relative β-cell mass area in bbs4-depleted embryos was not significantly different from that of controls (Fig. 1B and Supplementary Material, Fig. S1B).
These findings suggested opposing effects on β-cells as a result of loss of alms1 or the BBS genes. To more accurately clarify this possibility, we quantified β-cell number. We fixed animals at both time points and mounted them on microscope slides such that individual β-cells could be evaluated. Control animals exhibited an average of 15 ± 3 β-cells at 48 hpf (n = 21) and an average of 35 ± 4 β-cells per animal in the principal islet at 5 dpf (n = 54) (Fig. 1C and D). Consistent with quantification of the area, we observed a significant reduction in the number of β-cells in alms1 morphants at 48 hpf (10 ± 3 β-cells, n = 31, P < 0.0001) as well as at 5 dpf (26 ± 6 β-cells, n = 56, P < 0.0001). Suppression of either bbs1 or bbs4, however, resulted in the opposite effect. At 48 hpf, bbs1-deficient embryos exhibited an average of 27 ± 6 β-cells (n = 30, P < 0.0001) and an average of 46 ± 8 β-cells in the principal islet at 5 dpf (n = 32, P < 0.0001). Likewise, suppression of bbs4 resulted in an average of 19 ± 3 β-cells at 48 hpf (n = 32, P < 0.0001) and an average of 40 ± 6 β-cells per animal in the principal islet at 5 dpf (n = 20, P < 0.0001). To further determine the specificity of the effect, we calculated the ratio of β-cell number relative to exocrine area (Supplementary Material, Fig. S1D). The ratio of β-cell number to exocrine area was significantly decreased in alms1-depleted embryos (P < 0.0001) and significantly increased in bbs1-depleted embryos (P < 0.0001) while bbs4-depleted embryos were increased (P < 0.01) but not to significant levels after Bonferroni correction for multiple comparisons. However, these results support our previous observations and indicate opposing effects between the two disease models.
Validation of MO sensitivity and specificity
To ensure that the observed effects were attributable to suppression of each gene, we carried out multiple validations to verify the sensitivity and specificity of each morpholino. We first confirmed the reduction of each target protein by western blot (Supplementary Material, Fig. S2A–C) corroborating our previously reported reduction for bbs1 and bbs4 MOs ((26), Supplementary Material, Fig. S2A and B). For alms1, we observed a significant decrease in the abundance of both mRNA and protein found in MO-injected animals (Supplementary Material, Fig. S2C and D). To ensure that this decrease was the result of targeting the alms1 transcript, we validated the efficacy of the splice-blocking alms1 MO by confirming disruption of transcript splicing via reverse transcription polymerase chain reaction (RT-PCR) at 2, 5 and 6 dpf (Supplementary Material, Fig. S2E).
To test the specificity of the observed phenotypes and to preclude the possible contribution of off-target toxicity induced by MOs, we examined expression of Δ113 p53 mRNA, an isoform of p53 that has been reported as a diagnostic marker of MO-induced off-target toxicity and cell death (30). Quantification of the Δ113 p53 transcript revealed no significant changes between control morphants and those injected with either alms1 or bbs1 MO. A significantly increased level was detected in bbs4 morphants (P = 0.006) offering an explanation for the increased mortality in bbs4 MO-injected embryos (Supplementary Material, Fig. S2F). We therefore injected a second splice-blocking MO against bbs4 (bbs4 MO2, Supplementary Material, Fig. S3). Similar to the first bbs4 MO, this MO resulted in the expansion of β-cell number (Supplementary Material, Fig. S3D and E) without affecting the exocrine pancreas (Supplementary Material, Fig. S3F and G) validating that the effect on β-cells was not likely a result of off-target effects given the lack of increased Δ113 p53 (Supplementary Material, Fig. S3C). Consistent with our initial observations, the ratio of relative β-cell number over the area of exocrine pancreas was significantly increased (Supplementary Material, Fig. S3H, P < 0.0001) compared with control upon injection of the second MO. We further examined the specificity of the MO effects on β-cell number by assessing the ability of either bbs1 or bbs4 mRNA to rescue the increase imparted by MO alone. We found that co-injection of 50 pg of bbs1 mRNA and 100 pg of bbs4 mRNA encoding each gene restored the number of β-cells at 5 dpf to 36 ± 4 β-cells per principal islet (n = 32) and 35 ± 2 (n = 30), respectively. These numbers were statistically indistinguishable from controls (Supplementary Material, Fig. S2G and H). Despite the increased off-target toxicity, the expression of bbs4 mRNA rescued the β-cell phenotype, suggesting that it is specific to that gene and not likely a result of off-target MO effects.
Finally, to validate the specificity of the β-cell phenotypes induced by each MO, we assessed the concordance of β-cell production in MO-injected embryos with mutant embryos engineered for disruption of the corresponding gene by CRISPR/Cas9 approaches. We found that the β-cell mass and fluorescence intensity were significantly decreased in alms1 gRNA/Cas9-injected embryos, as well as their F1 progeny, while both characteristics were significantly increased in bbs1 and bbs4 gRNA/Cas9-injected embryos and their F1 progeny (Supplementary Material, Fig. S2I and J, and S3A and B). The efficacy of CRISPR/Cas9 targeting was validated via the T7 endonuclease assay in F0 and F1 embryos assessed for β-cell mass (Supplementary Material, Fig. S2K and L) (31,32).
Assessment of pancreatic progenitors and differentiated endocrine cells suggests β-cell specific effects
The presence of normal exocrine pancreas in all morphants suggested that the beta-cell mass was specifically perturbed. To determine if effects were exclusive to β-cells and to provide insight into the regulation of β-cell production by each gene, we carried out whole-mount in situ hybridization to examine the regulatory program during early and late pancreatic development. At 48 hpf, we examined markers of broad pancreatic progenitor (pdx1) and endocrine pancreatic progenitors (neuroD, islet1) (Fig. 2A). To assess the contributions to other differentiating and differentiated endocrine cell types, we assessed markers of α-cells (glucagon) and δ-cells (somatostatin) at 48 hpf and 5 dpf (Fig. 2B and C). Interestingly, loss of alms1 expression did not change either progenitor population or any other differentiated cell type at any stage (Fig. 2A–C), suggesting that the observed deficits in β-cells were specific to only those cells. However, the expression of both pdx1 and endocrine progenitor markers were reduced in bbs1 and bbs4 morphants (Fig. 2A). In spite of this, suppression of either gene resulted in relatively normal expression of glucagon by 5 dpf, though in both cases it was initially reduced at 48 hpf (Fig. 2B). Expression of somatostatin exhibited a similar pattern in bbs1-depleted embryos, where expression was decreased relative to controls at 48 hpf, but returned to normal by 5 dpf (Fig. 2C). However, somatostatin expression continued to be reduced throughout development with loss of bbs4 (Fig. 2C), suggesting specific enhancement of the β-cell population potentially at the expense of other cell types.
Figure 2.

Effects of reduced alms1, bbs1 and bbs4 on pancreatic progenitor and endocrine cell populations. (A) Whole mount in situ hybridization in control, alms1 MO, bbs1 MO or bbs4 MO-injected embryos at 48 hpf using markers of broad pancreatic progenitors (pdx1) or endocrine progenitors (neuroD, islet1). (B) Detection of α-cell marker glucagon in 48 hpf and 5 dpf embryos. (C) Detection of δ-cell marker somatostatin (sst1) in 48 hpf and 5 dpf embryos. Scale bars shown at left panels represent 100 μm. Scale bars in magnified areas represent 25 μm. Images representative of groups of 30 embryos used per probe in triplicated experiments.
Alms1 is necessary for continued β-cell expansion in response to glucose
Production of β-cells during developmental stages may be relevant to the onset of type 2 diabetes as a result of impaired β-cell reserve. It may also be indicative of the adaptive capacity of β-cells and the ability to produce and expand β-cells in response to hyperglycemic conditions. To analyze the potential contributions of alms1, bbs1 and bbs4 to the latter, we assessed expansion of the β-cell population in response to high glucose conditions, a treatment that significantly increases the number of β-cells in zebrafish larvae similar to mammals (33). MO-injected Tg(insa:mCherry) embryos were transferred at 24 hpf to either 20 mm glucose media or glucose-free embryo media. To monitor the response to high glucose, we quantified the number of β-cells in each condition at 48 hpf and 5 dpf. Consistent with previous reports, the average β-cell number in control embryos increased at both stages. Embryos cultured in control media exhibited an average of 15 ± 3 β-cells (n = 21) at 48 hpf and 35 ± 3 (n = 33) at 5 dpf. Under high glucose cultured conditions, those numbers increased significantly to 24 ± 3 (n = 21, P < 0.0001) at 48 hpf and 44 ± 7 (n = 63, P < 0.0001) at 5 dpf (Fig. 3A–C). Suppression of alms1 impeded this response but only at the later stage. β-cells in alms1-deficient embryos were able to expand initially, showing a significant increase from 10 ± 3 β-cells in control medium (n = 31) at 48 hpf to 19 ± 6 β-cells in high glucose medium (n = 29, P < 0.0001). This expansion was diminished with prolonged exposure to glucose; only an average of 24 ± 10 β-cells (n = 71) were present at 5 dpf (Fig. 3C). Surprisingly, no significant expansion was observed at either stage in animals depleted of either bbs1 or bbs4, though the significant increase in β-cell number relative to controls continued to be consistent for both genes at both stages (Fig. 3A–C). A similar response was observed in embryos injected with the second bbs4 MO and cultured under similar conditions (Supplementary Material, Fig. S3G and H).
Figure 3.

Effects of hyperglycemic conditions on β-cell expansion with loss of Alstrom or BBS genes. (A) Representative brightfield image of 5 dpf larva with boxed region indicating area shown in fluorescence images. mCherry-expressing β-cells in 5 dpf controls and morphants grown in the absence and presence of glucose. (B) Quantification of β-cell number at 48 hpf under normal and high glucose conditions. (C) Quantification of β-cell number at 5 dpf under normal and high glucose conditions. Student's t-test was performed on the dataset. Error bars represent standard deviation. **Significance (P < 0.0001) post-Bonferroni correction for multiple comparisons, n ≥ 20 assessed per experimental group.
Alms1 and Bbs1 have opposing effects on β-cell proliferative capacity
Reduction of alms1 resulted in fewer β-cells even in response to high glucose conditions despite having no effect on progenitor populations. This suggests the possibility that alms1-depleted β-cells possibly have reduced ability to proliferate. Additionally, the ability to produce more β-cells from fewer progenitor cells in BBS gene-deficient embryos suggest enhanced proliferative capacity. To test this, we examined proliferation in the β-cell mass at 48 hpf and 5 dpf by immunofluorescence using anti-phospho-Histone H3 antibody. Because reduced bbs1 and bbs4 resulted in similar enhancement of β-cell mass, we assessed bbs1-depleted embryos. Only 10 and 16.67% of alms1 morphants at 48 hpf and 5 dpf, respectively, exhibited proliferative β-cells which was significantly less than controls at either stage (13.39% at 48 hpf, 28.57% at 5 dpf; P < 0.0001, Fig. 4A–D and M). In contrast, significantly higher percentages of bbs1 morphants (46.43% at 48 hpf, P < 0.0001; 50% at 5 dpf, P = 0.001) displayed proliferative β-cells (Fig. 4E and F, and M).
Figure 4.

alms1 and bbs1 have opposing effects on β-cell proliferative capacity. Whole mount immunofluorescent staining with anti-phospho histone H3 antibody to label proliferative cells (green) in β-cell mass (mCherry) in control, alms1- or bbs1-depleted embryos grown in normal embryo medium (A–F) or with high glucose (G–L) at 48 hpf or 5 dpf. (M) Quantification of the percentage of control, alms1- or bbs1-depleted embryos with proliferative β-cells at either stage. Student's t-test was performed on the dataset. Error bars represent standard deviation. **Significance (P < 0.0001) and *significance P = 0.001 after correcting for multiple comparisons. n ≥ 20 assessed per experimental group.
We reasoned that exposure to high glucose media may enhance proliferation. Indeed, the proportion of control embryos with proliferative β-cells increased to 31.25% at 48 hpf and 46.43% at 5 dpf (Fig. 4G and H, and M). Interestingly, glucose treatment increased the percentage in alms1-deficient embryos initially (20% at 48 hpf, albeit at a rate significantly less than control, P < 0.0001), but this was completely ablated by 5 dpf (Fig. 4I and J, and M). bbs1 morphants continued to exhibit high levels of proliferation in β-cells at either stage in the presence of high glucose conditions (54.55% at 48 hpf, 46.67% at 5 dpf) (Fig. 4K–M).
Depletion of alms1 and bbs1 resulted in β-cell death
Our observations of β-cell response over a relatively long high-glucose treatment period indicated that alms1-deficient β-cells initially respond to glucose but lose the ability over prolonged exposure. In addition, bbs1-depleted β-cells did not increase in number overall, even though proliferation increased. In light of these observations, we asked whether these β-cells are susceptible to glucose toxicity and subsequent cell death. To test this, we performed immunofluorescence using anti-active Caspase-3 antibody, a marker of apoptotic cells. We first examined embryos cultured in normal embryo medium without the addition of glucose. At 48 hpf, no embryos in any group (control, alms1 or bbs1) exhibited apoptotic β-cells (Fig. 5A, C, E and M). However, by 5 dpf 16.67% of alms1-depleted embryos exhibited apoptotic β-cells, which was significantly increased (P < 0.0001) over the complete lack of apoptosis observed in control β-cells (Fig. 5B and M). Surprisingly, 42.85% of bbs1-depleted embryos exhibited apoptotic β-cells at 5 dpf, a striking increase (P < 0.0001) relative to controls (Fig. 5E and F, and M).
Figure 5.

Depletion of alms1 and bbs1 leads to apoptosis of β-cells. Whole mount immunofluorescent staining with anti-active caspase-3 antibody labeling apoptotic cells (green) in β-cell mass (red) in control, alms1- or bbs1-depleted embryos grown in normal embryo medium (A–F) or grown in 20 mm glucose (G–L). (M) Quantification of percentage of total control, alms1- and bbs1-depleted embryos with apoptotic β-cells. Student's t-test was performed on the dataset. Error bars represent standard deviation. **Significance (P < 0.0001) after Bonferroni correction for multiple comparisons. n ≥ 20 assessed per experimental group.
To assess the contribution of glucose toxicity in β-cell apoptosis, we assessed cell death in embryos cultured in high glucose. Under these conditions, at either 48 hpf or 5 dpf, 11.11% of control embryos had apoptotic β-cells (Fig. 5G and H, and M). Similar to controls, 16.66% of alms1-deficient embryos exhibited β-cell death when supplemented with glucose at 48 hpf. This number increased to 41.43% at 5 dpf (Fig. 5I and J, and M). Interestingly, bbs1-depleted embryos were the most tolerant of the high glucose conditions initially, as no apoptotic β-cells at 48 hpf could be detected. However, with prolonged exposure to glucose 50% of larvae exhibited β-cell death (Fig. 5K–M).
Alms1 is required for β-cell regenerative capacity
We observed an initial increase in glucose-induced expansion and proliferation of alms1-deficient β-cells that was followed by cell death after prolonged exposure. This suggested that loss of alms1 renders β-cells more susceptible to glucose toxicity without compensatory increases in proliferation. In light of this, we set out to determine whether these cells would be able to regenerate after apoptosis. We reasoned that an overall deficiency in β-cell mass and potentially function may be the result of increased susceptibility to cell death and an inability to replenish lost β-cell mass. To test this possibility we suppressed alms1 expression in a previously reported transgenic line, Tg(insa:nsfB-mCherry), in which β-cells are specifically ablated upon treatment with the prodrug metronidazole (27). At 48 hpf, embryos were incubated in metronidazole for 48 h to completely ablate β-cells (Fig. 6A). Twenty-four hours after transfer to normal embryo media, control larvae regenerated β-cells as previously reported (27) and produced an average of 9 ± 3 β-cells (n = 36, Fig. 6A and B). At 5 dpf, alms1-depleted embryos regenerated significantly less β-cells after ablation (6 ± 3, n = 26, P = 0.0003; Fig. 6A and B). However, bbs1-depleted β-cells regenerated at a rate similar to control (10 ± 3, n = 20, P = 0.24; Fig. 6A and B) consistent with their ability to proliferate.
Figure 6.

Alms1 is required for regeneration of β-cells. (A) Ablation of β-cells in Tg(insa:nsfB-mCherry) larvae at 4 dpf after treatment with metronidazole (post-ablation), followed by β-cell regeneration (post-recovery) until 5 dpf. Untreated transgenic larvae cultured in embryo medium only over 5 dpf. (B) Quantification of β-cell number at 5 dpf following ablation and regeneration. Student's t-test was performed on the dataset. Error bars represent standard deviation. **Significance (P < 0.0001) after multiple comparisons adjustment using Bonferroni correction, n ≥ 20 per treatment.
Glucose homeostasis in alms1 and bbs-depleted larvae is consistent with β-cell defects
To determine if changes in β-cell mass correlate with functional discrepancies in glucose regulation, we assessed the ability of alms1-, bbs1- or bbs4-deficient larvae to maintain glucose levels. Furthermore, 5 dpf larvae were fed a larval diet supplemented with 40 mm glucose for 48 h followed by homogenization and measurement of total glucose. The average glucose levels of pooled homogenates of 20 larvae were significantly higher in larvae with reduced alms1 expression (P < 0.0001, Fig. 7), consistent with reduced β-cell mass. In contrast, bbs1-deficient larvae exhibited significantly lower glucose levels (P < 0.0001) and bbs4 morphants were able to maintain glucose levels similar to controls (P = 0.3326) when challenged with high glucose (Fig. 7). This suggested that the increased β-cell mass was functional and able to maintain glucose homeostasis.
Figure 7.

alms1 but not bbs1 or bbs4 is necessary for proper glucose regulation. Glucose levels in whole larvae homogenates from control or alms1-, bbs1- or bbs4-deficient larvae given larval diet supplemented with 40 mm glucose. Student's t-test was performed on the dataset. **P < 0.001 relative to control after adjustment for multiple comparisons using Bonferroni correction. Error bars represent standard deviation.
Discussion
In this study, we characterized the production and maintenance of pancreatic β-cells in models of two ciliopathies associated with obesity and varying rates of diabetes. Our findings suggest stark differences between the abilities of BBS gene-depleted β-cells and Alms1-depleted β-cells in production and maintenance after prolonged exposure to glucose. Our observations suggest that the initial discrepancies in production of β-cells between the two models are likely β-cell specific as a result of divergent developmental programs. This is supported by our observations of markers of other endocrine cell types and progenitor populations. While alms1-deficient embryos exhibited relatively normal progenitor pools compared with controls, only β-cells appear to be affected suggesting that those cells are specifically impacted (Fig. 8). Animals deficient in BBS gene expression, however, showed significantly reduced areas of progenitor marker expression. Furthermore, production of β-cells was increased but was accompanied by a decrease in other endocrine cell types, namely glucagon expressing α-cells and somatostatin-expressing δ-cells during early developmental stages. This suggests that an initially depleted progenitor pool becomes skewed toward the production of β-cells at the expense of other cell types with loss of BBS (Fig. 8). This possibility is also supported by the initial increase in proliferation observed in bbs1-deficient β-cells which might suggest an expansion of early β-cell mass perhaps at the expense of other cell types.
Figure 8.
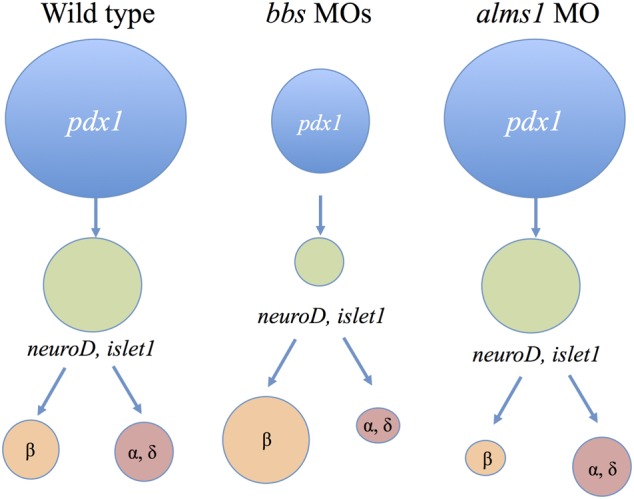
BBS and Alstrom genes specifically alter β-cell production. In wild-type pancreatic development, pancreatic progenitors (pdx1, blue) give rise to endocrine progenitors (neuroD and islet1, green), which then differentiate into endocrine cell types. Animals depleted of BBS genes exhibit fewer pancreatic progenitors, which in turn give rise to fewer endocrine progenitor cells. β-cell production from these progenitors is increased, potentially at the expense of other differentiated cell types. Loss of Alms1 does not alter progenitor populations but specifically and significantly decreases β-cell mass.
In addition to the initial production of β-cells, our findings also support significant differences in the continued maintenance of those cells. Exposure to high glucose conditions, reminiscent of the increased demand imparted by insulin resistance, revealed that alms1-deficient β-cells are more susceptible to loss through cell death and glucose toxicity. The number of β-cells was reduced over prolonged exposure to high glucose conditions accompanied by a concomitant increase in markers of apoptosis and a decrease in cell proliferation. Surprisingly, we observed a similar increase in cell death in β-cells deficient in bbs1; however, the overall maintenance of β-cell number in those animals is likely due to an increase in proliferation, which was maintained throughout the glucose exposure period. These observations indicate that although BBS gene-deficient β-cells may become susceptible to glucose toxicity, the total β-cell mass is able to compensate at least for some time due to increased proliferation. These data may offer a mechanism by which BBS patients are better able to stave off onset of diabetes at least until later in life whereas Alstrom patients are not.
These findings are the first comprehensive analysis of production and maintenance of β-cell mass in models of the ciliopathies. Importantly, we have not investigated the potential roles of these genes in β-cell function, specifically insulin secretion. Although a role for ALMS1 has not been previously reported, two studies have investigated the role of BBS genes in insulin secretion. Suppression of Bbs5, Bbs7 and Bbs9 in cultured MIN6 cells were reported to result in insulin hypersecretion (34). This is in contrast with a recent report demonstrating deficiencies in first-phase insulin release as a result of decreased Bbs4, potentially through regulation of insulin receptor signaling (35). Our study may offer a mechanism to reconcile these differences. Given the importance of β-cell number in overall function of β-cell mass (36), our findings suggest a role for proliferation and continued replenishment of β-cells as an important factor in glucose regulation in obesity ciliopathies.
This raises the question of glucose regulation and β-cell function over time in models of BBS and Alstrom syndrome. Due to the technical limitations of this study and to the time window for transparency of zebrafish embryos, our observations were limited to early stages of life. However, β-cell dysfunction in ciliopathies and other similar models of young onset diabetes occur during childhood and juvenile stages. It is possible that continued examination over later periods of life would begin to reveal even more striking contrasts between these two models. For example, over longer periods of hyperglycemia due to the insulin resistance that is often present in BBS or Alstrom (16,18–20), more dramatic depletion of β-cell mass and subsequent changes in function may be observed. Our findings suggest the possibility that BBS gene-deficient β-cells are perhaps better able to cope with prolonged periods of demand for insulin although they may eventually become exhausted as a result of an inability to compensate for the high degree of cell death.
These findings underscore the utility of rare syndromes for the understanding of genetic susceptibility in more common forms of diabetes. Our observations here suggest that the ciliopathies may represent useful genetic models for the study of β-cell deficiencies and subsequent onset of diabetes. Excitingly, these findings potentially implicate primary cilia as important regulators of β-cell production and maintenance. Indeed, cilia have been implicated in the regulation of many pathways that are important for β-cell regulation, including developmental pathways such as Wnt, Notch and Shh (26,37–40) as well as metabolic pathways that may also influence production of β-cells such as IGF-1, insulin receptor and mTOR signaling (35,41–43). While the mechanisms by which BBS or Alstrom genes may contribute to β-cell production are not clear, these observations raise the possibility of identification of novel pathways contributing to the regulation of β-cell mass and function.
Materials and Methods
Zebrafish lines
Experiments were carried out using the following zebrafish lines: Tubingen (WT), Tg(ptf1a:GFP;insa:mCherry) kindly received from Steve Leach (JHU/Mount Sinai), and Tg(insa:mCherry) and Tg(insa:nsfB-mCherry) kindly received from Michael Parsons (JHU). Adult zebrafish were housed and naturally mated according to standard protocol. All zebrafish work was conducted in accordance with University of Maryland IACUC guidelines.
Morpholinos
MOs that block translation (TB) or splicing (SB) of targeted mRNAs were injected into one- to two- cell stage embryos. We used previously validated MOs to target bbs1 (SB) and bbs4 (TB) (26) and designed SB MO (e4i45′-TTAAGTGCTGAACTTACCGGGATTC-3′) to target alms1 transcript. A second splice-blocking bbs4 MO was designed to confirm β-cell phenotype (5′-TGTGTATTGAGACCTACTCCACAGC-3′). A control non-specific MO was used (5′-CCTCTTACCTCAGTTACAATTTATA-3′). The embryos were grown at 28°C until harvesting for analyses.
β-cell analysis
The Tg(insa:mCherry) line which labels β-cells specifically by expressing mCherry under the control of the preproinsulin (insa) promoter and Tg(ptf1a:GFP;insa:mCherry) which expresses GFP under the control of exocrine pancreas marker ptf1a along with mCherry under the control of the insa promoter were used to quantify: (1) the size of the β-cell mass (area of mCherry expression), (2) the level of insa expression (intensity of fluorescence/pixel) and (3) the size of exocrine pancreas (area of GFP expression) by imaging embryos using a Zeiss Lumar v12 stereomicroscope and ImageJ software.
The number of β-cells was determined according to published protocol (33). Embryos were fixed in 4% paraformaldehyde (PFA), washed in phosphate-buffered saline, 0.1% Tween 20 (PBST) and flat mounted in ProLong®Gold antifade (Life Technologies) with the right lateral side facing the coverslip. Sufficient pressure was applied to disrupt the islets in order to visualize individual cells. The number of β-cells was counted manually under a Zeiss Lumar v12 stereomicroscope. The yolk mass was removed prior to flat mounting from the embryos analyzed at 48 hpf. The analysis of β-cells was performed on embryos collected from three different injections of either control or test morpholinos.
Whole-mount immunofluorescence
Embryos, collected from two separate injections were fixed in 4% PFA overnight, dehydrated in cold methanol at −20°C for 2 h, rehydrated and permeablized in acetone at −20°C for 30 min. Embryos were then washed in PBST, blocked in PBST supplemented with 1% dimethyl sulfoxide, 1% bovine serum albumin (BSA) and 10% goat serum for 1 h at room temperature followed by overnight incubation in primary antibodies and a 2 h incubation in secondary antibodies following washes. The immunostained embryos were then washed and kept in PBST with 1% BSA until analyzed. Primary antibodies used included rabbit anti-Histone H3 (phospho S10) (1:200, Abcam) and rabbit anti-Active Caspase3 (1:500, BD Pharmingen). Species-specific secondary antibodies (AlexaFluor®, Invitrogen) were used at 1:1000.
In situ hybridization
Whole-mount in situ hybridization was performed as per standard protocol (44) using riboprobes against pdx1 (Saulium Sumanas, Cincinnati Children's Hospital Medical Center), islet1 (Steve Seredick, University of Oregon), neuroD (Marc Ekker, University of Ottawa), glucagon (Marianne Voz, University of Liege) and somatostatin (Wolfgang Driever, University of Freiburg). A minimum of 30 embryos were collected from three different injections and were analyzed for each probe.
alms1 MO validation
alms1 MO-injected embryos were harvested at 48 hpf, 5 dpf and 6 dpf. RNA was isolated using Trizol reagent (Life Technologies) and purified using the RNeasy kit (Qiagen) according to manufacturer's protocol. cDNA was generated (Fermentas First Strand cDNA transcription kit; Thermo Scientific) according to manufacturer's protocol and diluted 1:3. Specific primers encompassing exon 4 (F-5′ CCCCTGCAGAAACTCCTTGTC 3′, R-5′ TCATGCACTGACAGG TGGTG 3′) were used to perform PCR. Expected wild-type band size was 2446 bp. The splice-blocking MO was expected to produce a band of 528 bp. The agarose gel image is representative of three separate experiments.
Western blots
Pooled groups of 20 zebrafish embryos were homogenized in cold lysis buffer [250 mm sucrose, 4 mm ethylene diamine tetra acetic acid (EDTA), 100 mm NaCl, 10 mm Tris; pH 7.6, 0.1% Triton X-100], and protease inhibitors (Sigma). Cells were incubated in lysis buffer on ice for 15 min, vortexing every 5 min. Lysates were centrifuged at 9400g for 10 min. Supernatant was collected and protein concentrations were determined using BCA Assay (Pierce). Equal amount of proteins were incubated 1:1 in Laemmli sample buffer (BioRad) plus β-mercaptoethanol for 10 min and boiled for 5 min. Bbs1 and Bbs4 samples were run on a NuPage 4–12% Bis-Tris gel (Life Technologies) with 3-(N-morpholino) propane sulfonic acid running buffer (Life Technologies), Alms1 samples were run on a NuPage 3–8% Tris Acetate gel (Life Technologies) with Tris Acetate SDS running buffer (Life Technologies). Proteins were transferred onto a nitrocellulose membrane at 30 V for 90–120 min on ice. Membranes were blocked in 5% milk in tris-buffered saline (TBST) for 1 h at room temperature with rocking and were subsequently incubated overnight in primary antibody; washed the following day in TBST and incubated in secondary antibody. Blots were developed using ECL substrate (Pierce) using a FluorChemQ system and AlphaView Software. Respective blots were probed for detection of a Bbs1 band at 65 kDa, Bbs4 band at 58 kDa and Alms1 band at 231.55 kDa. Each blot was then stripped for detection of Actin (loading control; 42 kDa) using ReStore Western Blot Stripping Buffer (Thermo Scientific). The following primary antibodies and concentrations were used: Rabbit Anti-BBS1 (Santa Cruz Biotechnologies, 1:1000), Rabbit Anti-BBS4 (Sigma-Aldrich, 1:2000), Goat Anti-Alms1 (Abcam, 1:200) and Rabbit Anti-Actin (Sigma-Aldrich, 1:1500). The following secondary antibodies were used: anti-rabbit IgG HRP-linked (Cell Signaling Technology, 1:2500) and anti-goat IgG HRP-linked (Promega, 1:5000).
In vitro transcription and mRNA injection
bbs1 and bbs4 mRNA were transcribed using mMessage mMachine kit (Ambion). Fifty picograms of bbs1 RNA and 100 pg of bbs4 RNA were co-injected with respective morpholinos. The embryos were grown as previously described. Then, 5 dpf embryos from three separate injections were fixed in 4% PFA overnight and β-cell number was counted.
β-cell ablation study
Metronidazole was dissolved in embryo media by vigorous agitation. Control MO as well as alms1, bbs1 and bbs4 MO-injected 48 hpf embryos were incubated in 10 mm metronidazole for 48 h. At this time point, the β-cell mass was completely ablated. Embryos were then washed and transferred to normal embryo medium and cultured until 5 dpf. As a control, embryos developed in normal medium were used. β-cell number was counted at 5 dpf in both conditions from embryos collected from three separate experiments.
qRT-PCR
RNA was extracted using Isol-RNA Lysis Reagent (5 Prime) and purified using Qiagen RNeasy cleanup kit according to manufacturer's protocol. cDNA was transcribed using Fermentas First Strand cDNA Transcription Kit (Thermo Scientific) according to manufacturer's protocol. cDNA was diluted to 1:3. qRT-PCR was performed in duplicate using target-specific primers and LightCycler 480 SybrGreen (Roche) according to manufacturer's protocol on a LightCycler 480 machine (Roche). cDNA from three separate experiments were used for qRT-PCR. Reverse transcriptase free samples were used as negative controls. All samples were run in duplicate with CT value normalized to β-actin. Experiments were repeated at least three times.
Glucose expansion assay
Control and morphant 24 hpf Tg(insa:mCherry) embryos were transferred to embryo medium supplemented with 20 mm glucose and grown at 28°C until 5 dpf. Normal embryo medium without glucose was used as control. At 5 dpf, the β-cell number was assessed in embryos grown in high-glucose and control conditions. Three separate experiments were performed for all morpholinos except bbs4 TB, for which embryos grown in high glucose media were collected from four separate experiments to confirm the observed phenotype.
CRISPR design
Target sites for CRISPRs were determined by entering the sequence of the gene of interest at http://zifit.partners.org/ZiFiT/CSquare9Nuclease.aspx with the options 20 bp target site, T7 promoter and zebrafish selected. This identified all potential target sites within the sequence as well as off-target sites for each potential target site. Target sites were chosen based on location within the gene; target sites within early exons and with no off-target sites were preferred. For alms1, we identified a target site within exon 4 that matched these criteria. The alms1 target site in exon 4 was 5′-GGTCGTTTAATCGGAGCAGA-3′. For bbs1, we identified the target site within exon 2, which was 5′-GGTTGGCAACTGGGTCATAG-3′ and for bbs4 the target site is in exon 11; 5′-GGCCATGAACAAGTATCGTG-3′. Creation of the guide RNA oligos included incorporation of TAATACGACTCACTATA at the 5′ end of the target site and GTTTTAGAGCTAGAAATAGC at the 3′ end of the target site according to protocols kindly provided by Shawn Burgess (NIH). The ∼80 bp alms1 or bbs1 sgRNA oligos were annealed to a common oligo 2 (45). The sequence of oligo 2 was 5′-AAAAGCACCGACTCGGTGCCACTTTT TCAAGTTGATAACGGACTAGCCTTATTTTAACTTGCTATTTCTAGCTCTAAAAC-3′. The sgRNAs, at 25 pg/µl, along with Cas9 mRNA, at 300 pg/µl, were microinjected directly into the cell during the single-cell stage of embryonic development.
T7 endonuclease assay
CRISPR/Cas9 targeting efficiency was determined first by PCR amplification of the target site from genomic DNA isolated from pooled groups of 20 CRISPR injected embryos (F0) or their progenies (F1). For alms1 5′-GATTCACAGATGGATAC-3′and 5′-GTATGAGAGATGGTTTAG-3, for bbs1 5′-GCTGTGAAGAAAGATAA-3′ and 5′-CAGTAAGTAGTGTTAGC-3′ primer sets were used. Four hundred nanograms of the PCR product was then denatured at 95°C and re-annealed at a rate of −2°C/s down to 85°C followed by −0.1°C/s down to 25°C, in order to permit the formation of hetero duplex. Determining genome-targeting efficiency using T7 endonuclease I (New England BioLabs, Inc.) was carried out according to manufacturer's protocol. Then, 1 µl T7 endonuclease I was added and the sample was incubated at 37°C for 15 min before the reaction was stopped with 1.5 µl 0.25 M EDTA. The sample was visualized on a 2% agarose gel.
Quantification of glucose
Starting at 5 dpf, control or morphant larvae were fed one of two diets: AP100 (Zeigler) food only (control diet) or AP100 food supplemented with 40 mm glucose solution (high-glucose diet). Larvae were fed twice daily until 7 dpf at which point larvae (n = 50) were collected and utilized in the Biovision Inc. glucose assay. The protocol was carried out as recommended by the manufacturer. Samples and controls/standards were run in triplicates. Experiments were repeated three times. Absolute glucose levels were calculated as described in the manufacturer's protocol.
Statistical analysis
The Student t-test was performed as indicated. Bonferroni correction was utilized to adjust for multiple comparisons (at least four independent experiments in all cases).
Supplementary Material
Funding
This work was funded by NIDDK/NIH R01DK102001 (N.A.Z.) and by T32AG000219 (E.A.O.).
Supplementary Material
Acknowledgments
Conflict of Interest statement. None declared.
References
- 1.Krishnamurthy J., Ramsey M.R., Ligon K.L., Torrice C., Koh A., Bonner-Weir S., Sharpless N.E. (2006) p16(INK4a) induces an age-dependent decline in islet regenerative potential. Nature, 443, 453–457. [DOI] [PubMed] [Google Scholar]
- 2.Rosen E.D., Kulkarni R.N., Sarraf P., Ozcan U., Okada T., Hsu C.H., Eisenman D., Magnuson M.A., Gonzalez F.J., Kahn C.R. et al. (2003) Targeted elimination of peroxisome proliferator-activated receptor gamma in beta cells leads to abnormalities in islet mass without compromising glucose homeostasis. Mol. Cell Biol., 23, 7222–7229. [DOI] [PMC free article] [PubMed] [Google Scholar]
- 3.SosaPineda B., Chowdhury K., Torres M., Oliver G., Gruss P. (1997) The Pax4 gene is essential for differentiation of insulin-producing beta cells in the mammalian pancreas. Nature, 386, 399–402. [DOI] [PubMed] [Google Scholar]
- 4.Stoffers D.A., Ferrer J., Clarke W.L., Habener J.F. (1997) Early-onset type-II diabetes mellitus (MODY4) linked to IPF1. Nat. Genet., 17, 138–139. [DOI] [PubMed] [Google Scholar]
- 5.Stoffers D.A., Stanojevic V., Habener J.F. (1998) Insulin promoter factor-1 gene mutation linked to early-onset type 2 diabetes mellitus directs expression of a dominant negative isoprotein. J. Clin. Invest., 102, 232–241. [DOI] [PMC free article] [PubMed] [Google Scholar]
- 6.Yamagata K., Nammo T., Moriwaki M., Ihara A., Iizuka K., Yang Q., Satoh T., Li M., Uenaka R., Okita K. et al. (2002) Overexpression of dominant-negative mutant hepatocyte nuclear factor-1 alpha in pancreatic beta-cells causes abnormal islet architecture with decreased expression of E-cadherin, reduced beta-cell proliferation, and diabetes. Diabetes, 51, 114–123. [DOI] [PubMed] [Google Scholar]
- 7.Adams M., Smith U.M., Logan C.V., Johnson C.A. (2008) Recent advances in the molecular pathology, cell biology and genetics of ciliopathies. J. Med. Genet., 45, 257–267. [DOI] [PubMed] [Google Scholar]
- 8.Badano J.L., Mitsuma N., Beales P.L., Katsanis N (2006) The ciliopathies: an emerging class of human genetic disorders. Annu. Rev. Genomics Hum. Genet., 7, 125–148. [DOI] [PubMed] [Google Scholar]
- 9.Baker K., Beales P.L. (2009) Making sense of cilia in disease: the human cilioplathies. Am. J. Med. Genet. C Semin. Med. Genet., 151C, 281–295. [DOI] [PubMed] [Google Scholar]
- 10.Cardenas-Rodriguez M., Badano J.L. (2009) Ciliary biology: understanding the cellular and genetic basis of human cillopathies. Am. J. Med. Genet. C Semin. Med. Genet., 151C, 263–280. [DOI] [PubMed] [Google Scholar]
- 11.Muller J., Stoetzel C., Vincent M.C., Leitch C.C., Laurier V., Danse J.M., Helle S., Marion V., Bennouna-Greene V., Vicaire S. et al. (2010) Identification of 28 novel mutations in the Bardet–Biedl syndrome genes: the burden of private mutations in an extensively heterogeneous disease. Hum. Genet., 127, 583–593. [DOI] [PMC free article] [PubMed] [Google Scholar]
- 12.Bettini V., Maffei P., Pagano C., Romano S., Milan G., Favaretto F., Marshall J.D., Paisey R., Scolari F., Greggio N.A. et al. (2012) The progression from obesity to type 2 diabetes in Alstrom syndrome. Pediatr. Diabetes, 13, 59–67. [DOI] [PMC free article] [PubMed] [Google Scholar]
- 13.Forsythe E., Beales P.L. (2013) Bardet–Biedl syndrome. Eur. J. Hum. Genet., 21, 8–13. [DOI] [PMC free article] [PubMed] [Google Scholar]
- 14.Girard D., Petrovsky N. (2011) Alstrom syndrome: insights into the pathogenesis of metabolic disorders. Nat. Rev. Endocrinol., 7, 77–88. [DOI] [PubMed] [Google Scholar]
- 15.Beales P.L., Elcioglu N., Woolf A.S., Parker D., Flinter F.A. (1999) New criteria for improved diagnosis of Bardet–Biedl syndrome: results of a population survey. J. Med. Genet., 36, 437–446. [PMC free article] [PubMed] [Google Scholar]
- 16.Feuillan P.P., Ng D., Han J.C., Sapp J.C., Wetsch K., Spaulding E., Zheng Y.C., Caruso R.C., Brooks B.P., Johnston J.J. et al. (2011) Patients with Bardet–Biedl Syndrome have hyperleptinemia suggestive of leptin resistance. J. Clin. Endocrinol. Metab., 96, E528–E535. [DOI] [PMC free article] [PubMed] [Google Scholar]
- 17.Grace C., Beales P., Summerbell C., Jebb S.A., Wright A., Parker D., Kopelman P. (2003) Energy metabolism in Bardet–Biedl syndrome. Int. J. Obes. Relat. Metab. Disord., 27, 1319–1324. [DOI] [PubMed] [Google Scholar]
- 18.Marshall J.D., Bronson R.T., Collin G.B., Nordstrom A.D., Maffei P., Paisey R.B., Carey C., MacDermott S., Russell-Eggitt I., Shea S.E. et al. (2005) New Alstrom syndrome phenotypes based on the evaluation of 182 cases. Arch. Intern. Med., 165, 675–683. [DOI] [PubMed] [Google Scholar]
- 19.Marshall J.D., Maffei P., Collin G.B., Naggert J.K. (2011) Alstrom Syndrome: Genetics and Clinical Overview. Curr. Genomics, 12, 225–235. [DOI] [PMC free article] [PubMed] [Google Scholar]
- 20.Minton J.A.L., Owen K.R., Ricketts C.J., Crabtree N., Shaikh G., Ehtisham S., Porter J.R., Carey C., Hodge D., Paisey R. et al. (2006) Syndromic obesity and diabetes: changes in body composition with age and mutation analysis of ALMS1 in 12 United Kingdom kindreds with Alstrom syndrome. J. Clin. Endocrinol. Metab., 91, 3110–3116. [DOI] [PubMed] [Google Scholar]
- 21.Argenton F., Zecchin E., Bortolussi M. (1999) Early appearance of pancreatic hormone-expressing cells in the zebrafish embryo. Mech. Dev., 87, 217–221. [DOI] [PubMed] [Google Scholar]
- 22.Biemar F., Argenton F., Schmidtke R., Epperlein S., Peers B., Driever W. (2001) Pancreas development in zebrafish: early dispersed appearance of endocrine hormone expressing cells and their convergence to form the definitive islet. Dev. Biol., 230, 189–203. [DOI] [PubMed] [Google Scholar]
- 23.Lin J.W., Biankin A.V., Horb M.E., Ghosh B., Prasad N.B., Yee N.S., Park M.A., Leach S.D. (2004) Differential requirement for ptf1a in endocrine and exocrine lineages of developing zebrafish pancreas. Dev. Biol., 270, 474–486. [DOI] [PubMed] [Google Scholar]
- 24.Yee N.S., Yusuff S., Pack M. (2001) Zebrafish pdx1 morphant displays defects in pancreas development and digestive organ chirality, and potentially identifies a multipotent pancreas progenitor cell. Genesis, 30, 137–140. [DOI] [PubMed] [Google Scholar]
- 25.Zecchin E., Mavropoulos A., Devos N., Filippi A., Tiso N., Meyer D., Peers B., Bortolussi M., Argenton F. (2004) Evolutionary conserved role of ptf1a in the specification of exocrine pancreatic fates. Dev. Biol., 268, 174–184. [DOI] [PubMed] [Google Scholar]
- 26.Leitch C.C., Lodh S., Prieto-Echaguee V., Badano J.L., Zaghloul N.A. (2014) Basal body proteins regulate Notch signaling through endosomal trafficking. J. Cell Sci., 127, 2407–2419. [DOI] [PMC free article] [PubMed] [Google Scholar]
- 27.Pisharath H., Rhee J.M., Swanson M.A., Leach S.D., Parsons M.J. (2007) Targeted ablation of beta cells in the embryonic zebrafish pancreas using E. coli nitroreductase. Mech. Dev., 124, 218–229. [DOI] [PMC free article] [PubMed] [Google Scholar]
- 28.Tiso N., Moro E., Argenton F. (2009) Zebrafish pancreas development. Mol. Cell. Endocrinol., 312, 24–30. [DOI] [PubMed] [Google Scholar]
- 29.Parsons M.J., Pisharath H., Yusuff S., Moore J.C., Siekmann A.F., Lawson N., Leach S.D. (2009) Notch-responsive cells initiate the secondary transition in larval zebrafish pancreas. Mech. Dev., 126, 898–912. [DOI] [PMC free article] [PubMed] [Google Scholar]
- 30.Robu M.E., Larson J.D., Nasevicius A., Beiraghi S., Brenner C., Farber S.A., Ekker S.C. (2007) p53 activation by knockdown technologies. PLoS Genet., 3, 787–801. [DOI] [PMC free article] [PubMed] [Google Scholar]
- 31.Hwang W.Y., Fu Y., Reyon D., Maeder M.L., Tsai S.Q., Sander J.D., Peterson R.T., Yeh J.R.J., Joung J.K. (2013) Efficient genome editing in zebrafish using a CRISPR-Cas system. Nat. Biotechnol., 31, 227–229. [DOI] [PMC free article] [PubMed] [Google Scholar]
- 32.Hwang W.Y., Fu Y., Reyon D., Maeder M.L., Tsai S.Q., Sander J.D., Peterson R.T., Yeh J.R.J., Joung J.K. (2013) Efficient in vivo genome editing using RNA-guided nucleases. Nat. Biotechnol., 31, 227–229. [DOI] [PMC free article] [PubMed] [Google Scholar]
- 33.Maddison L.A., Chen W. (2012) Nutrient excess stimulates beta-cell neogenesis in zebrafish. Diabetes, 61, 2517–2524. [DOI] [PMC free article] [PubMed] [Google Scholar]
- 34.Lee B.H., Liu J., Wong D., Srinivasan S., Ashrafi K. (2011) Hyperactive neuroendocrine secretion causes size, feeding, and metabolic defects of C. elegans Bardet–Biedl syndrome mutants. PLoS Biol., 9, e1001219. [DOI] [PMC free article] [PubMed] [Google Scholar]
- 35.Gerdes J.M., Christou-Savina S., Xiong Y., Moede T., Moruzzi N., Karlsson-Edlund P., Leibiger B., Leibiger I.B., Ostenson C.-G., Beales P.L. et al. (2014) Ciliary dysfunction impairs beta-cell insulin secretion and promotes development of type 2 diabetes in rodents. Nat. Commun., 5, doi:10.1038/ncomms6308. [DOI] [PubMed] [Google Scholar]
- 36.Meier J.J., Bonadonna R.C. (2013) Role of reduced beta-cell mass versus impaired beta-cell function in the pathogenesis of type 2 diabetes. Diabetes Care, 36, S113–S119. [DOI] [PMC free article] [PubMed] [Google Scholar]
- 37.Gerdes J.M., Liu Y., Zaghloul N.A., Leitch C.C., Lawson S.S., Kato M., Beachy P.A., Beales P.L., Demartino G.N., Fisher S. et al. (2007) Disruption of the basal body compromises proteasomal function and perturbs intracellular Wnt response. Nat. Genet., 39, 1350–1360. [DOI] [PubMed] [Google Scholar]
- 38.Goetz S.C., Anderson K.V. (2010) The primary cilium: a signalling centre during vertebrate development. Nat. Rev. Genet., 11, 331–344. [DOI] [PMC free article] [PubMed] [Google Scholar]
- 39.Ocbina P., Anderson K. (2008) Intraflagellar transport, cilia, and mammalian Hedgehog signaling: analysis in mouse embryonic fibroblasts. Dev. Dyn., 237, 2030–2038. [DOI] [PMC free article] [PubMed] [Google Scholar]
- 40.Rohatgi R., Milenkovic L., Scott M. (2007) Patched1 regulates hedgehog signaling at the primary cilium. Science, 317, 372–376. [DOI] [PubMed] [Google Scholar]
- 41.Boehlke C., Kotsis F., Patel V., Braeg S., Voelker H., Bredt S., Beyer T., Janusch H., Hamann C., Goedel M. et al. (2010) Primary cilia regulate mTORC1 activity and cell size through Lkb1. Nat. Cell Biol., 12, 1115.–. [DOI] [PMC free article] [PubMed] [Google Scholar]
- 42.Granot Z., Swisa A., Magenheim J., Stolovich-Rain M., Fujimoto W., Manduchi E., Miki T., Lennerz J.K., Stoeckert C.J. Jr, Meyuhas O. et al. (2009) LKB1 regulates pancreatic beta cell size, polarity, and function. Cell Metab., 10, 296–308. [DOI] [PMC free article] [PubMed] [Google Scholar]
- 43.Zhu D., Shi S., Wang H., Liao K. (2009) Growth arrest induces primary-cilium formation and sensitizes IGF-1-receptor signaling during differentiation induction of 3T3-L1 preadipocytes. J. Cell Sci., 122, 2760–2768. [DOI] [PubMed] [Google Scholar]
- 44.Thisse C., Thisse B. (2008) High-resolution in situ hybridization to whole-mount zebrafish embryos. Nat. Protoc., 3, 59–69. [DOI] [PubMed] [Google Scholar]
- 45.Varshney G.K., Pei W., LaFave M.C., Idol J., Xu L., Gallardo V., Carrington B., Bishop K., Jones M., Li M. et al. (2015) High-throughput gene targeting and phenotyping in zebrafish using CRISPR/Cas9. Genome Res., 25, 1030–1042. [DOI] [PMC free article] [PubMed] [Google Scholar]
Associated Data
This section collects any data citations, data availability statements, or supplementary materials included in this article.