Introduction
Mammography quality is a significant issue of national concern. The Mammography Quality Standards Act (MQSA) extends regulation to an unprecedented level of detail in the practice of medicine; however, the Act pertains to the technical quality of mammography and is largely silent on the critical issue of the radiologist’s proficiency in interpreting examination results.
The reason that no measure of radiologist proficiency is required may be partly because radiologists often do not know whether a patient whose mammogram they interpreted received a diagnosis of cancer months or years later or lived a long, cancer-free life. Kaiser Permanente (KP), with its well-established databases of patient information, is unique in its ability to monitor and track patient outcome.
Of 370,000 members in the KP Colorado Region, approximately 101,000 are women who are eligible for mammography. For these women, breast cancer is a leading cause of cancer-related deaths. During the past five years, KP Colorado has averaged more than 80% penetration for screening mammography by Health Employer Data Information Set (HEDIS) criteria. However, internal quality audits in late 1995 indicated that breast cancer detectable on mammograms was sometimes being missed.
In 1996, KP Colorado began to implement a multi-faceted initiative to reduce variation and improve accuracy in the interpretation of mammograms. The initiative was conceived and sustained by the radiology leadership team, including staff from Health Plan and medical groups, with extensive sponsorship from Kaiser Foundation Health Plan and Operations. The integrity of vision among top management and the radiology department informed an organizational team spirit that fueled this initiative from its inception. The initiative team members are listed in Table 1.
Table 1.
Initiative to Improve Mammogram Interpretation team members
Leader:
|
Team members:
|
The project consisted of organizational redesign, quality improvement, and performance management and reflected many innovations in health care delivery, patient safety, continuous quality improvement, and development of subspecialty practice in radiology.
The objective of this initiative was to maximize the number of cancerous lesions detected at an early, curable stage by achieving industry-leading performance in mammographic diagnosis of breast cancer. To achieve this objective, we investigated three issues: reasons for differing levels of performance among radiologists interpreting mammograms; the potential for improvement and barriers to realizing this potential; and innovations that result in sustained improvement in performance.
Initiative to Improve Mammogram Interpretation
This initiative consisted of a series of fundamental changes in the radiology department. These changes included instituting a comprehensive quality assessment program, creating a centralized facility for reading mammograms, and establishing mammography interpretation as a radiology subspecialty.
Quality Assessment Program Measures
On January 1, 1996, the comprehensive quality assessment program for mammogram interpretation was established. Multiple quality measures were—and continue to be—continuously monitored, and data were compared with published benchmarks and with goals of group performance and individual variation as defined early in the project by initiative team members (Table 2).1–8 Radiologists received feedback on group results and on their individual results. Performance gaps were analyzed, specific interventions were applied when necessary, and results of the interventions were measured. Where persistent gaps existed, additional improvement activities were instituted.
Table 2.
Quality measures used in Initiative to Improve Mammogram Interpretation
| Quality measure | Goal | Benchmark |
|---|---|---|
| Proportion of cancers detected at stage 0 or 1 | 80% in 1998 85% by 2003 |
80%1 |
| Sensitivity | 80% | 73%1 |
| Cancers diagnosed per 1000 mammograms | >6 | 62 |
| Diagnosis of new, probably benign lesion | 7% in 1998 4% by 2003 |
5%3 |
| Recall rate for screening mammograms | ≤7%a | 8.3%1 |
| Positive predictive value | 25–40%a | 23–534–6 |
| Annual number of mammograms read per radiologist | >4000 | 4807 36008 |
| Cost per mammogram per relative value unit | ≤ Medicare rate | Medicare b 120–160% c |
| Radiologist satisfaction | >90% | 89.25%d |
Measures of individual variation are applied. Generally, interventions are conducted when variation exceeds 2 SD.
The 2003 Medicare reimbursement rate, applying the KP Colorado geographic practice cost index (GCPI), is $36.42.
Prevailing community commercial reimbursement rate, per KP Colorado External Medical Services Department.
As an average of the four indicators of overall physician satisfaction assessed in the Colorado Permanente Medical Group physician satisfaction survey.
All of the data pertaining to performance were accumulated from raw data derived from the KP Colorado Tumor Registry, from reports of mammogram results (supplemented by chart review), and from Radiology Information System extracts, which were supplemented by review of handwritten records. Kim Adcock, MD, compiled data on sensitivity and stage at diagnosis; and Richard Batts, MD, compiled data on other mammographic indicators. Data were entered into one primary database. The primary database also contained the records of 3742 patients who received a diagnosis of breast cancer from among approximately 400,000 patients who had mammography at KP Colorado from 1993 through 2002. For each case of breast cancer, patient demographics and the stage, nodal status, mammographic diagnosis, and date of diagnosis were recorded. Clearly distinct synchronous lesions were recorded separately. The dataset that was used in analyses included records of all cases of breast cancer diagnosed in KP Colorado from 1993 through 2002.
Our quality assessment analysis focused on the contribution of radiologist proficiency in interpreting mammograms to the overall effectiveness of using mammography for screening. To better assess the radiologists’ contribution in isolation from potential confounders, we first evaluated the influence of patient factors (such as overall penetration of screening, screening interval, and patient age) and technical factors (such as quality of mammography at different facilities) and found little or no influence from these factors. The mammography penetration rate (by HEDIS criteria) varied between 80% and 81% for commercial members and between 81% and 83% for Medicare enrollees, and the proportion of Medicare members in the patient population was stable. A moderate trend was seen during the project for patients to elect earlier screening and to have annual instead of biannual mammography; however, this group of patients constituted a small proportion of overall mammography volume and had a negligible influence on the aggregate performance data. Moreover, radiologist proficiency will appear worse when younger women have mammography more frequently, because this age group has increased breast density, lower prevalence of disease, and more aggressive tumors (and thus more interval cancers). Technical performance was consistent, as assessed by the MQSA inspectors, and no major deficiencies were detected at any mammography facilities throughout the project period.
We defined and held constant throughout the reporting period the criteria for positives and negatives used to calculate sensitivity and positive predictive value. For example, one criterion used to help define a false negative case was a diagnosis of breast cancer made within 365 days (inclusive) after a negative mammogram interpretation. Our processes and conventions for recording data also were the same throughout the reporting period.
Centralized Facility
In 1998, the radiology department consolidated multiple medical office practices into a single central reading facility and instituted standardized practices with respect to every facet of interpreting mammograms.
Radiologist Subspecialization
Before 1998, each of the 21 radiologists in the region interpreted mammograms; some radiologists interpreted as few as 40 mammograms per month, the minimum required by the MQSA.7 During 1998, radiologists who chose to specialize in interpreting mammograms used the centralized facility, where they had access to specialized training, convenient consultation with other radiologists expert at reading mammograms, and exposure to a high volume of mammograms.
Also in 1998, we established mandatory, three-times-per-year mammogram interpretation self-assessment exercises for the subspecialists, exercises that challenge the radiologists to continually assess and improve their mammogram interpretation skills. For each exercise, the department’s clinical mammography specialist (Sheila Duvall), with input from one of the mammogram subspecialist radiologists on rotating assignment, selected mammograms considered within normal limits and mammograms of patients whose breast cancer had been confirmed by histopathologic testing. Typically, the selected mammograms from cancer cases had radiographically subtle changes and included a variety of findings, such as microcalcification, asymmetry, or architectural distortion. Each exercise consisted of three rounds of mammogram interpretation. During the first round, mammograms that had been taken one to two years before cancer was diagnosed were mounted on an x-ray alternator and were randomly mixed with normal mammograms. Each radiologist completed a written assessment and specified the type and location of suspicious findings, if any. The second round consisted of comparing of a patient’s most recent mammogram with that of one year earlier; again, normal and confirmed cancer cases were randomly intermixed. For the third round, the radiologists received the diagnosis for each case and their own written first-and second-round assessments. Periodically, the mammography clinical specialist returned to each radiologist a summary of his or her performance compared with the group performance data. Because this process was oriented toward self-assessment and learning, little emphasis was placed on applying this information to individual performance management. For example, the information was not used in the radiologist’s annual performance appraisal, because evidence shows that test case series do not predict performance in the clinical setting.9 Each set of cases assessed was certified for 2.5 hours of American Medical Association category 1 continuing medical education credit, and the exercise was available to radiologists from local private practice groups, who participated intermittently.
Results
Earlier-Stage Breast Cancer Detection
The proportion of patients who will attain five-year disease-free status declines by approximately 40% after breast cancer has reached late stage.10 Therefore, the ultimate goal of screening mammography is detection of early stage disease, and therefore, this quality measure of radiologist performance is of paramount importance.
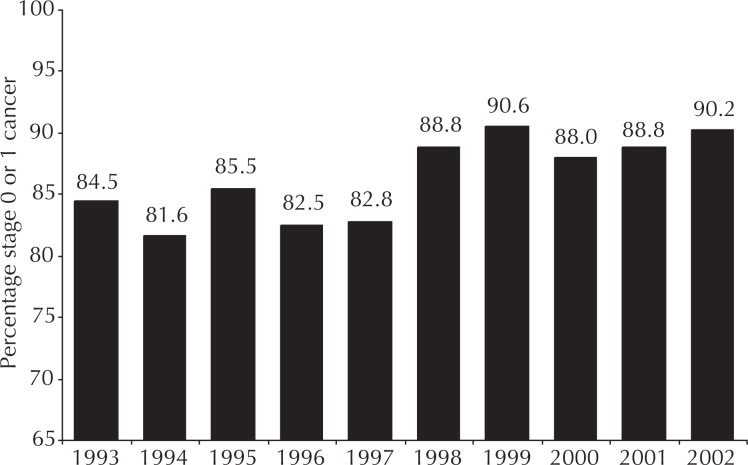
Early-stage cancer detection was measured as the proportion of tumors that were detected while at stage 0 or 1. This measure is not solely associated with the radiologist’s interpretive skill: Changing patterns of population penetration of screening and of clinician proficiency in breast examination could profoundly influence early-detection data. However, these potential confounders were stable during this project; therefore, these data specifically measured change in radiologist proficiency. The baseline performance of the group exceeded published standards through 1997 (Figure 1). With the completion of mammography specialization by 1998, however, the group achieved sustained early-stage cancer detection level of nearly 90%, a substantial improvement that exceeded published benchmark values by 10%.
Figure 1.
Group performance results for diagnosing breast cancer lesions at stage 0 or 1 (early lesions).
Increased Sensitivity of Mammography
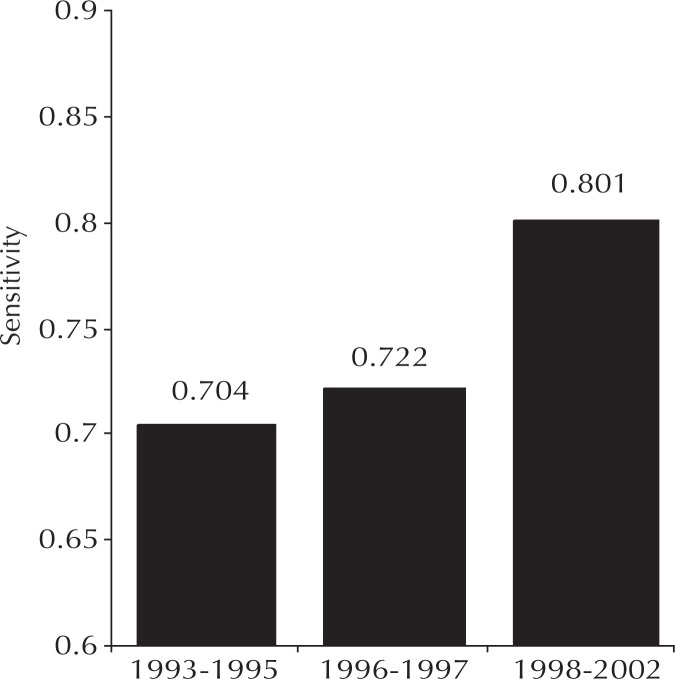
Sensitivity is the number of true positive diagnoses divided by the total number of patients with breast cancer. Sensitivity values vary with data definitions and conventions, and no uniform method for calculating mammography sensitivity is currently in use across the industry. The published details on conventions used in the New Hampshire trial1 are virtually identical to those we used at KP Colorado; therefore, the New Hampshire results provided excellent benchmarks. Performance data from KP Colorado was statistically indistinguishable from the broad, community-based New Hampshire data until specialization and self-learning were implemented in 1998 (Figure 2). A statistically significant, durable improvement then occurred—resulting in sensitivity levels not achieved elsewhere—and represented the effects of our performance management interventions.
Figure 2.
Sensitivity for detecting breast cancer by using screening mammography.
Controlled Variation in Cancer Detection Rate
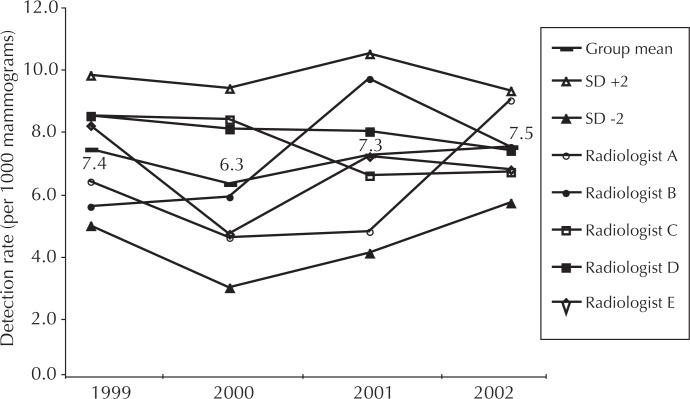
Detection rate is calculated as the number of cases of cancers detected per 1000 mammograms read. The relatively high group mean detection rate, which ranged from 6.3 in 2000 to 7.5 in 2002, is partially attributable to the combination of diagnostic and screening studies in the data (Figure 3). Individual radiologist performance is not statistically different across the group. The decrease in the spread of the standard deviation (SD) indicates a trend toward controlled interobserver variation.
Figure 3.
Trend in cancer lesions detected per 1000 mammograms interpreted.
Normalized Rate of Diagnosing New, Probably Benign Lesions
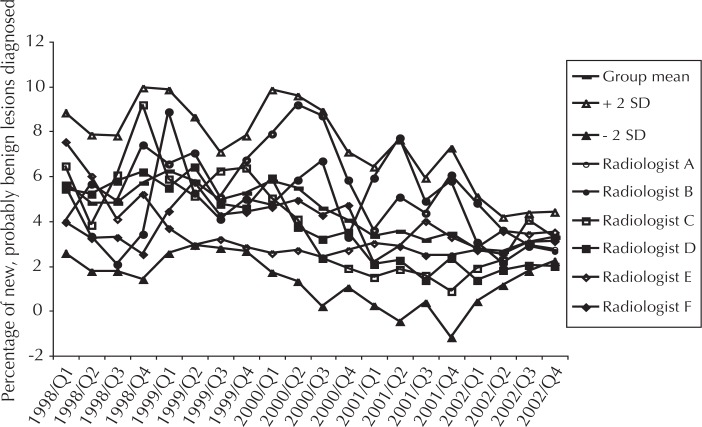
This locally developed indicator is calculated as the proportion of mammograms a radiologist interprets as showing a new lesion (ie, no earlier mammogram with abnormal result), that is probably benign; this indicator is an early warning sign of vacillating diagnostic criteria. An intervention is conducted when a radiologist deviates significantly from group performance. For example, in early 2002, radiologist “B” diagnosed new, probably benign lesions too frequently, so we instituted a requirement that this radiologist secure a second opinion on any case for which this diagnosis was contemplated. Radiologist B’s rate has normalized over time (Figure 4). The average rate of diagnosing new, probably benign lesions declined as did the variation in rate among radiologists.
Figure 4.
Percentage of mammograms with changes interpreted as new, probably benign lesions.
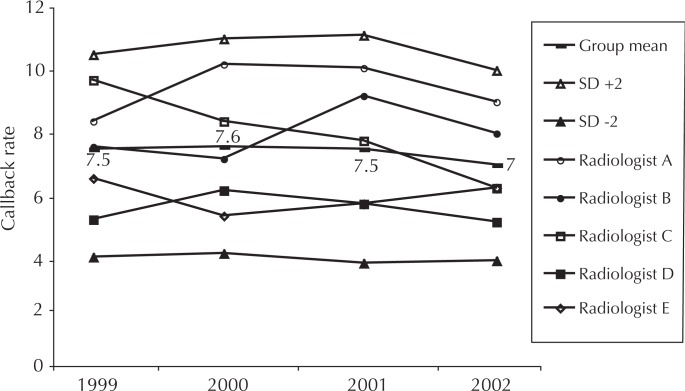
Normalized Callback Rate
Patients are commonly recalled for additional views when the screening mammogram result is inconclusive or shows findings potentially indicative of cancer. Such callbacks produce great patient anxiety, consume limited resources, and expose the patient to additional radiation. Evidence generally shows that callback rates above 7% are not justified by improved cancer detection rates;11 however, the New Hampshire1 experience showed a rate of 8.3% across multiple practices. In KP Colorado, both group and individual performance are monitored relative to a goal of 7% (Figure 5). When a radiologist exceeds two SD for any quarter, s/he must gain the concurrence of another physician for any proposed recall. After using this simple intervention, we saw rapid normalization of rates in every case.
Figure 5.
Percentage of mammograms with results that generate callback.
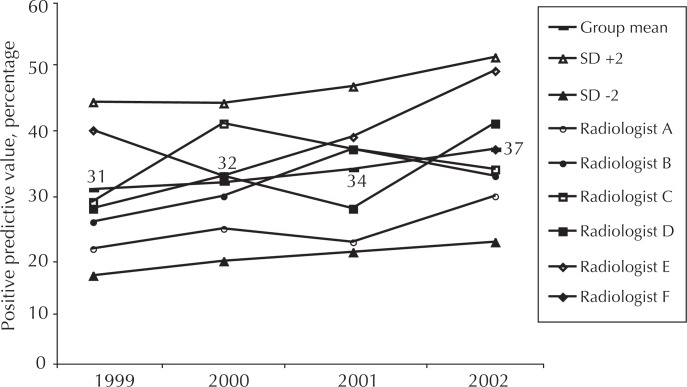
Normalized Positive Predictive Value
The positive predictive value (PPV) is the proportion of patients for whom the radiologist recommends biopsy who then receive a confirmed diagnosis of cancer. In addition to the rate of diagnosing new, probably benign lesions and the callback rate, PPV is an important measure which tracks consistency of the physician’s diagnostic criteria. High PPVs indicate an overly stringent threshold for biopsy and lead to decreased sensitivity for cancer. Low PPV subjects too many patients to the anxiety and discomfort of a breast biopsy. There is no generally accepted range of “correct” PPV: Review of the literature reveals a wide range of reported values. Careful, radiologist-specific analysis of PPVs in the context of the other indicators is necessary to understand whether the radiologist should adjust his or her diagnostic criteria. Feedback of data has effectively normalized individual radiologists’ performance (Figure 6).
Figure 6.
Positive predictive value of screening mammography.
Radiologist Subspecialization and High Satisfaction
By the end of 1998, the radiologists had specialized, limiting the interpretation of mammograms to a subgroup with proven high performance, and read, on average, 6000 to 7000 studies annually. Throughout the project, the range of mammograms read was 4000 to 14,000 mammograms per radiologist per year and the group average was 8000 mammograms per year by 2002. The number of mammograms read by radiologists comfortably exceeded minimums set by the MQSA, but at the upper levels remained within community standards for mammography specialists.
Although the quality improvement activities concentrated on systems improvement and self-learning, certain intractable performance issues were encountered which necessitated withdrawal of privileges for four radiologists over eight years.
Radiologist satisfaction averaged 91.5% for the overall measures included on the Colorado Permanente Medical Group (CPMG) survey. In anonymous response to the question: “If I had the opportunity to choose again, I would join CPMG,” all 15 of the respondents (of 16 radiologists) agreed or strongly agreed. Survey responses from mammography subspecialists could not be separated from those of other radiologists.
Decreased Costs
The net cost of $40,000 per year for this project was calculated by using payroll costs of the following personnel (number in parenthesis is proportion of full-time equivalent [FTE]): radiologist (0.1 FTE), clinical mammography specialist (0.1 FTE), and administrative assistant (0.05 FTE). Nonpayroll costs were negligible.
Relative value unit costs are assigned separately to the professional and technical components of all government and most commercial service contracts: During our study period, the cost of the professional component relative value unit for each mammogram at KP Colorado declined by 45% and is now approximately $28, or 77% of the Medicare benchmark. In addition, the improved process efficiency of mammogram interpretation generated net savings of more than $3 million during the past seven years.
Discussion
This project builds on the foundation of two unique characteristics of KP—excellent patient information and a performance culture—to produce results that surpassed benchmarks for preventing breast cancer deaths. By implementing a multifaceted initiative to improve interpretation of mammograms, we substantially increased the sensitivity of screening mammography as we diagnosed more cases of cancers at earlier stages without increasing the proportion of callbacks. Simultaneously, we decreased the professional component cost per mammogram. Radiologist satisfaction remains high.
Biostatistician Dr Constantine Gatsonis of Brown University and Dr Robert Smith of the American Cancer Society reviewed the results of the indicators of mammographic sensitivity and stage of cancer at detection at the request of The New York Times. They independently concluded that the increase in sensitivity for cancer detection and the higher proportion of early stage breast cancer represented statistically significant changes.
Results of this program have been described in the popular press:
“[The Colorado team] is missing one-third fewer [breast] cancers and has achieved what experts say is nearly as high a level of accuracy as mammography can offer.”12
“Every mammography program in the country should be doing something like this.”13
“…the Kaiser mammography group has gone perhaps as far as anyone in creating a statistical system for holding doctors accountable for their work.”12
“Everybody would like to do this if they could. It is a wonderful learning experience.”14
“Even at the nation’s leading cancer centers, doctors say they cannot do what the [Colorado team] has done.”12
To the best of our knowledge, this project was unique in its rigorous assessment of radiologist function in breast cancer detection and in applying quality improvement and performance management techniques to improve cancer detection. The project also resulted in excellent levels of detecting early-stage breast cancer.
Acknowledgments
Dave St Pierre, MHROD, consulted with the author on organization of the Vohs Award application content.
Biography
Kim A Adcock, MD, is the Associate Medical Director for Business Development and Risk Management for the Colorado Permanente Medical Group, and has been the Regional Department Chief of Radiology for the past eight years. E-mail: kim.a.adcock@kp.org.

Group Practice
In group practice, there is built-in quality control in the careful choice of doctors, and in the sharing of patients and knowledge. In addition, in our group, each service has a chief of service and a nucleus of senior doctors who work with other clinicians and share their patients’ medical problems.
—Ray Kay, founding Medical Director of the Southern California Medical Group. This “Moment in History” quote collected by Steve Gilford, KP Historian
References
- 1.Poplack SP, Tosteson AN, Grove MR, Wells WA, Carney PA. Mammography in 53,803 women from the New Hampshire mammography network. Radiology. 2000 Dec;217(3):832–40. doi: 10.1148/radiology.217.3.r00dc33832. [DOI] [PubMed] [Google Scholar]
- 2.Sickles EA, Wolverton DE, Dee KE. Performance parameters for screening and diagnostic mammography: specialist and general radiologists. Radiology. 2002 Sep;224(3):861–9. doi: 10.1148/radiol.2243011482. [DOI] [PubMed] [Google Scholar]
- 3.Yasmeen S, Romano PS, Petinger M, et al. Frequency and predictive value of a mammographic recommendation for short-interval follow-up. J Natl Cancer Inst. 2003 Mar 19;95(6):429–36. doi: 10.1093/jnci/95.6.429. [DOI] [PubMed] [Google Scholar]
- 4.Burrell HC, Pinder SE, Wilson AR, et al. The positive predictive value of mammographic signs: review of 425 non-palpable breast lesions. Clin Radiol. 1996 Apr;51(4):277–81. doi: 10.1016/s0009-9260(96)80346-1. [DOI] [PubMed] [Google Scholar]
- 5.Lacquement MA, Mitchell D, Hollingsworth AB. Positive predictive value of the Breast Imaging Reporting and Data System. J Am Coll Surg. 1999 Jul;189(1):34–40. doi: 10.1016/s1072-7515(99)00080-0. [DOI] [PubMed] [Google Scholar]
- 6.Orel SG, Kay N, Reynolds C, Sullivan DC. BI-RADS categorization as a predictor of malignancy. Radiology. 1999 Jun;211(3):845–50. doi: 10.1148/radiology.211.3.r99jn31845. [DOI] [PubMed] [Google Scholar]
- 7.US Food Drug Administration Mammography Quality Standards Regulations. Part 900, Mammography. Subpart B, Quality standards and certification. Sec 900.12, Quality standards: a, 1, ii, A. Available from: www.fda.gov/cdrh/mammography/frmamcom2.html#s90012 (accessed March 2, 2004)
- 8.Esserman L, Cowley H, Eberle C, et al. Improving accuracy of mammography: volume and outcome relationships. J Natl Cancer Inst. 2002 Mar 6;94(5):369–75. doi: 10.1093/jnci/94.5.369. [DOI] [PubMed] [Google Scholar]
- 9.Rutter CM, Taplin S. Assessing mammographers’ accuracy. A comparison of clinical and test performance. J Clin Epidemiol. 2000 May;53(5):443–50. doi: 10.1016/s0895-4356(99)00218-8. [DOI] [PubMed] [Google Scholar]
- 10.Olivotto IA, Truong PT, Speers CH. Staging reclassification affects breast cancer survival. J Clin Oncol. 2003 Dec 1;21(23):4467–8. doi: 10.1200/JCO.2003.99.217. [DOI] [PubMed] [Google Scholar]
- 11.Smith-Bindman R, Chu PW, Miglioretti DL, et al. Comparison of screening mammography in the United States and the United Kingdom [published erratum appears in JAMA 2004 Feb 18;291(7):824] JAMA. 2003 Oct 22;290(16):2129–37. doi: 10.1001/jama.290.16.2129. [DOI] [PubMed] [Google Scholar]
- 12.Moss M. Mammogram team learns from its errors. New York Times. 2002 Jun 28;Sect. A:1. (col 2). [Google Scholar]
- 13.Robert Smith., MD Chief of Cancer Screening, American Cancer Society, as quoted in: Moss M. Mammogram team learns from its errors. New York Times. 2002 Jun 28;Sect A:1. (col 2) [Google Scholar]
- 14.David Dershaw., MD Chief of Mammography at the Memorial Sloan-Kettering Cancer Center, as quoted in: Moss M Mammogram team learns from its errors. New York Times. 2002 Jun 28;Sect. A:1. (col 2) [Google Scholar]


