

Abstract
Endocrine disrupting compounds (EDCs) are hypothesized to promote obesity and early puberty but their interactive effects with hormonally active diets are poorly understood. Here we assessed individual and combinatorial effects of soy diet or the isoflavone genistein (GEN; administered as the aglycone genistin GIN) with bisphenol A (BPA) on body weight, ingestive behavior and female puberal onset in Wistar rats. Soy-fed dams gained less weight during pregnancy and, although they consumed more than dams on a soy-free diet during lactation, did not become heavier. Their offspring (both sexes), however, became significantly heavier (more pronounced in males) pre-weaning. Soy also enhanced food intake and accelerated female pubertal onset in the offspring. Notably, pubertal onset was also advanced in females placed on soy diet at weaning. Males exposed to BPA plus soy diet, but not BPA alone, had lighter testes. BPA had no independent effects.
Keywords: Endocrine disruption, Genistein, Phytoestrogens, Behavior, Sexually dimorphic, Obesogen, Body weight, Metabolic
1. Introduction
Human exposure to endocrine disrupting compounds (EDCs) is ubiquitous, and accumulating evidence suggests that increasing incidence of endocrine disorders may be related, at least in part, to these xenobiotic chemical contaminants [1–4]. Recently, it has been hypothesized that some EDCs can promote persistent weight gain [5–8] consequently heightening risk of obesity and related metabolic co-morbidities (particularly if exposure occurs during development). Alternatively, early life weight gain could signify accelerated growth and maturation. Rapid peripubertal weight gain that normalizes in adulthood accompanied by advanced pubertal onset would be consistent with this view. A variety of anthropogenic and naturally occurring EDCs have been shown to accelerate pubertal onset and increase body weight in a variety of animal models but concurrent information about food intake by the exposed dam or the affected offspring is limited. Moreover, “real world” exposure occurs as low dose mixtures under a wide range of dietary conditions, and there is a paucity of data regarding the effects of co-exposure to EDCs with similar modes of action, particularly in a dose range considered environmentally relevant. Finally, sex differences in vulnerability and post-exposure phenotype remain poorly explored. Here we examined the impact of the plastics component bisphenol A (BPA) on growth and pubertal onset under two dietary conditions: soy rich and soy free.
Predisposition to diet-induced obesity following prenatal nutrient restriction is known to be sexually dimorphic (males more vulnerable than females) as is age at pubertal development (girls develop earlier than boys) and facets of “catch-up growth” [9,10] suggesting EDC effects on maturation are likely sex specific. Advanced female puberty, for example, has been associated with developmental EDC exposure in animal models and humans, including BPA and soy phytoestrogens [11–15]. Thus impacts on maturational timing by EDCs can also be sex specific. The neuroendocrine pathways underlying growth, energy balance, and reproductive maturation are sexually dimorphic, organized via hormone-sensitive developmental critical periods, and overlapping [16–18] supporting the hypothesis that growth and pubertal maturation may be simultaneously impacted by EDCs.
BPA is a common component of numerous household products including polycarbonate plastics, the epoxy linings of canned foods, thermal paper receipts, dental sealants and plastic water pipes [19–22]. BPA exposure is low but frequent; thus nearly all Americans have quantifiable urine levels, with children typically having higher body burdens than adults [23–25]. Although long considered weakly estrogenic [26], the specific mechanisms by which BPA interacts with molecular and cellular targets are not yet comprehensively established [27] and the potential health impacts of BPA exposure remain controversial [28–32]. BPA has been identified as a potential obesogen [33,34] but elevated weight gain and adiposity has not been consistently observed in all laboratory animal studies [35] nor universally associated with weight gain in humans [36,37]. Diet may be one factor contributing to this lack of consistency across studies.
Phytoestrogens are non-steroidal estrogenic compounds produced by plants, most notably legumes and thus abundant in soy-based foods and animal chows. Human exposure is primarily via consumption of soy-based and soy-supplemented foods such as tofu, tempeh, cereals, processed meats, protein-enhanced granola bars, soy milk and soy-based infant formula [14]. Increased use of soy in processed foods [38] translates to rapidly elevating global consumption rates. Soy-based foods contain a complex mixture of phytoestrogens, many of which are hormonally active, but the most intensively studied of these is the isoflavone genistein (GEN). Phytoestrogens such as GEN have long been recognized to interact with the mammalian endocrine system [39–41] and, like BPA, estrogenic activity has historically been identified as their primary mode of action [42]. There are conflicting viewpoints on whether GEN or other soy phytoestrogens are obesogenic [43] or the opposite, and might counteract aspects of metabolic syndrome [44]. Results from available rodent studies are discordant but reveal evidence of dose and sexually dimorphic effects (including sex specific rates of GEN metabolism [45]) suggesting that weight-related effects of GEN may vary with sex, age, and hormonal status [45–48].
Interactions between GEN and BPA have been reported for several endocrine endpoints supporting the hypothesis that they may also interact to influence aspects of growth, weight gain and puberty. For example, GEN has been shown to counteract the hypomethylating action of BPA on the Avy gene in agouti mice [49]. We recently showed that a soy-rich diet can obfuscate the anxiogenic phenotype induced by developmental BPA exposure [50], and a soy-rich diet has also been shown to modulate BPA-related effects on meiotic processes in the periovulatory oocyte [51]. While the mechanisms by which these interactions occur remain unclear, understanding how dietary and environmental exposures interact to influence growth and development is of seminal importance, particularly given that soy consumption is growing in popularity among Western populations and BPA exposure is nearly unavoidable.
In foods, GEN is present as its glycosylated form (genistin; GIN). Thus, for the present studies, GEN exposure was achieved via oral administration of GIN [52]. Additionally, a group of BPA-exposed animals was switched from a soy-free diet to a soy-rich one at weaning to assess how timing of dietary intervention influences outcomes. Peripubery has been identified as a window in which sexual dimorphisms in ingestive behavior emerge [53]. To model human exposure, BPA, soy and GIN were given orally at doses expected to produce internal levels of the parent compounds and their primary metabolites akin to those seen in humans. In addition to body weight and food consumption, timing of pubertal onset (females) and testis weight (males) were obtained to assess reproductive maturation, and heart weight (both sexes) was obtained to assess overall effects on growth and development outside of the reproductive system.
2. Materials and methods
2.1. Ethics statement
Wistar rats were used for this study, obtained from an existing in-house colony maintained on a soy-free, casein-based diet (Teklad 2020, Harlan Laboratories, Madison, WI), and housed in a temperature, humidity and light controlled facility (23 °C, 50% average relative humidity and 12:12h light:dark cycle; lights off at 10:00) at the Biological Resource Facility of North Carolina State University (NCSU), according to the applicable portions of the Animal Welfare Act and the U.S. Department of Health and Human Services Guide for the Care and use of Laboratory Animals. Animal care, maintenance and sacrifice for this study were approved by the Institutional Animal Care and Use Committee of NCSU. All procedures were approved and monitored by the supervising veterinarian for the duration of the project. As in our prior studies [50,54], and in accordance with recommended practices for EDC research [55–57], rats were housed in conditions specifically designed to minimize unintended EDC exposure including thoroughly washed polysulfone (BPA-free) caging with glass water bottles and wood chip (not corn cob) bedding.
2.2. Animal care and exposure
Parental animals (54 female and 54 male rats approximately PND 75) were paired (no sibling pairings), and pregnancy monitored every 24 h via vaginal lavage. Date of sperm detection was designated gestational day 0 (GD 0). On gestational day 1 (GD 1), dams (equivalent body weight at pairing) were randomly assigned to six exposure groups (n = 9 per group; Table 1): Casein (soy-free diet; Teklad 2020), Soy (soy diet; custom soy diet, Harlan), BPA+Casein (soy-free diet plus water containing BPA), BPA+Soy (soy diet plus water containing BPA), BPA/GIN+Casein (soy-free diet plus water containing BPA and genistin (GIN) daily via food treat) and BPA/Casein/Soy PND 21 (soy-free diet plus water containing BPA then pups switched to soy diet on PND 21). While not a balanced design, these groups were included to test the primary hypothesis that BPA and soy (or GIN) interact such that soy counteracts BPA-related effects. To minimize risk of cross-contamination, the dams on the soy diet were housed in a different room from those consuming the soy-free diet. Exposure (to BPA or GIN) started on GD 1 and continued until postnatal day (PND) 21 (day of birth defined as PND 0). With the exception of the group switched from soy-free (Casein) to soy-based diet on PND 21 (BPA/Casein/Soy PND 21), all animals stayed on their respective diet for the duration of the study.
Table 1.
Experimental design and groups.
| Water(through PND 21)
|
GIN through PND 21 | Casein diet
|
Soy diet
|
||||
|---|---|---|---|---|---|---|---|
| Exposure group | Vehicle | BPA | Before PND 21 | After PND 21 | Before PND 21 | After PND 21 | |
| Casein | + | − | − | + | + | − | − |
| Soy | + | − | − | − | − | + | + |
| BPA + casein | − | + | − | + | + | − | − |
| BPA + Soy | − | + | − | − | − | + | + |
| BPA/GIN +Casein | − | + | + | + | + | − | − |
| BPA/casein/soy PND 21 | − | + | − | + | − | − | + |
Diet (ad libitum and lifelong), BPA (2 mg/L, ad libitum) and GIN (40mg/day/dam) were administered from GD 1 through PND 21 to the dams.
On PND 21 pups were weaned into pairs (same sex; same exposure group) and maintained in the same diet room as dams with the exception of the BPA/Casein/Soy PND 21 group, which was relocated to the room housing the animals on the soy diet to accommodate the diet change.
2.3. Diet
The soy-free diet was Teklad 2020. The soy diet was a custom diet (Harlan Laboratories, Madison, WI) with maximum similarity to the Teklad 2020 diet where some ingredients (primarily casein and other protein sources) were replaced with soybean meal to achieve an isoflavone (sum of daidzein and genistein; expressed as the aglycone) level of 400 mg/kg diet. The energy density of the two diets was equivalent with the soy-based diet having 3.1 Kcal/g (24.1% from protein, 60.2% from carbohydrates and 15.7% from fat) and the Teklad 2020 diet having 3.02 Kcal/g (24% from protein, 60% from carbohydrates and 16% from fat).
2.4. Bisphenol A (BPA)
BPA (2,2-bis(4-hydroxyphenyl) propane (Sigma–Aldrich, St. Louis, MO)) was administered via drinking water as described previously [50] at 2 mg/L of water. This dose was selected based on prior studies by us and others utilizing this method to achieve serum levels in the human range (<4 ng/ml serum) [50,58–60]. Internal levels were assessed in the dams and the offspring as described below. This assessment was undertaken because there is a paucity of data regarding internal levels achieved following BPA intake via drinking water and how co-consumption of soy may impact circulating BPA levels. Employing more than one dose was not feasible for such a large, animal-intensive study.
2.5. Genistin
In foods, GEN is present as its glycosylated form (genistin; GIN) so GEN exposure was achieved via oral administration of GIN [52]. Because rodents and humans metabolize isoflavones differently, rodents have to be fed greater amounts to achieve plasma levels typical of humans [52,61]. Infants fed soy formula consume approximately 6–11 mg/kg total isoflavones and 4–7 mg/kg GEN daily and have plasma GEN levels in the range of 381–1455 ng/mL (1.4–5.4 μM) [62,63]. Prior work established that rats orally administered 60 mg/kg of GIN had stable GEN levels of 5 μM within 4h [52], which is on the high end of levels achievable by diet in humans. Here, dams were fed 40 mg GIN (LC Laboratories, Woburn, MA) on a peanut butter (Skippy Natural Creamy, Englewood Cliffs, NJ) covered Mini Nilla Wafer (Nabisco, East Hanover, NJ) (1 wafer/day/dam), daily through PND 21. All other rats in the study were fed peanut butter covered Nilla Wafers without GIN (as a dietary control). This method was used because GIN does not readily dissolve in any vehicle at concentration levels feasible for this type of study and we have successfully used food treats to orally administer other EDCs [64]; an exposure route that is palatable and not stressful to the animals.
2.6. Dam measurements
Dam body weight (BW) was measured on GDs 5, 12, 19 and PND 21, and gestational weight gain was calculated from GD 5 to GD 19. Lactational BW loss was measured by subtracting PND 21 BW from GD 19 BW. Food and water consumption was monitored from GD 1 to PND 21 and BPA intake estimated from these measurements. Serum was collected from a subset of dams on PND 2 (n = 1 per group) and PND 21 (n = 4–13/per group) to quantify serum BPA and GEN levels as well as their primary metabolites. All serum was stored at −80 °C then shipped to Rutgers University for processing, as we have done previously [50]. This assessment was intended to be a survey of internal levels and not a formal pharmacokinetic-pharmacodynamic (PPK)-type analysis.
The number of dams (litters) included in the experiment is presented in Table 2. Some dams were dropped from the study because they did not become pregnant within five days of pairing, lost their litters, stopped regularly consuming the food treats, or drank significantly less water than their within-group conspecifics. Litter size and sex ratio were measured on the day of birth and litter composition was verified on PNDs 2 and 10 but birth weight was not obtained.
Table 2.
Litter size and sex ratio.
| Exposure group | Dams (n) | Litter size | Sex ratio (F:M) |
|---|---|---|---|
| Casein | 9 | 15.14 ± 0.90 | 1.03 ± 0.61 |
| Soy | 9 | 13.33 ± 1.94* | 0.75 ± 0.25 |
| BPA + Casein | 16 | 12.67 ± 2.35* | 1.27 ± 0.78 |
| BPA + Soy | 9 | 14.44 ± 1.88 | 1.13 ± 0.46 |
| BPA/GIN +Casein | 4 | 14.50 ± 1.29 | 1.08 ± 0.44 |
P ≤ 0.05 compared with the Casein group.
2.7. Offspring measurements
After weaning (PND 21), all female offspring were checked for day of vaginal opening (VO; a hallmark of pubertal onset in the rat). Pubertal onset (prepucial separation) was not assessed in the males because we have repeatedly found no effect of BPA on this endpoint in rats (unpublished data). BW in both males and females was measured on PNDs 10, 21, 33, 55, 76 and 104. Total post-weaning body weight gain was obtained by subtracting PND 104 BW from PND 21 BW. Dietary consumption was measured in the weeks spanning PNDs 41 to 45, 58 to 62, 72 to76 and PNDs 104 to 108. From PND 34 to 36, approximately half of the offspring were subjected to behavioral testing (data to be published elsewhere) and sacrificed (juvenile cohort). The remaining animals were sacrificed on the day of estrus at approximately PND 120 (adult cohort). In both cohorts, testis (males) and heart (both sexes) were wet weighed then frozen on powdered dry ice and stored at −80 °C.
2.8. Serum BPA and GEN measurements
Free and conjugated BPA and GEN serum levels were measured in a subset of animals (n = 1 PND 2 pup and dam; n = 4–13 PND 21 pups and dams) to confirm internal doses were within a range considered human relevant. These assays required all available serum. Because assessment of free (unconjugated) BPA has proven to be challenging, particularly in small volumes, and contamination from plastics and other materials in the assessment process is a known issue [25,47,65], conjugated BPA (and GEN) were considered to be a more accurate reflection of internal exposure levels. In brief, serum BPA, GEN and their primary metabolites (glucoronides and sulfates) were quantified as described previously [50,66] with the following modifications: elution of the analytes from the Oasis HLB (Waters, Milford MA) 1 ml solid phase extraction cartridges was accomplished with 1 ml 10% NH4OH methanol and 1 ml of a 1:1:1 MeOH:ACN:ethylacetate mixture. Analyte separation was performed on an Xtera C8 3.5um column using a 1 mM NH4OAc (pH 9.5) and 10% of a 10 mM NH4OA 90% ACN in a gradient elution UPLC with an Accela pump system (Thermo Scientific, San Jose, CA) The Accela UPLC was interfaced to an LTQXL ITMS (Thermo Scientific, San Jose, CA) Method detection limits for these samples were as follows: 0.4 ng/ml for all Dam samples all analytes. Multiple factors including small sample size and background concentrations of some analytes measured in the commercial blank limited sensitivity for the pups. The method detection limits for the pups were: 28 ng/ml Gen-glu, 13 ng/ml Gen, 4 ng/ml BPA, 2 ng/ml BPA-glu 0.4 ng/nl BPA-monosulfate and 4.7 ng/ml BPA-disulfate. All assays were performed in the CEED chemical analysis facility core at the Environmental and Occupational Health Sciences Institute (a research Institute of Rutgers University, Piscataway, NJ 8854, USA).
2.9. Statistical analysis
Offspring data were analyzed within sex. Prior to weaning, pup measures were averaged to obtain a value (within sex) for each litter. Thus the litter was the statistical unit (n = 4–13 litters per group). It was not always statistically appropriate to compare all groups to each other because it was not a balanced design so the analysis was hypothesis-driven. For pre-weaning measures, the data were first analyzed by two-way analysis of variance (ANOVA) with diet and BPA exposure as factors within only the Casein, BPA + Casein, Soy, and BPA + Soy groups. If main effects were identified, protected two-sample separate variance t-tests were then used to compare two groups with either the same diet or the same BPA exposure (exposed or unexposed). This post-hoc analysis included comparisons between the animals exposed to BPA on the casein diet to animals exposed to BPA and GIN simultaneously (assessed capacity of GIN to replicate soy-diet effects in BPA exposed animals). For all post-weaning measures including age at VO, BW and food intake assessments, data from individual pups within each litter were averaged (within sex) to obtain a value for that litter and the litter was used as the statistical unit (n = 4–8 litters per group). The data were first approached by two-way ANOVA (all groups included) with diet and BPA exposure as factors and followed up with a post-hoc Tukey’s Multiple Comparison Test. All data are presented as the mean ± standard error (SE).
3. Results
3.1. Dam body weight across gestation and lactation
The overall trajectory of dam BW gain and loss over pregnancy and lactation is depicted in Fig. 1A–C and the accompanying table. In general, dams on the soy diet gained less weight during pregnancy than animals on the soy-free diet (Casein) and GIN did not reproduce the soy diet outcomes. Similarly, body weight loss across lactation was greatest in the Casein fed groups irrespective of BPA or GIN intake. Exposure to BPA did not appreciably affect BW regardless of diet.
Fig. 1.
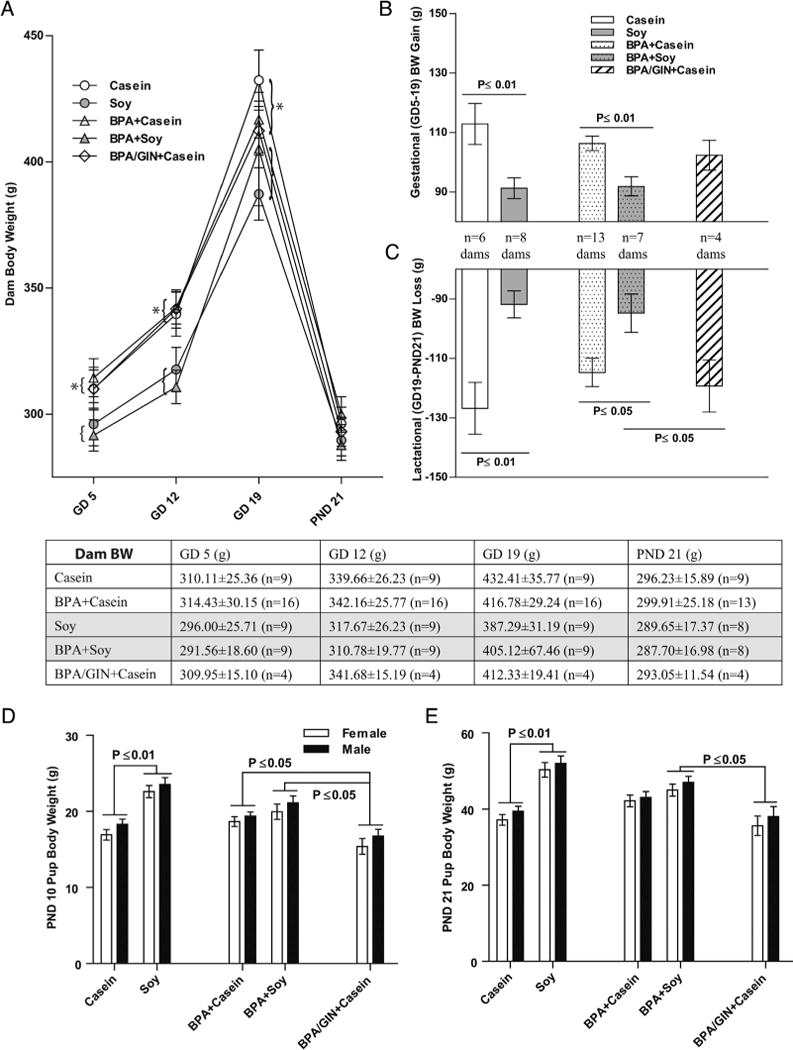
Dam and pup body weight through weaning. (A) A main effect of diet was found for dam BWonGDs 5,12 and 19 with dams on the soy diet weighing less than dams on the casein diet regardless of BPA exposure (groupings indicated by parentheses). GIN had no impact on dam weight. Dams on the soy diet gained less weight over the course of gestation (B) and, consequently, lost less weight during lactation (C). BW was equivalent in all groups by PND 21. Conversely, pups (both sexes) born to dams on the soy diet weighted more than casein-reared conspecifics on PND 10 (D) and 21 (E). This enhancement of pup weight by soy diet was not observed in the pups born to mothers consuming GIN. *P ≤ 0.05; Graphs depict means ± SD. Sample size is the litter.
Two-way ANOVA revealed a significant effect of diet on GD 5 (F(1,39) = 5.023, P ≤ 0.031), with BPA + Casein dams heavier than BPA + Soy dams (P = 0.050). This main effect of diet was also observed on GD 12 (F(1,39) = 11.65, P ≤ 0.001) and GD 19 (F(1,46) = 4.309, P ≤ 0.044). Gestational weight gain (Fig. 1B) was significantly impacted by diet (F(1,34) = 19.94, P ≤ 0.0001) with the casein groups gaining more body weight regardless of BPA exposure. BW in the group given GIN in addition to BPA did not differ from the group given BPA but no GIN.
Lactational body weight loss (Fig. 1D) was highest in the casein fed group (main effect of diet (F(1,30)) = 20.34, P ≤ 0.0001) but no effect of BPA or GIN was detected. By PND 21 there were no longer any group differences in BW (Fig. 1 A).
3.2. Dam food and water consumption
In summary, dams on the soy diet ate less during gestation than dams on the casein diet, regardless of BPA exposure, and the reverse was true during lactation (Fig. 2A and C). GIN supplementation reduced food intake during gestation to a similar degree as the soy diet, but had no impact during lactation. Water consumption did not significantly differ across groups in either gestation or lactation (Fig. 2B and D).
Fig. 2.
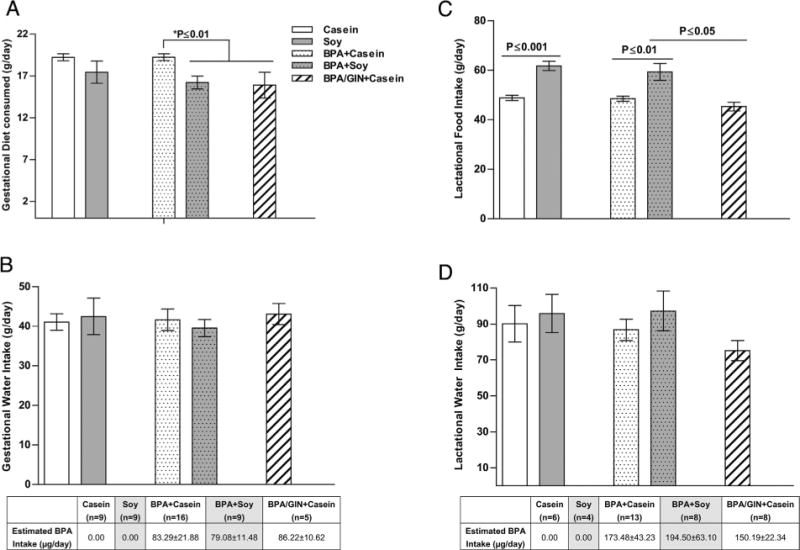
Dam food and water intake through weaning. (A) Soy fed animals ate less during gestation than casein fed conspecifics and there was a significant interaction with BPA exposure. Among the BPA-exposed dams, gestational food intake was lower in the females consuming soy or GIN. Similarly a main effect of diet was found for lactational ingestive behavior. Soy, but not GIN, fed dams consumed more than casein fed conspecifics. Water intake did not vary between groups in either gestation (C) or lactation (D). BPA intake estimated from water intake rates is depicted below panels (C) and (D) with values for the soy-reared animals shaded gray. Graphs depict means ± SD. Sample size is the litter.
During the gestational period, 2-way ANOVA revealed a main effect of diet (F(1,39) = 10.29, P ≤ 0.003), with food intake lower in the groups on soy diet (Fig 2A). Among the BPA-fed dams, the casein group consumed more chow than the soy-fed group (P ≤ 0.01) or the Casein with GIN group (P ≤ 0.01). During lactation (Fig. 2C), a significant main effect of diet was also detected (F(1,30) = 30.50, P ≤ 0.0001), but not an effect of BPA, nor any interaction. Among the BPA-exposed groups, diet had a significant impact. Consumption in the BPA/GIN + Casein group was similar to the BPA + Casein group, and significantly lower than the BPA + Soy group (P ≤ 0.05) indicating that GIN did not recapitulate the higher food consumption levels seen in the soy-fed dams.
3.3. Litter composition
The ratio of female to male pups did not differ between groups (Table 2). Two-way ANOVA on litter size revealed no main effect of diet or BPA but a significant interaction between the two (F(1,36) = 7.642, P ≤ 0.009; Table 2). Compared to the Casein group, the Soy group (P ≤ 0.05) and BPA + Casein group (P ≤ 0.05) had smaller litters. No significant difference in litter size was found within the BPA-exposed groups.
3.4. Internal dose of BPA, GEN and their primary metabolites
Water consumption did not significantly differ across groups (Fig. 2B and D). Estimated BPA intake during gestation was 79–86 μg/kg BW and 150–195 μg/kg BW during lactation (Fig. 2). Assessment of internal BPA, GEN and conjugate levels was conducted solely to confirm dosing was within a human relevant range. Reported levels (Tables 3–5) are likely only a “snapshot” and not reflective of peak or steady state levels as timing of food and water intake were not controlled for (that would have been too disruptive). For both compounds, their glucoronidated (glu) conjugate was quantified. For BPA, the sulfonated forms (mono and di) were also assessed.
Table 3.
Neonate and dam serum levels of bpa, gen and their glucuronidated and sulfonated conjugates.
| PND 2 (n = 1) |
GEN (ng/ml)
|
GEN-glu (ng/ml)
|
BPA (ng/ml)
|
BPA-glu (ng/ml)
|
BPA-SO4
|
BPA-(SO4) 2
|
||||||
|---|---|---|---|---|---|---|---|---|---|---|---|---|
| Dam | Pup | Dam | Pup | Dam | Pup | Dam | Pup | Dam | Pup | Dam | Pup | |
| Casein | 0 | 0 | 3.67 | 0 | 2.31 | 0 | 1.19 | 0 | 0.09 | 0.26 | 0 | 0 |
| Soy | 30.92 | 0 | 447.36 | 0 | 2.14 | 0 | 1.41 | 0.52 | 0.02 | 0.16 | 0 | 0 |
| BPA + casein | 1.38 | 0 | 4.33 | 0 | 3.95 | 0.27 | 53.94 | 2.98 | 1.09 | 0.1 | 0 | 0 |
| BPA + Soy | 10.16 | 0 | 96.1 | 0 | 1.92 | 0.97 | 14.8 | 0.36 | 0.01 | 0 | 0 | 0 |
| BPA/GIN +Casein | 47.62 | 0 | 290.75 | 10.43 | 1.45 | 0.69 | 10.29 | 1.53 | 0.05 | 0.64 | 0 | 0 |
Bolded groups consumed the compound of interest (GEN or BPA). No statistical comparisons were made because only one pup and one dam were used.
Table 5.
Dam serum levels of BPA, GEN and their glucuronidated and sulfonated conjugates.
| PND 21 Pups | GEN (ng/ml) | GEN-glu (ng/ml) | BPA (ng/ml) | BPA-glu (ng/ml) | BPA-SO4 | BPA-(SO4) 2 |
|---|---|---|---|---|---|---|
| Casein (n = 6) | 0 | 0 | 2.47 ± 1.17 | 1.55 ± 2.10 | 0.04 ± 0.06 | 0 |
| Soy (n =6) | 0 | 283.18 ± 337.46 | 0.90 ± 0.30 | 0.08 ± 0.19 | 0.01 ± 0.02 | 0 |
| BPA + Casein (n = 12) | 0 | 0 | 2.48 ± 2.55 | 20.44 ± 13.58 | 0.14 ± 0.12 | 0 |
| BPA + Soy (n = 6) | 0 | 600.58 ± 515.63 | 1.18 ± 0.66 | 4.94 ± 6.72 | 0.02 ± 0.03 | 0 |
| BPA/GIN + Casein (n=4) | 28.18 ± 30.32 | 1536.62 ± 1639.49 | 1.33 ± 0.62 | 14.47 ± 11.24 | 0.05 ± 0.15 | 0 |
Bolded groups consumed the compound of interest (GEN or BPA). No statistical comparisons were made because these data were only obtained to confirm that the internal dose range was environmentally-relevant.
Free and conjugated GEN was readily detectable in the PND 2 dams fed soy diet or GIN (Table 3), but only detectable in the GIN pups; likely reflecting poor lactational transfer (Table 3) [67]. Dam levels in the BPA/GIN/Casein group were within the range typical for vegetarians and other populations that regularly consume soyrich foods (wide variation between studies but approx. 25 ng/ml) but below that seen in soy-fed infants (approx. 381–1455 ng/mL) [14]. Dam free BPA levels on PND 2 were all below 4 ng/ml and thus in a range that approximates the current estimated mean serum levels in humans [22,25]. As predicted, BPA-gluc levels were highest in BPA-exposed dams. Results from the PND 21 pups and their dams (Tables 4 and 5) also confirmed human relevant exposure, with the BPA/GIN+Casein group having higher GEN exposure than animals on the soy diet. Trace levels of BPA-SO4 were present in all groups of dams and pups, and no BPA-(SO4) 2 was detected in any group of dams or pups emphasizing that this is a minor metabolite.
Table 4.
Weanling serum levels of BPA, GEN and their glucuronidated and sulfonated conjugates.
| PND 21 Dams | GEN (ng/ml) | GEN-glu (ng/ml) | BPA (ng/ml) | BPA-glu (ng/ml) | BPA-SO4 | BPA-(SO4) 2 |
|---|---|---|---|---|---|---|
| Casein (n = 6) | 1.42 ± 1.57 | 7.63 ± 6.2 | 4.35 ± 3.74 | 1.49 ± 1.57 | 0.16 ± 0.24 | 0 |
| Soy (n = 8) | 2.76 ± 2.06 | 717.13 ± 494.26 | 1.44 ± 0.88 | 1.44 ± 2.18 | 0.07 ± 0.05 | 0 |
| BPA + Casein (n = 13) | 1.55 ± 2.32 | 7.16 ± 7.36 | 2.70 ± 2.45 | 120.78 ± 69.45 | 0.47 ± 1.51 | 0 |
| BPA + Soy (n = 8) | 8.12 ± 4.44 | 480.11 ± 350.89 | 4.14 ± 1.61 | 52.09 ± 46.74 | 0.11 ± 0.11 | 0 |
| BPA/GIN + Casein (n = 4) | 18.70 ± 12.24 | 2483.64 ± 1161.1 | 5.04 ± 4.60 | 96.30 ± 102.89 | 1.26 ± 2.3 | 0 |
Bolded groups consumed the compound of interest (GEN or BPA). No statistical comparisons were made because these data were only obtained to confirm that the internal dose range was environmentally-relevant.
3.5. Preweaning body weight
Body weight data were analyzed within sex (Fig. 1D and E; Fig. 4). On PND 10, two-way ANOVA revealed a significant main effect of diet for females (F(1,31) = 17.65, P ≤ 0.0002) and for males (F(1,32) = 21.29, P ≤ 0.0001), as well as a significant interaction with BPA (females = F(1,31) = 6.976, P ≤ 0.013); males = (F(1,31) = 5.224, P ≤ 0.029 for males). Pups (both sexes) born to Soy dams were significantly heavier than pups born to Casein dams (P ≤ 0.01). This effect of diet was lost in the BPA-exposed groups. GIN did not recapitulate the heavier BW seen with soy diet.
Fig. 4.
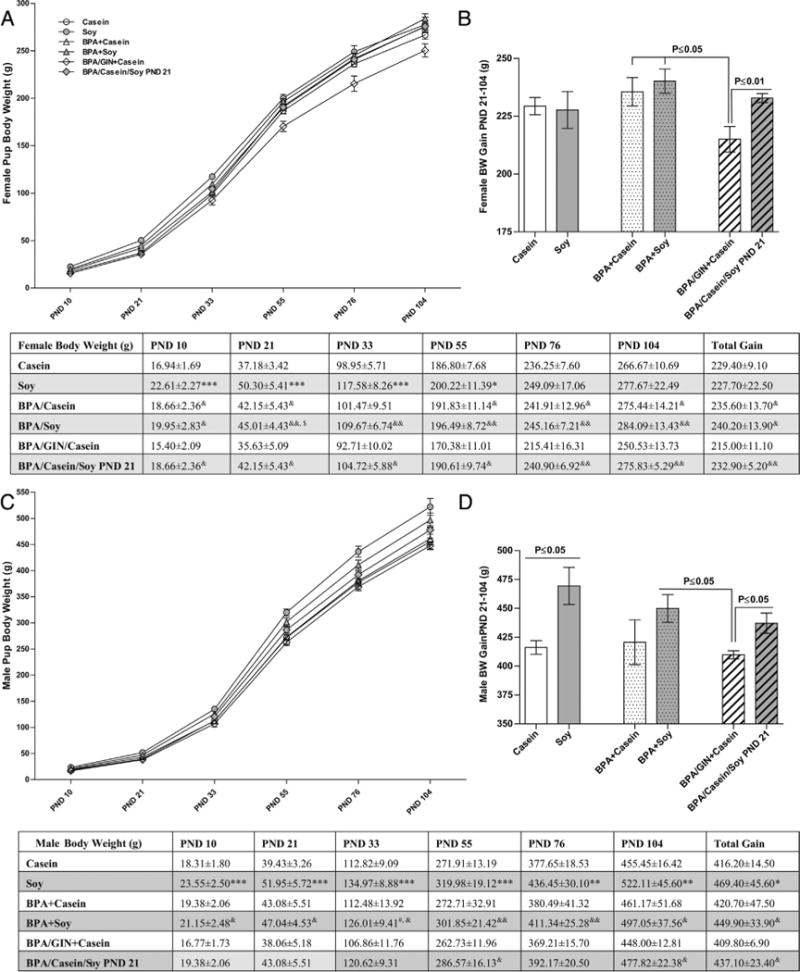
Post-weaning weight gain. No main effect of diet or BPA exposure was found for female BW at any age examined (A) or overall (B). Soy-reared females were heavier than casein-reared females (comparisons indicated by * in the table) through PND 33. Among the groups developmentally exposed to BPA, those co-exposed to casein were significantly lighter beginning on PND 55 (depicted in the table) which translated to lower overall BW gain between weaning and early adulthood. Females on the GIN diet were lighter than BPA-exposed conspecifics (comparisons indicated by & in the table). Weight gain in males is depicted in (C). A main effect of diet was found for overall weight gain (D) with soy reared animals heavier than casein reared males. Weight gain was less pronounced in males switched to soy diet at PND 21. In contrast to females, GIN had no effect on male weight gain compared to conspecifics also reared on BPA and casein diet. Graphs depict means ± SD. Sample size is the litter. Symbols represent comparisons to *Casein; #BPA +Casein; &BPA/GIN/Casein, $Soy. Number of symbols depicts level of statistical significance (ex: *P ≤ 0.05; **P ≤ 0.01, ***P ≤ 0.001).
BW effects were similar at PND 21 (Fig. 1E). A significant main effect of diet was found for females (F(1,31) = 21.23, P ≤ 0.0001) and males (F(1,31) = 21.61, P ≤ 0.0001), as well as a significant interaction (F(1,31) = 8.755, P ≤ 0.006) for females and F(1,31) = 5.827, P ≤ 0.022) for males). Pups (both sexes) in the Soy group were significantly heavier than pups in the Casein group (P ≤ 0.01). As in the PND 10 animals, no effect of diet was detected in the BPA-exposed groups, but BPA+Soy pups (both sexes) were significantly heavier than BPA/GIN/Casein pups (P ≤ 0.05).
3.6. Timing of female pubertal onset
Two-way ANOVA indicated a significant main effect of diet (F(1,157) = 49.86, P ≤ 0.0001) on day of VO (Fig. 3A). All soy fed groups (including the group switched to soy diet on PND 21) had advanced VO compared to all Casein fed groups (including the group ingesting GIN) (P ≤ 0.0001). BW on PND 33 (Fig. 3B and Fig. 4) was also examined because heavier animals tend to progress through puberty earlier. Two-way ANOVA indicated a significant main effect of diet (F(1,24) = 20.50, P ≤ 0.0001) on PND 33 BW with the Soy group heavier than the Casein group (P ≤ 0.001). Similarly, the BPA +Casein group was lighter than the BPA + Soy group (P ≤ 0.05). BW of the BPA/Casein/SoyPND 21 group was between that of the BPA + Casein and BPA + Soy groups and greater than the BPA/GIN + Casein group (P ≤ 0.05). Thus soy at weaning was sufficient to significantly advance VO and increase juvenile BW, and GIN did not recapitulate the effects of soy diet.
Fig. 3.
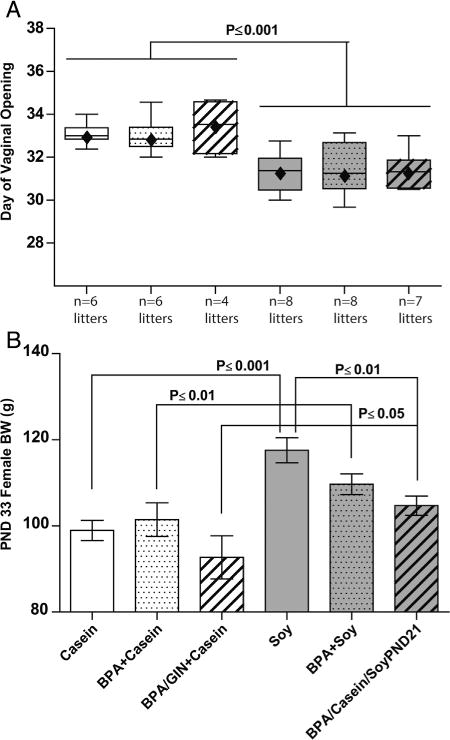
Female pubertal onset and weight. A main effect of diet was found forage at VO (A) and PND 33 BW (B). Age at VO was advanced in the soy-fed females, compared to the casein-fed females, even those switched to the soy diet on PND 21. Soy-fed females were also heavier than casein-fed conspecifics suggesting greater BW may have contributed to accelerated VO. Those beginning the diet on PND 21, however, were not as heavy as those who were reared on the soy diet. Graphs depict means±SD. Sample size is the litter(pups pergroup ranged from 25–51).
3.7. Postweaning BW
Trajectory of offspring BW gain across the entire study, including the postnatal period, is depicted in Fig. 4. Impacts were sex specific. Among the females, two-way ANOVA did not detect any main effects of diet or BPA exposure on post-weaning BW gain (Fig. 4B). Within the BPA-exposed groups, however, the BPA/GIN/Casein group gained the least compared to the BPA +Casein (P ≤ 0.05), BPA + Soy (P ≤ 0.05) and BPA/Casein/Soy PND21 (P ≤ 0.01) groups. By early adulthood (PND 104) BW was similar across groups and the only statistically significant differences were between the BPA/GIN + Casein group and the other BPA-exposed groups. Collectively these data show that female BW gain over postnatal development and adult BW was not appreciably impacted by soy diet or BPA, but reduced in females developmentally exposed to GIN.
Effects in males differed from effects in females (Fig. 4). A significant main effect of diet (F(1,24) = 7.997, P ≤ 0.009), was found by two-way ANOVA for total postnatal BW gain (Fig. 4C) with soy-fed males significantly heavier than those on the casein diet. The Soy group was heavier than the Casein group (P ≤ 0.05) but no difference between the BPA + Casein and BPA + Soy groups was detected. The BPA/GIN + Casein males gained less weight than BPA + Soy group (P ≤ 0.05) and the BPA/Casein/Soy PND21 group, again revealing that GIN alone did not have the same effect as soy diet on BW. By early adulthood (PND 104) Soy males were heavier than Casein males.
3.8. Postweaning food intake
Food intake across the postweaning period for both sexes is depicted in Fig. 5 and effects differed by sex. At all ages examined, there was a main effect of diet with females on the soy diet (including those switched to the soy diet on PND 21) consuming more than females on the casein diet. This effect of diet was most pronounced in the BPA-exposed groups. BPA-exposed females on the soy diet consumed more food than those on the casein diet (tabulated in Fig. 5). Body size influences food intake (heavier animals eat more). Thus daily food intake across the entire perinatal period was calculated in two ways: average food intake, and average food intake relative to body weight (Fig. 6). For females, results were similar. A significant main effect of average intake over the entire observation period was observed in both analyses (F(1,28) = 10.49, P ≤ 0.003 and (F(1, 28) = 14.29, P ≤ 0.0008) when normalized for BW; Fig. 5C and 6C). Post-hoc testing found that, while appreciable when not normalized for BW (Fig. 5C), heightened intake in the Soy group compared to the Casein group was statistically significant (P ≤ 0.01) only when BW was accounted for (Fig. 6C). BPA had no impact on female food intake regardless of how the data were analyzed.
Fig. 5.
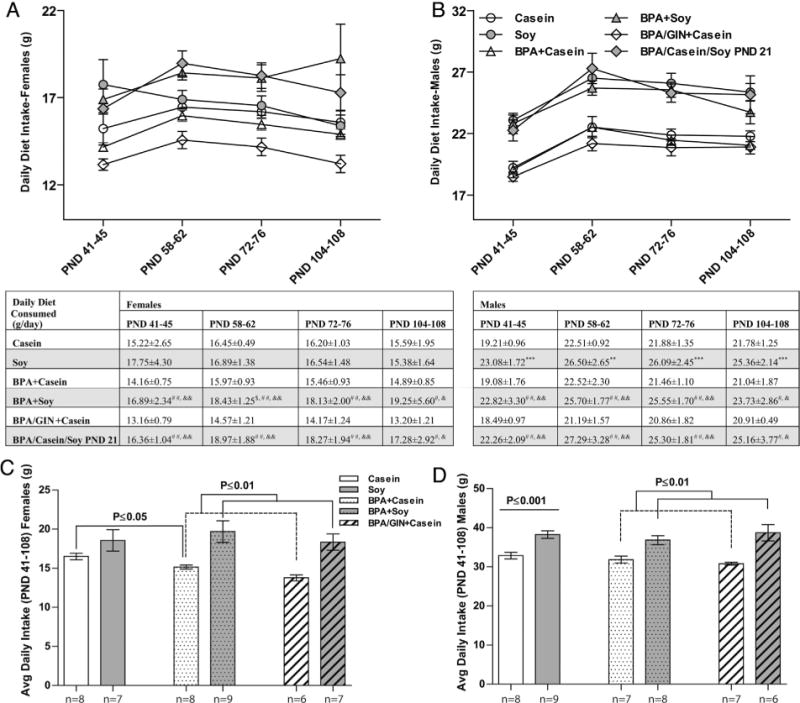
Postnatal food intake. A main effect of diet was found for mean daily food intake at all ages examined in females (A) and males (B) with the soy reared animals consuming more than casein reared animals. Within BPA-exposed females, those on the soy diet consumed more than those on the casein diet (comparisons indicated by # in the table). GIN-exposed females ate less than conspecifics also raised on BPA and casein (comparisons indicated by & in the table). Similar eating patterns were observed in males. Average consumption levels over the entire sampling period were also higher in females (C) and males (D) reared on soy. Group differences are depicted. Graphs depict means ± SD. Sample size is the litter. Symbols represent comparisons to *Casein; #BPA +Casein; &BPA/GIN/Casein, $Soy. Number of symbols depicts level of statistical significance (ex: *P ≤ 0.05; **P ≤ 0.01, ***P ≤ 0.001). Consumption normalized for BW produced similar results and are depicted in Fig. 6.
Fig. 6.
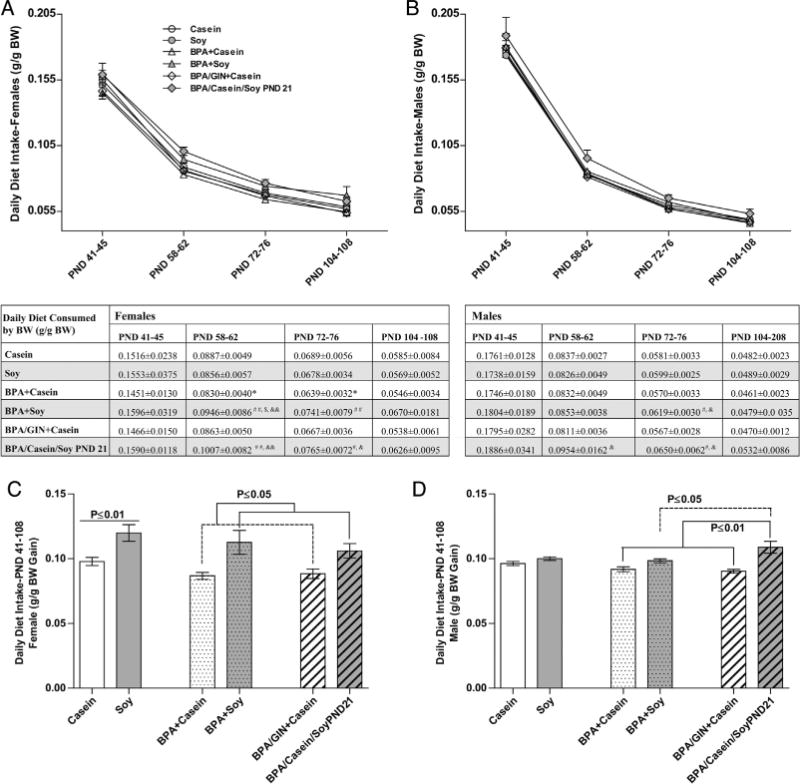
Postnatal food intake relative to body weight. A main effect of diet was found for mean daily food intake at all ages examined in females (A) but not males (B) with the soy reared animals consuming more than casein reared animals. Group differences over the age ranges sampled are depicted in the table. Average consumption levels over the entire sampling period were also higher in females (C) but not males (D) reared on soy. Within BPA-exposed males, those on the soy diet consumed more than those on the casein diet. Graphs depict means ± SD. Sample size is the litter. Symbols represent comparisons to *Casein; #BPA + Casein; &BPA/GIN/Casein, $Soy. Number of symbols depicts level of statistical significance (ex: *P ≤ 0.05; **P ≤ 0.01, ***P ≤ 0.001).
In males, a significant effect of diet was also found at all ages examined, with males on the soy diet (including those switched to the soy diet on PND 21) consuming more than males on the casein diet (Fig. 5). At all ages, this difference was more striking in males than females (Fig. 5B). For males, average consumption across the entire perinatal period is depicted in Fig. 5D, with consumption relative to BW depicted in Fig. 6D. A main effect of diet was found for average food consumption (F(1,28) = 27.97, P ≤ 0.0001) but this effect was lost when consumption was calculated relative to BW. Within the BPA-exposed groups, however, those on the soy diet ate more than those on the casein diet (P ≤ 0.01 for average consumption and P ≤ 0.05 for consumption relative to BW), with those moved to the soy diet on PND 21 consuming the most relative to their body weight.
3.9. Offspring testis and heart weight
Data regarding testis weight differed depending on how it was calculated (absolute or normalized to body weight). In juveniles, absolute testis weight was greater in the animals reared on soy but this effect was not observed when testis weight was normalized to body weight (Fig. 7A and B). BPA abrogated this soy-related size increase. Similarly, in the adults, there was also main effect of diet on absolute testis weight (F(1,61) = 10.41, P ≤ 0.002) and an interaction with BPA (F(1,61) = 7.68, P ≤ 0.007) such that the BPA + Soy males had lighter testes than Soy males (Fig. 7C) but did not meaningfully differ from casein-reared males. When testis weight was normalized to body weight (Fig. 7D) there was an interaction of diet and exposure (F(1, 61) = 7.811, P ≤ 0.007)) such that within the BPA exposed males, those on the soy diet had lighter testes than those on the casein diet, even those switched to soy diet at PND 21 (weaning).
Fig. 7.
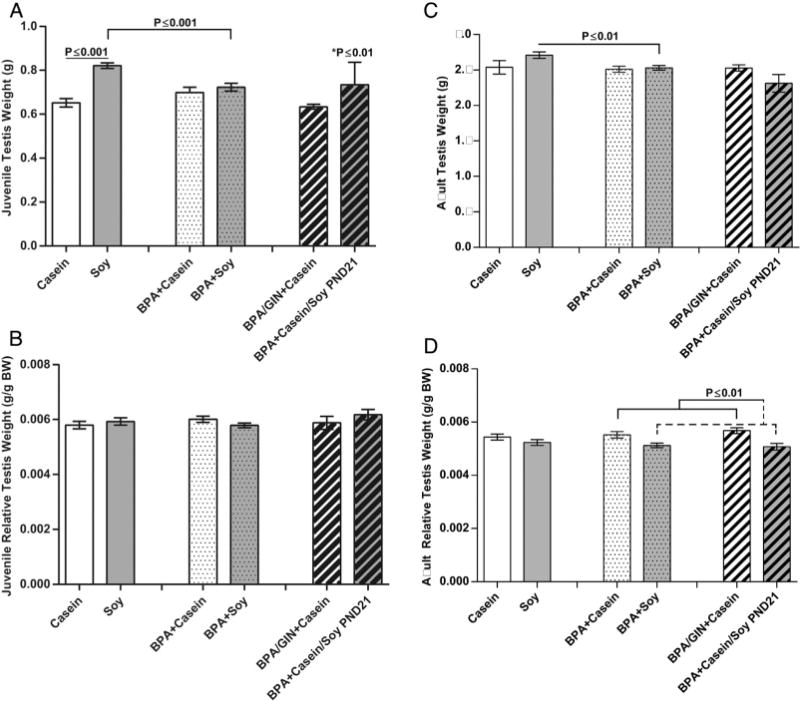
Juvenile and adult absolute and relative testis weight. A main effect of diet was found for juvenile testis weight (A) but not relative testis weight (B) with soy increasing absolute testis weight and BPA abrogating this effect. Similarly a main effect of diet was also observed for adult testis weight (C) with absolute testis weights higher in the soy groups. This effect was opposite, however, when testis weight was normalized to BW (D) and BPA enhanced this effect in some groups. Graphs depict means ± SD; *Compared to Casein.
Heart weight relative to body weight was not significantly impacted by diet or BPA (Table 6) in either the juveniles or the adults of either sex. GIN had no statistically significant effect on heart weight, although juveniles of both sexes in the BPA/GIN + Casein group had the largest hearts.
Table 6.
Relative heart weight in the offspring.
| Exposure groups | Juvenile heart (mg/g BW)
|
Adult heart (mg/g BW)
|
||
|---|---|---|---|---|
| Female | Male | Female | Male | |
| Casein | 5.99 ± 0.40 | 5.84 ±0.54 | 3.22 ±0.46 | 3.03 ± 0.35 |
| Soy | 5.92 ±0.86 | 5.63 ±0.54 | 3.37 ± 0.39 | 3.18 ± 0.37 |
| BPA + Casein | 6.01 ±0.54 | 5.75 ±1.04 | 3.19 ±0.36 | 3.26 ± 0.32 |
| BPA + Soy | 5.66 ± 0.66 | 5.81 ± 0.64 | 3.00 ± 0.53 | 3.18 ± 0.28 |
| BPA/GIN + Casein | 6.67 ± 1.53 | 6.19 ± 0.75 | 3.17 ± 0.40 | 3.20 ± 0.53 |
| BPA/casein/Soy PND21 | 5.84 ± 0.75 | 5.97 ± 0.59 | 3.07 ± 0.40 | 3.23 ± 0.36 |
Table depicts means ± SD.
4. Discussion
Soy diet promoted enhanced food intake, weight gain and early pubertal onset (females). In contrast, animals developmentally exposed to GIN (metabolized to GEN) were ultimately lighter in adulthood than their same sex conspecifics, and BPA had no meaningful effect on any outcome. Dams on soy diet gained less weight during pregnancy than dams on soy-free diet, but as early as PND 10 their offspring (both sexes) were significantly heavier than pups on the casein diet (Fig. 1); an effect which persisted through weaning and was more pronounced in males. Dam ingestive behavior also differed by diet with lactating dams on the soy diet eating more than dams on the casein diet. They did not, however, become heavier suggesting that the soy-fed dams disproportionally shifted resources to their offspring resulting in higher pup BW, particularly in males. This soy-related effect on BW was accompanied by evidence of accelerated reproductive maturation including advanced VO in females and elevated absolute testis weight in juvenile males. In adulthood, (PND ~108) elevated BW and increased food consumption were more robustly evident in males; an outcome concordant with landmark work showing that males are more susceptible to maternal diet-induced obesity and adult metabolic disease [9]. Collectively, these data are consistent with the “thrifty phenotype” concept (also known as the Barker Hypothesis) which posits that environmental factors can induce fetal reprogramming to make offspring more efficient at scavenging calories and nutrients but also, consequently, put them at higher risk for adult obesity, diabetes, metabolic syndrome, and cardiovascular disease [68–70]. Soy-related effects on BW and female VO were also observable in the group reared on the casein diet but then switched to the soy diet at weaning suggesting that peripuberty is a “critical window” for sex specific EDC effects on growth, reproductive maturation and metabolic reprogramming [53].
The scale of this study precluded us from examining different mixtures of soy isoflavones or more than one dose of GIN, but prior data suggest the dose response for GEN on BW may be nonlinear. In male C57BL/6 mice (females not tested) GEN exposure (50–200,000 μg/kg BW/day for 15 days beginning at 5 weeks of age (~PND 28)) increased BW and elevated renal and epididymal fat deposition at doses up to 50,000 μg/kg diet/day but the opposite was observed at higher (pharmacological) doses [47]. Males on a 800 ppm (800 μg/kg) GEN diet also had elevated adiposity [47]. For doses found to be adipogenic, serum free GEN levels were <100 nM, which is consistent with the internal levels found for the dams and pups in the present study. Increased BW accompanied by elevated blood glucose and insulin resistance has also been reported in adult Wistar rats (placed on diet as adults) but effects resolved once soy diet was discontinued [71]. Collectively these data suggest that, in males, soy promotes weight gain at low doses but weight loss at high (not readily achieved by dietary intake) doses. While adult effects are seemingly transient, the studies reported herein provide evidence that developmental exposure (gestational through peripuberty) can produce persistent effects.
Females appear to respond differently. Here we found soy diet elevated BW prior to weaning, but this normalized. Females in the GIN group ultimately became lighter than their conspecifics even though exposure stopped on PND 21, suggesting that GIN induced developmental reprogramming which attenuated weight gain (although further work using GIN in the absence of BPA would be needed to confirm this). Serum GEN levels in the GIN group were in the 70 nM range. These results are consistent with reduced adiposity in ovariectomized juvenile female C57BL/6 mice fed a diet supplemented with 500, 1000 or 1500ppm GEN for 28 days [46] and internal free GEN levels averaging 1.79, 2.55 and 3.81 μM respectively. Similarly, C57BL/6 females consuming a diet supplemented with 50–200,000 μg/kg diet/day showed a dose dependent decrease in adiposity and body weight which only reached statistical significance at the highest dose [47]. Ovariectomized juvenile (PND 25–27) C57BL/6 mice injected daily for 28 days with GEN at 20 and 80 mg/kg bw but not 8 mg/kg bw also displayed reduced adiposity [46]; results providing further evidence that high doses of GEN are required to reduce body weight. Serum GEN levels were not reported, but because injection bypasses first pass metabolism internal levels of free GEN are ostensibly higher than those obtained by equivalent oral exposures.
Opposite results were reported in two studies in CD-1 mice [48,72] using different soy and casein based chows, but with similar compositions to those used here. Because rats and mice appear to absorb and metabolize soy isoflavones similarly [73] significant species differences likely do not account for the discrepancy. Instead, this reversed response might reflect a unique response of CD-1 mice. Like Wistar rats, C57BL/6 mice are known to have a high susceptibility to diet-induced obesity and glucose intolerance (JAX Mice Database and [74]). CD-1 mice can phenotypically differ by source and lab; differences reflected in their genome [75]. BPA has been shown to promote obesity and metabolic syndrome in CD-1 mice from one lab [76,77] but a different group, using a different set of CD-1 mice, concluded that BPA promotes growth acceleration and not obesity [76]. In isogenic a/a mice BPA induced hyperactivity and lean body composition. The possibility that EDC effects in rodents are likely strain and species specific should be accounted for in subsequent studies seeking to assess the “obesogenic” properties of EDCs and other compounds.
In a prior study with a similar design, we showed that a soy-rich diet (Purina 5001) generating approximately 20 ng/ml (74 nM) free GEN levels in the dams [50], promoted early VO, weight gain, elevated baseline glucose levels and increased area under the curve in the classic glucose challenge test [78]. Isoflavone levels in the custom diet for the present study were 400 mg/kg, and produced dam serum GEN levels in the range of 2.8–31 ng/mL. Thus exposure/intake was likely similar or somewhat lower in the present study compared to our prior study. By contrast, GIN levels were significantly higher and had profoundly different effects. BW gain lagged behind in this group, even long after exposure ceased. Collectively these data suggest that dose and bioavailability are important considerations when assessing the metabolic and growth promoting effects of soy and soy isoflavones. Interestingly, BPA-exposed dams (on both PND 2 and PND 21) and PND 21 juveniles on the soy diet had the lowest levels of free BPA and BPA-glu, potentially indicating that soy alters the absorption and metabolism of BPA. This data needs to be interpreted with caution, however, because serum levels were only assessed to confirm that exposure levels were in a range considered human-relevant not to make inferences about pharmacokinetics. The observation that BPA appeared to block elevated testis weight in the soy-fed juveniles and adults supports they hypothesis that BPA activity can be modified by diet, and warrants further study.
A caveat of this study is that BW does not necessarily reflect adiposity. We hypothesize that the heavier animals in the present study are larger and developing at a faster rate than their lighter conspecifics; a supposition consistent with the available literature but requiring confirmatory studies. Litter size was smaller in the Soy and BPA/Casein groups but these differences did not appear to meaningfully correspond to differences in BW, pubertal onset, testis weight, or other outcomes. Litter size can impact growth/puberty because of maternal over/underfeeding but litter sizes were within the range considered typical for this species and not small enough to promote overfeeding [16]. A final potential caveat is that trace levels of free BPA and GEN were detected in unexposed dams. But this is not inconsistent with prior, similar studies because contamination (either from trace levels in the diet ortrace levels introduced in the post-collection process) has proved difficult to overcome when assessing unconjugated serum levels in a variety of species, including humans [25,47,65]. For example, unintended exposure of unexposed controls and low dose BPA groups occurred in an FDA study where rats were housed in the same room with animals being given much higher doses [79]. For the present study, extensive precautions were taken to minimize risk of contamination. Only one BPA dose was used, the water bottles were prepared in a different building, and animals on different diets were housed in different rooms. Conjugate levels are likely more reflective of exposure levels and were markedly higher in the exposed groups, particularly on PND 21.
5. Conclusions
It has been hypothesized that developmental EDC exposure can accelerate puberty, promote weight gain and be “obesogenic.” Rat dams on a soy-rich diet gained less weight during pregnancy but their pups ultimately displayed more rapid weight gain than conspecifics reared on a soy-free diet, suggesting that soy-fed dams disproportionally shifted resources to their offspring resulting in higher pup BW, particularly in males. BPA exposure neither modified this effect nor had an independent effect on any assessed endpoints. The only evidence for an interaction between BPA and soy was on testis weight, but those effects were modest and further work is needed to better characterize this potential effect. By early adulthood, BW normalized in females but remained elevated in males revealing that long term BW effects are sex specific and may signify a “thrifty phenotype” in the males. These data highlight that not all EDCs are anthropogenic and that hormonally active diets, such as soy-rich diets, can also be endocrine disrupting. The long term health consequences of developmental EDC exposure remain controversial but of critical interest, as are the mechanisms by which they occur and their relative contributions to the obesity epidemic and accelerated female puberty [11,80].
Acknowledgments
We thank Paul Gibson and Emily Cox for their help with the dosing, weighing, and data organization. We also thank Meghan Radford, Brian Horman and Alana Sullivan for their generous willingness to provide assistance whenever it was needed, assistance with data organization and record keeping, and preliminary data analyses. This research was supported in part by R21ES021233 to H. Patisaul and the NIEHS sponsored Rutgers Center for Environmental Exposures and Disease: NIEHS P30ES005022.
References
- 1.Vogel SA. Is It Safe? Bpaand the Struggle to Define the Safety of Chemicals. University of California Press; Berkeley: 2013. [Google Scholar]
- 2.Frye CA, Bo E, Calamandrei G, Calza L, Dessi-Fulgheri F, Fernandez M, et al. Endocrine disrupters: a review of some sources, effects, and mechanisms of actions on behaviour and neuroendocrine systems. J Neuroendocrinol. 2012;24:144–159. doi: 10.1111/j.1365-2826.2011.02229.x. [DOI] [PMC free article] [PubMed] [Google Scholar]
- 3.WHO/UNEP. State of the Science of Endocrine Disrupting Chemicals—2012. In: Bergman A, Heindel JJ, Jobling S, Kidd KA, Zoeller RT, editors. United National Envirnoment Programme World Health Organization. 2012. p. 296. [Google Scholar]
- 4.Diamanti-Kandarakis E, Bourguignon JP, Giudice LC, Hauser R, Prins GS, Soto AM, et al. Endocrine-disrupting chemicals: an endocrine society scientific statement. Endocr Rev. 2009;30:293–342. doi: 10.1210/er.2009-0002. [DOI] [PMC free article] [PubMed] [Google Scholar]
- 5.Decherf S, Demeneix BA. The obesogen hypothesis: a shift of focus from the periphery to the hypothalamus. J Toxicol Environ Health B Crit Rev. 2011;14:423–448. doi: 10.1080/10937404.2011.578561. [DOI] [PubMed] [Google Scholar]
- 6.Grun F, Blumberg B. Minireview the case for obesogens. Mol Endocrinol. 2009;23:1127–1134. doi: 10.1210/me.2008-0485. [DOI] [PMC free article] [PubMed] [Google Scholar]
- 7.Schneider JE, Brozek JM, Keen-Rhinehart E. Our stolen figures: the interface of sexual differentiation, endocrine disruptors, maternal programming, and energy balance. Horm Behav. 2014;66:104–119. doi: 10.1016/j.yhbeh.2014.03.011. [DOI] [PubMed] [Google Scholar]
- 8.Baillie-Hamilton PF. Chemical toxins: a hypothesis to explain the global obesity epidemic. J Altern Complement Med. 2002;8:185–192. doi: 10.1089/107555302317371479. [DOI] [PubMed] [Google Scholar]
- 9.Jones AP, Friedman MI. Obesity and adipocyte abnormalities in offspring of rats undernourished during pregnancy. Science. 1982;215:1518–1519. doi: 10.1126/science.7063860. [DOI] [PubMed] [Google Scholar]
- 10.Williams JP. Catch-up growth. J Embryol Exp Morphol. 1981;65(Suppl):89–101. [PubMed] [Google Scholar]
- 11.Mouritsen A, Aksglaede L, Sorensen K, Mogensen SS, Leffers H, Main KM, et al. Hypothesis: exposure to endocrine-disrupting chemicals may interfere with timing of puberty. Int J Androl. 2010;33:346–359. doi: 10.1111/j.1365-2605.2010.01051.x. [DOI] [PubMed] [Google Scholar]
- 12.Roy JR, Chakraborty S, Chakraborty TR. Estrogen-like endocrine disrupting chemicals affecting puberty in humans–a review. Med Sci Monit. 2009;15:RA137–45. [PubMed] [Google Scholar]
- 13.Losa-Ward SM, Todd KL, McCaffrey KA, Tsutsui K, Patisaul HB. Disrupted organization of RFamide pathways in the hypothalamus is associated with advanced puberty in female rats neonatally exposed to bisphenol A. Biol Reprod. 2012;87:28. doi: 10.1095/biolreprod.112.100826. [DOI] [PMC free article] [PubMed] [Google Scholar]
- 14.Patisaul HB, Jefferson W. The pros and cons of phytoestrogens. Front Neuroendocrinol. 2010;31:400–419. doi: 10.1016/j.yfrne.2010.03.003. [DOI] [PMC free article] [PubMed] [Google Scholar]
- 15.Bateman HL, Patisaul HB. Disrupted female reproductive physiology following neonatal exposure to phytoestrogens or estrogen specific ligands is associated with decreased GnRH activation and kisspeptin fiber density in the hypothalamus. Neurotoxicology. 2008;29:988–997. doi: 10.1016/j.neuro.2008.06.008. [DOI] [PMC free article] [PubMed] [Google Scholar]
- 16.Castellano JM, Bentsen AH, Sanchez-Garrido MA, Ruiz-Pino F, Romero M, Garcia-Galiano D, et al. Early metabolic programming of puberty onset: impact of changes in postnatal feeding and rearing conditions on the timing of puberty and development of the hypothalamic kisspeptin system. Endocrinology. 2011;152:3396–3408. doi: 10.1210/en.2010-1415. [DOI] [PubMed] [Google Scholar]
- 17.Gao Q, Mezei G, Nie Y, Rao Y, Choi CS, Bechmann I, et al. Anorectic estrogen mimics leptin’s effect on the rewiring of melanocortin cells and Stat3 signaling in obese animals. Nat Med. 2007;13:89–94. doi: 10.1038/nm1525. [DOI] [PubMed] [Google Scholar]
- 18.Myers MG, Jr, Simerly RB. The neuroendocrinology and neuroscience of energy balance. Front Neuroendocrinol. 2010;31:1–3. doi: 10.1016/j.yfrne.2009.10.007. [DOI] [PMC free article] [PubMed] [Google Scholar]
- 19.Cooper JE, Kendig EL, Belcher SM. Assessment of bisphenol A released from reusable plastic, aluminium and stainless steel water bottles. Chemosphere. 2011;85:943–947. doi: 10.1016/j.chemosphere.2011.06.060. [DOI] [PMC free article] [PubMed] [Google Scholar]
- 20.Liao C, Kannan K. Widespread occurrence of bisphenol A in paper and paper products: implications for human exposure. Environ Sci Technol. 2011;45:9372–9379. doi: 10.1021/es202507f. [DOI] [PubMed] [Google Scholar]
- 21.Lakind JS, Naiman DQ. Daily intake of bisphenol A and potential sources of exposure: 2005–2006 national health and nutrition examination survey. J Expo Sci Environ Epidemiol. 2011;21:272–279. doi: 10.1038/jes.2010.9. [DOI] [PMC free article] [PubMed] [Google Scholar]
- 22.Vandenberg LN, Hauser R, Marcus M, Olea N, Welshons WV. Human exposure to bisphenol A (BPA) Reprod Toxicol. 2007;24:139–177. doi: 10.1016/j.reprotox.2007.07.010. [DOI] [PubMed] [Google Scholar]
- 23.Calafat AM, Ye X, Wong LY, Reidy JA, Needham LL. Exposure of the U.S. population to bisphenol A and 4-tertiary-octylphenol: 2003–2004. Environ Health Perspect. 2008;116:39–44. doi: 10.1289/ehp.10753. [DOI] [PMC free article] [PubMed] [Google Scholar]
- 24.Calafat AM, Weuve J, Ye X, Jia LT, Hu H, Ringer S, et al. Exposure to Bisphenol and other phenols in neonatal intensive care unit premature infants. Environ Health Perspect. 2009;117:639–644. doi: 10.1289/ehp.0800265. [DOI] [PMC free article] [PubMed] [Google Scholar]
- 25.Vandenberg LN, Gerona RR, Kannan K, Taylor JA, van Breemen RB, Dickenson CA, et al. A round robin approach to the analysis of bisphenol a (BPA) in human blood samples. Environ Health. 2014;13:25. doi: 10.1186/1476-069X-13-25. [DOI] [PMC free article] [PubMed] [Google Scholar]
- 26.Dodds EC, Goldberg L, Larson W, Robinson R. Estrogenic activity of certain synthetic compounds. Nature. 1938;141:247. [Google Scholar]
- 27.vom Saal FS, Akingbemi BT, Belcher SM, Birnbaum LS, Crain DA, Eriksen M, et al. Chapel Hill bisphenol A expert panel consensus statement: integration of mechanisms, effects in animals and potential to impact human health at current levels of exposure. Reprod Toxicol. 2007;24:131–138. doi: 10.1016/j.reprotox.2007.07.005. [DOI] [PMC free article] [PubMed] [Google Scholar]
- 28.Goodman JE, Witorsch RJ, McConnell EE, Sipes IG, Slayton TM, Yu CJ, et al. Weight-of-evidence evaluation of reproductive and developmental effects of low doses of bisphenol A. Crit Rev Toxicol. 2009;39:1–75. doi: 10.1080/10408440802157839. [DOI] [PubMed] [Google Scholar]
- 29.Beronius A, Ruden C, Hakansson H, Hanberg A. Risk to all or none? A comparative analysis of controversies in the health risk assessment of Bisphenol A. Reprod Toxicol. 2010;29:132–146. doi: 10.1016/j.reprotox.2009.11.007. [DOI] [PubMed] [Google Scholar]
- 30.Rochester JR. Bisphenol A and human health: a review of the literature. Reprod Toxicol. 2013;42:132–155. doi: 10.1016/j.reprotox.2013.08.008. [DOI] [PubMed] [Google Scholar]
- 31.FAO/WHO. Report of Joint FAO/WHO Expert Meeting and Report of Stakeholder Meeting on Bisphenol A. World Health Organization; 2011. Toxicological and health aspects of bisphenol A. [Google Scholar]
- 32.Shelby MD. NTP-CERHR monograph on the potential human reproductive and developmental effects of bisphenol A. NTP CERHR MON. 2008:v, vii–ix. 1–64 passim. [PubMed] [Google Scholar]
- 33.Rubin BS, Murray MK, Damassa DA, King JC, Soto AM. Perinatal exposure to low doses of bisphenol A affects body weight, patterns of estrous cyclicity, and plasma LH levels. Environ Health Perspect. 2001;109:675–680. doi: 10.1289/ehp.01109675. [DOI] [PMC free article] [PubMed] [Google Scholar]
- 34.Rubin BS, Soto AM, Bisphenol A. Perinatal exposure and body weight. Mol Cell Endocrinol. 2009;304:55–62. doi: 10.1016/j.mce.2009.02.023. [DOI] [PMC free article] [PubMed] [Google Scholar]
- 35.Anderson OS, Peterson KE, Sanchez BN, Zhang Z, Mancuso P, Dolinoy DC. Perinatal bisphenol A exposure promotes hyperactivity, lean body composition, and hormonal responses across the murine life course. Faseb J. 2013;27(4):1784–1792. doi: 10.1096/fj.12-223545. [DOI] [PMC free article] [PubMed] [Google Scholar]
- 36.Oppeneer SJ, Robien K. Bisphenol A exposure and associations with obesity among adults: a critical review. Public Health Nutr. 2015;18(10):1847–1863. doi: 10.1017/S1368980014002213. [DOI] [PMC free article] [PubMed] [Google Scholar]
- 37.Braun JM, Lanphear BP, Calafat AM, Deria S, Khoury J, Howe CJ, et al. Early-life bisphenol a exposure and child body mass index: a prospective cohort study. Environ Health Perspect. 2014;122:1239–1245. doi: 10.1289/ehp.1408258. [DOI] [PMC free article] [PubMed] [Google Scholar]
- 38.UK-Committee-on-Toxicity. Phytoestrogens and Health Committee on Toxicity of Chemicals in Food. Consumer Products and the Environment; London: 2003. [Google Scholar]
- 39.Bennetts HW, Underwood EJ, Shier FL. A specific breeding problem of sheep on subterranean clover pastures in Western Australia. Aust Vet J. 1946;22:2. doi: 10.1111/j.1751-0813.1946.tb15473.x. [DOI] [PubMed] [Google Scholar]
- 40.McCarrison R. The goitrogenic action of soya-bean and ground-nut. Indian J Med Res. 1933;21:179–181. [Google Scholar]
- 41.Whitten PL, Patisaul HB. Cross-species and interassay comparisons of phytoestrogen action. Environ Health Perspect. 2001;109:5–23. doi: 10.1289/ehp.01109s15. [DOI] [PMC free article] [PubMed] [Google Scholar]
- 42.Kuiper GGJM, Lemmen JG, Carlsson B, Corton JC, Safe SH, Van Der Saag PT, et al. Interaction of estrogenic chemicals and phytoestrogens with estrogen receptor b. Endocrinology. 1998;139:4252–4263. doi: 10.1210/endo.139.10.6216. [DOI] [PubMed] [Google Scholar]
- 43.Newbold RR. Impact of environmental endocrine disrupting chemicals on the development of obesity. Horm (Athens) 2010;9:206–217. doi: 10.14310/horm.2002.1271. [DOI] [PubMed] [Google Scholar]
- 44.Jungbauer A, Medjakovic S. Phytoestrogens and the metabolic syndrome. J Steroid Biochem Mol Biolo. 2014;139:277–289. doi: 10.1016/j.jsbmb.2012.12.009. [DOI] [PubMed] [Google Scholar]
- 45.Slikker W, Jr, Scallet AC, Doerge DR, Ferguson SA. Gender-based differences in rats after chronic dietary exposure to genistein. Int J Toxicol. 2001;20:175–179. doi: 10.1080/109158101317097764. [DOI] [PubMed] [Google Scholar]
- 46.Naaz A, Yellayi S, Zakroczymski MA, Bunick D, Doerge DR, Lubahn DB, et al. The soy isoflavone genistein decreases adipose deposition in mice. Endocrinology. 2003;144:3315–3320. doi: 10.1210/en.2003-0076. [DOI] [PubMed] [Google Scholar]
- 47.Penza M, Montani C, Romani A, Vignolini P, Pampaloni B, Tanini A, et al. Genistein affects adipose tissue deposition in a dose-dependent and gender-specific manner. Endocrinology. 2006;147:5740–5751. doi: 10.1210/en.2006-0365. [DOI] [PubMed] [Google Scholar]
- 48.Ruhlen RL, Howdeshell KL, Mao J, Taylor JA, Bronson FH, Newbold RR, et al. Low phytoestrogen levels in feed increase fetal serum estradiol resulting in the fetal estrogenization syndrome and obesity in CD-1 mice. Environ Health Perspect. 2008;116:322–328. doi: 10.1289/ehp.10448. [DOI] [PMC free article] [PubMed] [Google Scholar]
- 49.Dolinoy DC, Huang D, Jirtle RL. Maternal nutrient supplementation counteracts bisphenol A-induced DNA hypomethylation in early development. Proc Natl Acad Sci U S A. 2007;104:13056–13061. doi: 10.1073/pnas.0703739104. [DOI] [PMC free article] [PubMed] [Google Scholar]
- 50.Patisaul HB, Sullivan AW, Radford ME, Walker DM, Adewale HB, Winnik B, et al. Anxiogenic effects of developmental bisphenol A exposure are associated with gene expression changes in the juvenile rat amygdala and mitigated by soy. PLoS One. 2012;7:e43890. doi: 10.1371/journal.pone.0043890. [DOI] [PMC free article] [PubMed] [Google Scholar]
- 51.Muhlhauser A, Susiarjo M, Rubio C, Griswold J, Gorence G, Hassold T, et al. Bisphenol A effects on the growing mouse oocyte are influenced by diet. Biol Reprod. 2009;80:1066–1071. doi: 10.1095/biolreprod.108.074815. [DOI] [PMC free article] [PubMed] [Google Scholar]
- 52.Jefferson WN, Doerge D, Padilla-Banks E, Woodling KA, Kissling GE, Newbold R. Oral exposure to genistin, the glycosylated form of genistein, during neonatal life adversely affects the female reproductive system. Environ Health Perspect. 2009;117:1883–1889. doi: 10.1289/ehp.0900923. [DOI] [PMC free article] [PubMed] [Google Scholar]
- 53.Swithers SE, McCurley M, Hamilton E, Doerflinger A. Influence of ovarian hormones on development of ingestive responding to alterations in fatty acid oxidation in female rats. Horm Behav. 2008;54 doi: 10.1016/j.yhbeh.2008.05.009. [DOI] [PMC free article] [PubMed] [Google Scholar]
- 54.Patisaul HB, Todd KL, Mickens JA, Adewale HB. Impact of neonatal exposure to the ERalpha agonist PPT, bisphenol-A or phytoestrogens on hypothalamic kisspeptin fiber density in male and female rats. Neurotoxicology. 2009;30:350–357. doi: 10.1016/j.neuro.2009.02.010. [DOI] [PMC free article] [PubMed] [Google Scholar]
- 55.Hunt PA, Susiarjo M, Rubio C, Hassold TJ. The bisphenol A experience: a primer for the analysis of environmental effects on mammalian reproduction. Biol Reprod. 2009;81:807–813. doi: 10.1095/biolreprod.109.077008. [DOI] [PMC free article] [PubMed] [Google Scholar]
- 56.Richter CA, Birnbaum LS, Farabollini F, Newbold RR, Rubin BS, Talsness CE, et al. In vivo effects of bisphenol A in laboratory rodent studies. Reprod Toxicol. 2007;24:199–224. doi: 10.1016/j.reprotox.2007.06.004. [DOI] [PMC free article] [PubMed] [Google Scholar]
- 57.Li AA, Baum MJ, McIntosh LJ, Day M, Liu F, Gray LE., Jr Building a scientific framework for studying hormonal effects on behavior and on the development of the sexually dimorphic nervous system. Neurotoxicology. 2008;29:504–519. doi: 10.1016/j.neuro.2008.02.015. [DOI] [PubMed] [Google Scholar]
- 58.Miyawaki J, Sakayama K, Kato H, Yamamoto H, Masuno H. Perinatal and postnatal exposure to bisphenol a increases adipose tissue mass and serum cholesterol level in mice. J Atheroscler Thromb. 2007;14:245–252. doi: 10.5551/jat.e486. [DOI] [PubMed] [Google Scholar]
- 59.Fujimoto T, Kubo K, Aou S. Prenatal exposure to bisphenol A impairs sexual differentiation of exploratory behavior and increases depression-like behavior in rats. Brain Res. 2006;1068:49–55. doi: 10.1016/j.brainres.2005.11.028. [DOI] [PubMed] [Google Scholar]
- 60.Kabuto H, Amakawa M, Shishibori T. Exposure to bisphenol A during embryonic/fetal life and infancy increases oxidative injury and causes underdevelopment of the brain and testis in mice. Life Sci. 2004;74:2931–2940. doi: 10.1016/j.lfs.2003.07.060. [DOI] [PubMed] [Google Scholar]
- 61.Cimafranca MA, Davila J, Ekman GC, Andrews RN, Neese SL, Peretz J, et al. Acute and chronic effects of oral genistein administration in neonatal mice. Biol Reprod. 2010;83:114–121. doi: 10.1095/biolreprod.109.080549. [DOI] [PMC free article] [PubMed] [Google Scholar]
- 62.Setchell KDR, Zimmer-Nechemias L, Cai J, Heubi JE. Exposure of infants to phytooestrogens from soy-based infant formula. Lancet. 1997;350:23–27. doi: 10.1016/S0140-6736(96)09480-9. [DOI] [PubMed] [Google Scholar]
- 63.Setchell KD, Zimmer-Nechemias L, Cai J, Heubi JE. Isoflavone content of infant formulas and the metabolic fate of these phytoestrogens in early life. Am J Clin Nutr. 1998;68:1453S. doi: 10.1093/ajcn/68.6.1453S. [DOI] [PubMed] [Google Scholar]
- 64.Patisaul HB, Roberts SC, Mabrey N, McCaffrey KA, Gear RB, Braun J, et al. Accumulation and endocrine disrupting effects of the flame retardant mixture firemaster((R)) 550 in rats: an exploratory assessment. J Biochem Mol Toxicol. 2013;27:124–1236. doi: 10.1002/jbt.21439. [DOI] [PMC free article] [PubMed] [Google Scholar]
- 65.Calafat AM, Koch HM, Swan SH, Hauser R, Goldman LR, Lanphear BP, et al. Misuse of blood serum to assess exposure to bisphenol A and phthalates. Breast Cancer Res. 2013;15:403. doi: 10.1186/bcr3494. [DOI] [PMC free article] [PubMed] [Google Scholar]
- 66.Coughlin JL, Winnik B, Buckley B. Measurement of bisphenol A, bisphenol A ss-D-glucuronide, genistein, and genistein 4′ss-D-glucuronide via SPE and HPLC-MS/MS. Anal Bioanal Chem. 2011;401:995–1002. doi: 10.1007/s00216-011-5151-8. [DOI] [PMC free article] [PubMed] [Google Scholar]
- 67.Doerge DR, Twaddle NC, Churchwell MI, Newbold RR, Delclos KB. Lactational transfer of the soy isoflavone, genistein, in Sprague-Dawley rats consuming dietary genistein. Reprod Toxicol. 2006;21:307–312. doi: 10.1016/j.reprotox.2005.09.007. [DOI] [PubMed] [Google Scholar]
- 68.Barker DJ. The origins of the developmental origins theory. J Intern Med. 2007;261:412–417. doi: 10.1111/j.1365-2796.2007.01809.x. [DOI] [PubMed] [Google Scholar]
- 69.Barker DJ. Fetal nutrition and cardiovascular disease in later life. Br Med Bull. 1997;53:96–108. doi: 10.1093/oxfordjournals.bmb.a011609. [DOI] [PubMed] [Google Scholar]
- 70.Barker DJ. Maternal nutrition, fetal nutrition, and disease in later life. Nutrition. 1997;13:807–813. doi: 10.1016/s0899-9007(97)00193-7. [DOI] [PubMed] [Google Scholar]
- 71.Jahan-mihan A, Smith CE, Anderson GH. Soy protein- and casein-based weaning diets differ in effects on food intake and blood glucose regulation in male Wistar rats. Nutr Res. 2011;31:237–245. doi: 10.1016/j.nutres.2011.02.006. [DOI] [PubMed] [Google Scholar]
- 72.Cederroth CR, Vinciguerra M, Kuhne F, Madani R, Doerge DR, Visser TJ, et al. A phytoestrogen-rich diet increases energy expenditure and decreases adiposity in mice. Environ Health Perspect. 2007;115:1467–1473. doi: 10.1289/ehp.10413. [DOI] [PMC free article] [PubMed] [Google Scholar]
- 73.Brown NM, Setchell KD. Animal models impacted by phytoestrogens in commercial chow: implications for pathways influenced by hormones. Lab Invest. 2001;81:735–747. doi: 10.1038/labinvest.3780282. [DOI] [PubMed] [Google Scholar]
- 74.Rossmeisl M, Rim JS, Koza RA, Kozak LP. Variation in type 2 diabetes-related traits in mouse strains susceptible to diet-induced obesity. Diabetes. 2003;52:1958–1966. doi: 10.2337/diabetes.52.8.1958. [DOI] [PubMed] [Google Scholar]
- 75.Aldinger KA, Sokoloff G, Rosenberg DM, Palmer AA, Millen KJ. Genetic variation and population substructure in outbred CD-1 mice: implications for genome-wide association studies. PLoS One. 2009;4:e4729. doi: 10.1371/journal.pone.0004729. [DOI] [PMC free article] [PubMed] [Google Scholar]
- 76.Ryan KK, Haller AM, Sorrell JE, Woods SC, Jandacek RJ, Seeley RJ. Perinatal exposure to bisphenol-a and the development of metabolic syndrome in CD-1 mice. Endocrinology. 2010;151:2603–2612. doi: 10.1210/en.2009-1218. [DOI] [PMC free article] [PubMed] [Google Scholar]
- 77.Angle BM, Do RP, Ponzi D, Stahlhut RW, Drury BE, Nagel SC, et al. Metabolic disruption in male mice due to fetal exposure to low but not high doses of bisphenol A (BPA): evidence for effects on body weight, food intake, adipocytes, leptin, adiponectin, insulin and glucose regulation. Reprod Toxicol. 2013;42:256–268. doi: 10.1016/j.reprotox.2013.07.017. [DOI] [PMC free article] [PubMed] [Google Scholar]
- 78.Patisaul HB, Mabrey N, Adewale HB, Sullivan AW. Soy but not bisphenol A (BPA) induces hallmarks of polycystic ovary syndrome (PCOS) and related metabolic co-morbidities in rats. Reprod Toxicol. 2014;49C:209–218. doi: 10.1016/j.reprotox.2014.09.003. [DOI] [PMC free article] [PubMed] [Google Scholar]
- 79.Churchwell MI, Camacho L, Vanlandingham MN, Twaddle NC, Delclos ES, et al. Comparison of lifestage-dependent internal dosimetry for bisphenol A, ethinyl estradiol, a reference estrogen, and endogenous estradiol to test an estrogenic model of action in Sprague-Dawley rats. Toxicol Sci. 2014;139:4–20. doi: 10.1093/toxsci/kfu021. [DOI] [PMC free article] [PubMed] [Google Scholar]
- 80.Biro FM, Greenspan LC, Galvez MP, Pinney SM, Teitelbaum S, Windham GC, et al. Onset of breast development in a longitudinal cohort. Pediatrics. 2013;132:1019–1027. doi: 10.1542/peds.2012-3773. [DOI] [PMC free article] [PubMed] [Google Scholar]