

Abstract
Background
Conflicting data exist regarding changes in amputation rates in patients with ulcers because of diabetes mellitus (DM) and peripheral artery disease (PAD). This study focuses on how population-based amputation rates are changing in the current treatment era.
Methods
Using the California Office of Statewide Health Planning and Development Patient Discharge database, all patients who underwent major nontraumatic lower extremity (LE) amputation in 2005 through 2011 were identified. Age-adjusted population-based amputation risk was determined by year. Gender and age trends in amputation risk were estimated separately for diabetes-related amputations and PAD-related amputations, treating all California residents as the population at risk.
Results
From 2005 to 2011, 32,025 qualifying amputations were performed in California. Of these, 11,896 were DM-associated (n = 1,095), PAD-associated (n = 4,335), or associated with both conditions (n = 6,466). PAD-associated amputation rates and combined PAD/DM-associated amputation rates have changed little since 2009 after decreasing substantially over the prior 5 years, but DM-associated amputation rates have continuously increased since 2005. California residents older than the age of 80 years had the most dramatic decrease in PAD-associated amputation rates from 2005 to 2011 (i.e., from 317 to 175 per million Californians). Men with PAD/DM had amputation rate 1.5 times higher than those of patients with PAD alone and 5 times higher than rates of DM patients. In women the difference between patient with PAD and PAD/DM was not seen; however, these rates were 2.5 times higher than patients with DM alone.
Conclusions
Preventable amputations associated with high-risk diseases are no longer decreasing despite continuing advances in care and education. Octogenarians with PAD represent the highest risk group for amputation, but DM-associated amputations have increased since 2005. Further research to understand treatment pathways for patient with LE wounds may shed light on pathways for amputation prevention in the future.
INTRODUCTION
Vascular surgeons are frequently called on to determine the cause and recommend management for lower extremity (LE) wounds. The most common etiologies for an LE wound that ultimately require amputations are neuropathy and tissue ischemia. Discerning between the 2 causes can be challenging; however, understanding the specific etiology is essential to develop treatment recommendations and predict the likelihood of an adverse event, including amputation. Currently, between 800,000 and 1.4 million people live with an amputation in the United States.1 This number is projected to increase to 2.2 million by 2020 and 3.6 million by 2050.2 Diabetes mellitus (DM) and peripheral artery disease (PAD) cause 54% of nontraumatic amputations.3
Existing studies reporting the incidence of amputations in high-risk patient are difficult to interpret. In an analysis of over 2 million hospitalizations for DM-related LE wounds, major amputations have increased by 7.7% from 2001 to 2010.4 Single institution Veterans Affairs data in patients with PAD reflect a decline in amputation rates that has plateaued, but these data are focused on patients that underwent intervention and not the incidence of the disease.5 Larger studies that have estimated amputation risk in both disease populations have typically used Medicare data because of the large cohort. Medicare data, however, only captures patients older than the age of 65 years or those with chronic diseases such as renal failure that qualify for the program before age 65. Our preliminary work with the California Office of Statewide Health Planning and Development (OSHPD) database, which captures all inpatient, ambulatory surgery, and emergency room visits throughout the state in a longitudinal fashion, has shown that 40% of patients are younger than 65. Moreover, although DM and PAD are 2 separate disease processes, there are patients with PAD that have DM. With time, all patients with DM develop some level of PAD. No epidemiologic study has captured all patients, across all age groups and payer status, which underwent amputation and separated them into the 3 disease categories of DM, PAD, or a combination of PAD/DM to determine amputation risk over time.
This study aimed to compare population-based amputation risk within the state of California during the current treatment era for high-risk patients with DM, PAD, or a combination of PAD/DM. Patients were separated into 3 distinct disease categories to estimate whether amputation risk is changing and determine in which patient subgroups risk may be changing more rapidly over time.
METHODS
This retrospective cohort study was designed to compare the incidence of amputations because of PAD, DM, or combination disease (PAD/DM) in nonfederal California hospitals from January 1, 2005 to December 31, 2011. We only included patients that had a major amputation attributable to one of the above disease processes. The Institutional Review Board for the California Health and Welfare Agency Committee for the Protection of Human Subjects approved this study.
Database
The California OSHPD database captures all nonfederal inpatient hospitalizations as part of the Patient Discharge Database (PDD). Nonfederal hospitals account for 96% of the hospitals in California. Data within the PDD links records for each patient through the use of an encrypted Social Security number called the record linkage number.6,7 For each hospitalization, data including demographics, insurance status, a principal diagnosis with up to 24 secondary diagnoses, a principal procedure, and up to 20 additional secondary procedures are collected. All medical diagnoses and procedures are coded using the International Classification of Diseases, Ninth Edition, Clinical Modification (ICD-9-CM). Each patient admission is also linked to a unique hospital identification number. This allows the admission to be joined to specific information regarding the hospital facility, including number of beds, location (rural versus urban), teaching status, and business category (public, academic, and for profit).
Patient Cohort
The index patient cohort was created by searching the PDD for principal or secondary procedure ICD-9-CM codes indicating above the ankle amputation (84.13–84.17, Table 1 Supplementary Material). All patients less than 18 years old were excluded from the study given the limited number of amputations for adolescents because of these disease patterns. The admission at the time of amputation was considered the index visit. Only patients that underwent major amputation within the first 10 days of the index visit were included. This represented 90% of the total amputation cohort. This time frame was selected as an attempt to control for patients that may have had an amputation as the result of care received during their hospitalization or a complication of a procedure rather than as a result of their underlying disease process.
Once the amputee cohort was identified, patients were separated into 1 of 3 groups, DM, PAD, or PAD/DM, based on the most likely etiology of their amputation. Patients were placed in the PAD disease category if the principal ICD-9-CM code at the time of the amputation admission was 1 for chronic PAD. Patients were also placed in this group if a nonspecific ICD-9-CM wound code was a principal diagnosis and a chronic PAD code was a secondary diagnosis. Any diagnosis code for DM in the principal or secondary position excluded patients from the PAD group and placed them in the PAD/DM group. To be included in the DM group, an ICD-9-CM code for DM needed to be in the principal diagnosis or a nonspecific wound code in the principal diagnosis with a specific DM code in any of the secondary positions. Any diagnosis code for PAD-excluded patients from this group and placed them in the PAD/DM group. Since 2008, a specific ICD-9-CM code for DM with associated arterial disease has been in place. Any patient with this code was placed in the PAD/DM group. In addition, any patient with a nonspecific wound code in the principal diagnosis with a specific PAD/DM code in the secondary diagnosis, or a combination of DM, PAD, and wound codes in any of the principal and secondary positions were included in the PAD/DM group. Patients that did not have an ICD-9-CM code for PAD, DM, or PAD/DM were excluded. Finally, any patients with an ICD-9-CM code for trauma (ICD-9-CM 800-999) and malignancy (ICD-9-CM 140-239) during the amputation admission were excluded to ensure that all patients were likely being treated for DM, PAD, or PAD/DM.
California Population Data
Vitals statistics files from the California Department of Finance8 were used to determine population-based amputation risk. This is a publicly available data file with yearly population estimates by age, race, and gender for all persons in California. Population estimates are based on the 2000–2010 the United States census data. Data were aggregated by year and age category. Persons younger than age 18 years were excluded.
Comorbidity Data and Revascularization before Amputation
We used the Elixhauser comorbidity index (Appendix)9 software to define comorbidities of the index cohort. The comorbidities of DM and PAD were excluded from the index. We also captured additional comorbid conditions not included in the index, specifically coronary artery disease (CAD), chronic obstructive pulmonary disease (COPD), cerebrovascular disease, arrhythmias, and tobacco use.
We recorded any attempt to improve blood flow for patients before major amputation. Using ICD-9-CM codes, we searched for any revascularization by either open or endovascular methods (Supplementary Material) in the 5 years before major amputation. These were categorized in a retrospective fashion by time from the amputation to the most recent revascularization.
Statistical Analysis
We determined amputation frequencies (n, %) by year from the OSHPD data. Categorical demographic data comparing the 3 disease groups were analyzed using chi-squared analysis. Continuous data were analyzed with analysis of variance, P values <0.05 were considered statistically significant. Population-based amputations and/or 1 million persons were determined by dividing the number of amputees each year by the number of Californians of the same year and multiplying by 106. Age adjustment was performed when determining overall amputation risk per year by disease category and when determining risk by gender using the aggregated California vitals statistics data. All analysis was performed using R v 3.0.1 and graphics were created using Microsoft Excel (Redmond, WA).
RESULTS
From 2005 to 2011, over 22-million inpatient admissions were documented in California (Fig. 1). Of these, 32,025 patients underwent major amputation. We excluded patients that did not have their amputation within 10 days of admission, those treated for diagnosis other than DM, PAD, or PAD/DM, and patients that underwent amputation for possible trauma or malignancy. This left 11,896 patients in the index cohort.
Fig. 1.
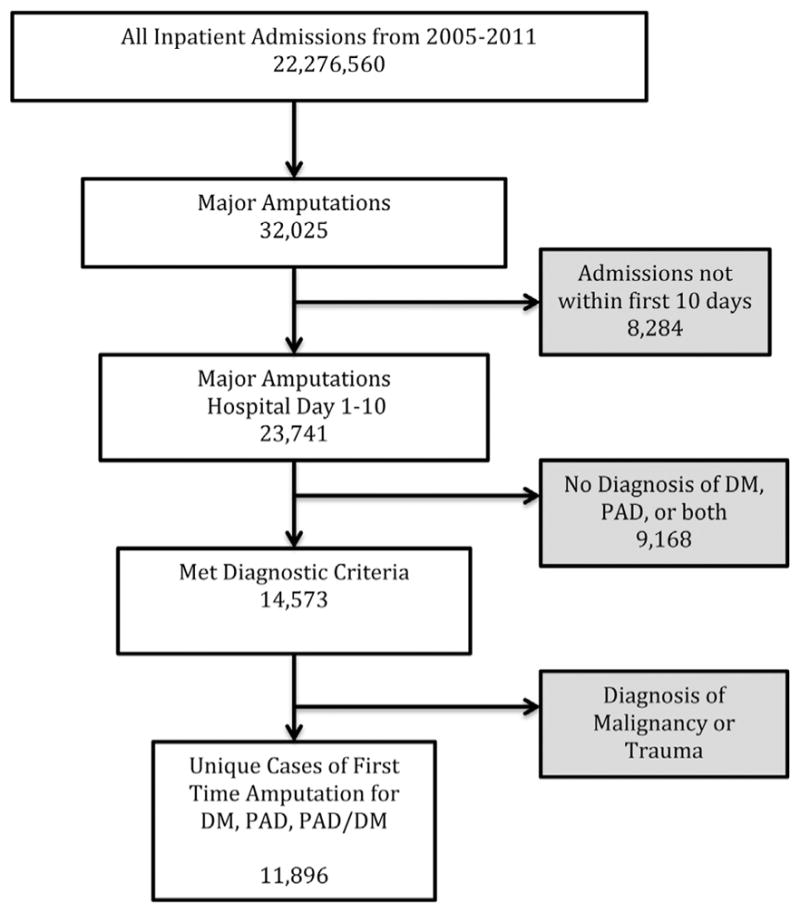
Flow diagram for selection of patients the diseases of PAD, DM, and combination disease of PAD and DM.
Demographics for the cohort are presented in Table I, but it is notable that each disease group represents a unique population and numerous significant differences exist. Specifically, patients in the DM(55 ± 12) group are on average 20 years younger than those in the PAD (75 ± 12) group, and the PAD/DM (67 ± 12) group patients split the age difference. (P = 0.001) Patients with PAD more often have Medicare (80%), whereas patients with DM are covered by private insurance (22%), part of Medi-Cal (28%), or part of the county indigent programs (10%) in California.
Table I.
Patient demographics (P values report differences between all 3 groups)
| Variable | All, n (%), mean ± SD | PAD group, n (%), mean ± SD | Diabetes group, n (%), mean ± SD | PAD/DM group, n (%), mean ± SD | P value |
|---|---|---|---|---|---|
| 11,896 | 4,335 (36) | 1,095 (10) | 6,466 (54) | ||
| Male, gender | 7,398 (62) | 2,363 (55) | 779 (71) | 4,256 (66) | <0.001 |
| Age (years) | 69 ± 14 | 75 ± 12 | 55 ± 12 | 67 ± 12 | <0.001 |
| Smoker | 1,441 (12) | 641 (15) | 156 (14) | 644 (10) | <0.001 |
| Payer category | |||||
| Medicare | 8,169 (69) | 3,479 (80) | 411 (38) | 4,279 (66) | <0.001 |
| Private coverage | 1,584 (13) | 407 (9) | 239 (22) | 932 (14) | <0.001 |
| Medi-Cal | 1,578 (13) | 382 (9) | 302 (28) | 900 (14) | <0.001 |
| Self-pay | 213 (2) | 24 (0.5) | 34 (3) | 155 (2) | <0.001 |
| County indigent program | 259 (2) | 14 (0.3) | 99 (10) | 146 (2) | <0.001 |
| Other government | 28 (0.2) | 11 (0.2) | 6 (0.5) | 15 (0.2) | 0.17 |
| Race | |||||
| White | 5,574 (47) | 2,421 (56) | 590 (54) | 2,563 (40) | <0.001 |
| Hispanic | 3,692 (31) | 877 (20) | 340 (31) | 2,475 (38) | <0.001 |
| African American | 1,794 (15) | 713 (16) | 121 (11) | 960 (15) | <0.001 |
| Asian | 537 (5) | 204 (5) | 17 (2) | 316 (5) | <0.001 |
| Other | 241 (2) | 92 (2) | 24 (2) | 125 (2) | 0.73 |
| COPD | 2,060 (17) | 1,059 (24) | 122 (11) | 879 (14) | <0.001 |
| CAD | 4,341 (36) | 1,746 (40) | 154 (14) | 2,441 (38) | <0.001 |
| Congestive heart failure | 2,905 (24) | 1,091 (25) | 155 (14) | 1,659 (26) | <0.001 |
| Dialysis | 4,481 (38) | 1,242 (29) | 333 (30) | 2,906 (45) | <0.001 |
| Psychiatric diagnosis | 497 (4) | 184 (4) | 59 (5) | 254 (4) | 0.08 |
| Depression | 1,146 (9) | 376 (9) | 135 (12) | 635 (10) | <0.001 |
| No revascularization attempt | 5,659 (48) | 1,569 (36) | 938 (86) | 3,152 (49) | <0.001 |
| Time to revascularization attempt | |||||
| 1–60 days | 3,364 (28) | 1,751 (40) | 46 (4) | 1,673 (26) | <0.001 |
| 2 months–1 year | 1,916 (16) | 744 (17) | 58 (5) | 1,114 (17) | <0.001 |
| 1–2 years | 347 (3) | 124 (3) | 17 (2) | 206 (3) | 0.01 |
| More than 2 years | 451 (4) | 147 (3) | 36 (3) | 268 (4) | 0.10 |
| In-hospital mortality | 2,770 (23) | 1,135 (26) | 102 (9) | 1,533 (24) | <0.001 |
CAD, coronary artery disease; COPD, chronic obstructive pulmonary disease.
Overall amputation risk for patients with PAD and PAD/DM decreased from 2005 to 2011, but a decline was not seen after 2009 in either group. (Fig. 2) From 2005 to 2008 age-adjusted major amputation risk for patients with PAD/DM decreased from 41 major amputations and/or million Californians to 31. Patients with PAD also saw a decline from 32 major amputations and/or million Californians in 2005 to 17 in 2009. Since 2009, major amputation risk remained similar in both PAD and PAD/DM groups. In patients with DM, however, age-adjusted major amputation risk increased slightly from 5 major amputations and/or million Californians to 6.
Fig. 2.

Age-adjusted amputation rates/1 million Californians older than the age of 18 years for patients with PAD, DM, and combined PAD and DM.
To better understand the change in amputation risk over time, we evaluated age and gender differences for each disease category. (Fig. 3) In the PAD group, the most notable decrease in amputation risk was seen in patients over the age of 80 from 2005 (314 major amputations and/or million persons) to 2009 (171 major amputations and/or million persons). From 2005 to 2008 major amputation risk for patients 70–79 also decreased (163 vs. 92, respectively). Although patients aged 65–69 (amputation risk 58 vs. 52) and <65 years old (amputation risk 7 vs. 5) have also had a decrease in major amputations from 2005 to 2011, the risk has not been as notable as the other age groups. For patients with PAD/DM, all age groups over 65 saw a substantial decrease in amputation risk from 2005 to 2011, but not as sizeable as seen in the PAD only patients. Amputation risk for PAD/DM patients >80 years of age decreased from 196 to 141 major amputations and/or million persons, whereas risk for patients 70–79 decreased from 190 to 113 major amputations and/or million persons. Finally, amputation risk for patients with DM alone varied slightly from year to year, but no single age group changed more over time than any other.
Fig. 3.

Age-divided amputation rates/1 million Californians of the same age group for patients with (A) PAD, (B) DM, and (C) combined PAD and DM. (A) PAD patients only. (B) DM patients only (Scale in patients with DM has been adjusted because of the low numbers to allow visualization of the groups). (C) Patients with PAD/DM.
Yearly amputation risk for men are higher than those for women in all disease categories. (Fig. 4) However, there is more separation between disease categories of PAD/DM and PAD in men than in women across all years. Since 2005, amputation risk for men with PAD/DM has decreased from 37 to 31 major amputations/million persons in 2011. For patients with PAD amputation risk has decreased from 25 major amputation and/or million persons in 2005 to 15 in 2011. Amputation risk for men with DM, however, has slightly increased from 6 major amputations and/or million persons in 2005 to 7 major amputations and/or million persons in 2011. Women with both PAD/DM and PAD only, on the other hand, have equal amputation risk. Both groups have had an equal decrease from 22 major amputations and/or million persons in 2005 to 15 in 2011. For women with DM, however, there has been a small increase in amputation risk from 2 major amputations and/or million persons to 3 major amputations and/or million persons.
Fig. 4.

Amputation rates/1 millions Californians of the same gender for men (A) and women (B) with PAD, DM, and combined PAD & DM. (A) Men. (B) Women.
DISCUSSION
Our study found California population-based major amputation risk for patients with PAD and PAD/DM have not decreased since 2008 and 2009, respectively. Major amputation risk for patients with DM, who have yet to develop arterial disease, have continued to increase since 2005. The current literature on amputation risk for patients with DM and PAD is conflicting. This stems in part from how patients are defined within retrospective studies and the data source. In a study of patients using the National Hospital Discharge Survey and the National Health Interview Survey, Li et al. found that nontraumatic amputation risk for patients with DM had decreased from 11.2 of 1,000 persons with DM in 1996 to 3.9 of 1,000 persons with DM in 2008 (P < 0.05). They found that amputation risk for nondiabetic patients over the same time frame had not changed substantially.10 This is in contrast to multiple other studies over a relatively similar time frame showing patients with PAD, who would have been in the nondiabetic arm of Li’s study, had a significant decrease in amputation risk.11,12 Each of these prior studies only reports on 2 of the patients populations found in our study. It was the goal of our study to use a more comprehensive dataset that captures patients across the age spectrum. By dividing patients into 1 of the 3 high-risk disease groups, we identified how amputations rates have changed over time in each disease group. Interestingly, only patients with some component of arterial disease had a decrease in major amputation rates. One potential explanation for this is wider dissemination of revascularization procedures to improve blood flow for patients with LE wounds.
Although we did show that amputation rates have decreased among patients with PAD and PAD/DM, amputation rates have remained relatively stable since 2008 in patients with PAD and 2009 in patients with PAD/DM. National amputation rates for patients with PAD, including those with DM, have been studied geographically using Medicare data. Jones et al.,13 found that in the Pacific region, which includes California, amputation rates for patients with PAD decreased from 2001–2008. Specifically, the number of amputations decreased sharply from 2006 to 2008. Unfortunately, this study did not include post-2008 data. It did, however, include the comorbidity of DM and, although only 37% of the entire PAD cohort had DM, 60% of the patients that underwent amputation had DM. Our study extends to 2011 and clearly shows that the major amputation rates are not decreasing in patients with PAD.
The most notable decrease in major amputation rates was in patients over the age of 70 with PAD. The decrease in the 70–79 age group brought amputation rates down to the same level as those of patients 60–69. Despite a dramatic decrease from 2005 to 2011 in the >80 years old group, these patients still have over 100 more amputations and/or million people a year. The dramatic decrease in amputations rates is likely because of more aggressive treatment of critical limb ischemia is older patients. In a study of over 150 octogenarians, Brosi et al.14 found that these patients had higher morbidity with surgery compared with endovascular treatment of PAD. They called for increased utilization of endovascular therapy in patients >80 years old to prevent amputation, and limit 30-day morbidity. Although age seemed to make a difference in the PAD group, a dramatic difference in major amputation rates was not seen between the various age groups in the DM or the PAD/DM group.
Finally, overall amputation rates for women were lower than men in all disease groups. Higher male amputation rates have been seen in multiple studies of patients with DM, not excluding those with some component of PAD/DM.15,16 Our data showed a decrease over time for both groups, but for male patients with PAD/DM the amputation rate was twice that of men with PAD alone in 2011. This is likely multifactorial. Patients with PAD/DM may have a different arterial disease pattern that makes them less likely to benefit from revascularization as a way to decrease amputation rates. Also, PAD/DM patients may present with more severe foot infections that are resistant to treatment and do not benefit from treatment to improve blood flow. We did not see the same difference between female patients with PAD/DM and PAD. This is possibly attributable to estrogen in female patients that helps to delay more profound arterial disease seen in men. An alternative explanation for women having lower amputation rates is possibly earlier detection and wound care. This possibility, however, has been refuted by several studies that showed women tend to be diagnosed later with more advanced forms of PAD.17,18
Our work has limitations. First, the cohort is taken from an administrative database and all of the data hinges on proper ICD-9-CM coding. No dataset can have absolutely correct coding. Although we were able to create 3 distinctive cohorts using the ICD-9-CM coding schema, some patients may have been placed in the DM group despite having undiagnosed PAD. This would bias the result toward a decrease in amputation rates, which we did not see. Second, this study is based on the population of California limiting generalizability. However, the population of California is quite similar in age and gender composition to that of the United States. For this reason, we feel trends based on age and gender could be extrapolated to the entirety of the country. Racial distribution in California is not similar to the rest of the US however. California has a higher percentage of Hispanic and Asian populations that rest of the US. This difference may actually give more insight into the racial groups of Hispanics and Asian Americans than studies from Medicare data. We adjusted yearly for the change in population, but not all persons in California are at the same risk for amputation. By creating a cohort of patients with LE wound as the denominator, we can better understand rates among patients at highest risk and assess treatment before amputations. We did collect data on revascularizations, but did not analyze how it affects amputation given the inability of this cohort to evaluate patients that did not undergo amputation. Revascularizations would likely be underestimated, however, given the inability to follow patients treated outside the state.
CONCLUSIONS
In patients with some component of arterial disease, either PAD alone or PAD/DM, amputation rates have decreased since 2005, but not changed significantly since 2009. More work, which we are performing, is needed to determine if there has been a change in treatment patterns of these patients since 2009. Moreover, we discovered that amputation rates for DM alone are increasing at a slow rate. This is especially alarming with the overall increase in DM within the United States and the increased prevalence in younger patient populations.19 The most notable decrease in amputation rates appear to be in patients with PAD and PAD/DM older than the age of 70 years, with most benefit to patients aged older than 80 years. Further work should evaluate how revascularization affects amputation rates for high-risk patients with PAD alone and PAD/DM.
Supplementary Material
Acknowledgments
Funding: The project described was supported by the National Center for Advancing Translational Sciences, National Institutes of Health, through grant number UL1 TR 000002 and linked award KL2 TR 000134.
The authors would like to thank Chin-Shang Li, Frederick Meyers, William Pevec, Sunny Kim, and Heejong Bang.
Footnotes
Supplementary data related to this article can be found at http://dx.doi.org/10.1016/j.avsg.2015.04.089.
References
- 1.Norgren L, Hiatt WR, Dormandy JA, et al. Inter-Society Consensus for the Management of Peripheral Arterial Disease (TASC II) Eur J Vasc Endovasc Surg. 2007;33(Suppl 1):S1–75. doi: 10.1016/j.ejvs.2006.09.024. [DOI] [PubMed] [Google Scholar]
- 2.Ziegler-Graham K, MacKenzie EJ, Ephraim PL, et al. Estimating the prevalence of limb loss in the United States: 2005 to 2050. Arch Phys Med Rehabil. 2008;89:422–9. doi: 10.1016/j.apmr.2007.11.005. [DOI] [PubMed] [Google Scholar]
- 3.Barmparas G, Inaba K, Teixeira PGR, et al. Epidemiology of post-traumatic limb amputation: a National Trauma Data-bank analysis. Am Surg. 2010;76:1214–22. doi: 10.1177/000313481007601120. [DOI] [PubMed] [Google Scholar]
- 4.Skrepnek G, Armstron D, Mills J. 2,500,000 troubled soles: ten year analysis of diabetic foot infections in the United States. Jasper, Alberta, Canada. Western Vascular Society Annual Meeting; 2013. [Google Scholar]
- 5.Suding PN, McMaster W, Hansen E, et al. Increased endovascular interventions decrease the rate of lower limb artery bypass operations without an increase in major amputation rate. Ann Vasc Surg. 2008;22:195–9. doi: 10.1016/j.avsg.2007.12.002. [DOI] [PubMed] [Google Scholar]
- 6.Grannis SJ, Overhage JM, McDonald CJ. Analysis of identifier performance using a deterministic linkage algorithm. Proc AMIA Symp. 2002:305–9. [PMC free article] [PubMed] [Google Scholar]
- 7.Hser YI, Evans E. Cross-system data linkage for treatment outcome evaluation: lessons learned from the California Treatment Outcome Project. Eval Program Plann. 2008;31:125–35. doi: 10.1016/j.evalprogplan.2008.02.003. [DOI] [PMC free article] [PubMed] [Google Scholar]
- 8.Finance CDo. California: 2013. Available from: http://www.dof.ca.gov/research/demographic/ [Google Scholar]
- 9.Bottle A, Aylin P. Comorbidity scores for administrative data benefited from adaptation to local coding and diagnostic practices. J Clin Epidemiol. 2011;64:1426–33. doi: 10.1016/j.jclinepi.2011.04.004. [DOI] [PubMed] [Google Scholar]
- 10.Li Y, Burrows NR, Gregg EW, et al. Declining rates of hospitalization for nontraumatic lower-extremity amputation in the diabetic population aged 40 years or older: U.S. 1988–2008. Diabetes Care. 2012;35:273–7. doi: 10.2337/dc11-1360. [DOI] [PMC free article] [PubMed] [Google Scholar]
- 11.Goodney PP, Beck AW, Nagle J, et al. National trends in lower extremity bypass surgery, endovascular interventions, and major amputations. J Vasc Surg. 2009;50:54–60. doi: 10.1016/j.jvs.2009.01.035. [DOI] [PubMed] [Google Scholar]
- 12.Holman KH, Henke PK, Dimick JB, et al. Racial disparities in the use of revascularization before leg amputation in Medicare patients. J Vasc Surg. 2011;54:420–6. doi: 10.1016/j.jvs.2011.02.035. [DOI] [PMC free article] [PubMed] [Google Scholar]
- 13.Jones WS, Patel MR, Dai D, et al. Temporal trends and geographic variation of lower-extremity amputation in patients with peripheral artery disease: results from U.S. Medicare 2000–2008. J Am Coll Cardiol. 2012;60:2230–6. doi: 10.1016/j.jacc.2012.08.983. [DOI] [PMC free article] [PubMed] [Google Scholar]
- 14.Brosi P, Dick F, Do DD, et al. Revascularization for chronic critical lower limb ischemia in octogenarians is worthwhile. J Vasc Surg. 2007;46:1198–207. doi: 10.1016/j.jvs.2007.07.047. [DOI] [PubMed] [Google Scholar]
- 15.Amin L, Shah BR, Bierman AS, et al. Gender differences in the impact of poverty on health: disparities in risk of diabetes-related amputation. Diabet Med. 2014;31:1410–7. doi: 10.1111/dme.12507. [DOI] [PubMed] [Google Scholar]
- 16.Tang ZQ, Chen HL, Zhao FF. Gender differences of lower extremity amputation risk in patients with diabetic foot: a meta-analysis. Int J Low Extrem Wounds. 2014;13:197–204. doi: 10.1177/1534734614545872. [DOI] [PubMed] [Google Scholar]
- 17.Nael R, Montgomery PS, Scott KJ, et al. Gender differences in the prevalence and management of metabolic syndrome and its components in patients with peripheral arterial disease. Angiology. 2011;62:657–61. doi: 10.1177/0003319711404025. [DOI] [PMC free article] [PubMed] [Google Scholar]
- 18.Barochiner J, Aparicio LS, Waisman GD. Challenges associated with peripheral arterial disease in women. Vasc Health Risk Manag. 2014;10:115–28. doi: 10.2147/VHRM.S45181. [DOI] [PMC free article] [PubMed] [Google Scholar]
- 19.Craig ME, Jefferies C, Dabelea D, et al. Definition, epidemiology, and classification of diabetes in children and adolescents. Pediatr Diabetes. 2014;15(Suppl 20):4–17. doi: 10.1111/pedi.12186. [DOI] [PubMed] [Google Scholar]
Associated Data
This section collects any data citations, data availability statements, or supplementary materials included in this article.