Abstract
Diffusion MRI tractography provides a non-invasive modality to examine the human retinofugal projection, which consists of the optic nerves, optic chiasm, optic tracts, the lateral geniculate nuclei (LGN) and the optic radiations. However, the pathway has several anatomic features that make it particularly challenging to study with tractography, including its location near blood vessels and bone-air interface at the base of the cerebrum, crossing fibers at the chiasm, somewhat-tortuous course around the temporal horn via Meyer’s Loop, and multiple closely neighboring fiber bundles. To date, these unique complexities of the visual pathway have impeded the development of a robust and automated reconstruction method using tractography. To overcome these challenges, we develop a novel, fully automated system to reconstruct the retinofugal visual pathway from high-resolution diffusion imaging data. Using multi-shell, high angular resolution diffusion imaging (HARDI) data, we reconstruct precise fiber orientation distributions (FODs) with high order spherical harmonics (SPHARM) to resolve fiber crossings, which allows the tractography algorithm to successfully navigate the complicated anatomy surrounding the retinofugal pathway. We also develop automated algorithms for the identification of ROIs used for fiber bundle reconstruction. In particular, we develop a novel approach to extract the LGN region of interest (ROI) based on intrinsic shape analysis of a fiber bundle computed from a seed region at the optic chiasm to a target at the primary visual cortex. By combining automatically identified ROIs and FOD-based tractography, we obtain a fully automated system to compute the main components of the retinofugal pathway, including the optic tract and the optic radiation. We apply our method to the multi-shell HARDI data of 215 subjects from the Human Connectome Project (HCP). Through comparisons with post-mortem dissection measurements, we demonstrate the retinotopic organization of the optic radiation including a successful reconstruction of Meyer’s loop. Then, using the reconstructed optic radiation bundle from the HCP cohort, we construct a probabilistic atlas and demonstrate its consistency with a post-mortem atlas. Finally, we generate a shape-based representation of the optic radiation for morphometry analysis.
Keywords: Retinofugal Pathway, Vision, Multi-Shell, HARDI, FOD, Tractography
Introduction
There are over 285 million people worldwide suffering from visual impairment, ranging from various forms of diminished vision to complete blindness (Congdon et al., 2004). Obtaining in vivo mapping of the retinofugal pathway, which consists of the optic nerves, optic chiasm, optic tracts, lateral geniculate nuclei (LGN), and the optic radiations, can improve our understanding of the impact of retinal disease on white matter connections and provide anatomical measurements to gauge or perhaps predict the effect of sight-restoration treatments such as electronic retina prostheses (Humayun et al., 2012; Stingl et al., 2013; da Cruz et al., 2013) and gene therapy (Jacobson et al., 2012; Schwartz et al., 2012). Further, in vivo mapping of the human retinofugal pathway can be highly valuable for brain tumor resection and epilepsy surgical planning (Lilja & Nilsson, 2015; Sun et al., 2011; Yogarajh et al., 2009;) and for monitoring the progression of neurological diseases such as multiple sclerosis (Reich et al., 2009) and Alzheimer’s disease (Hinton et al., 1986).
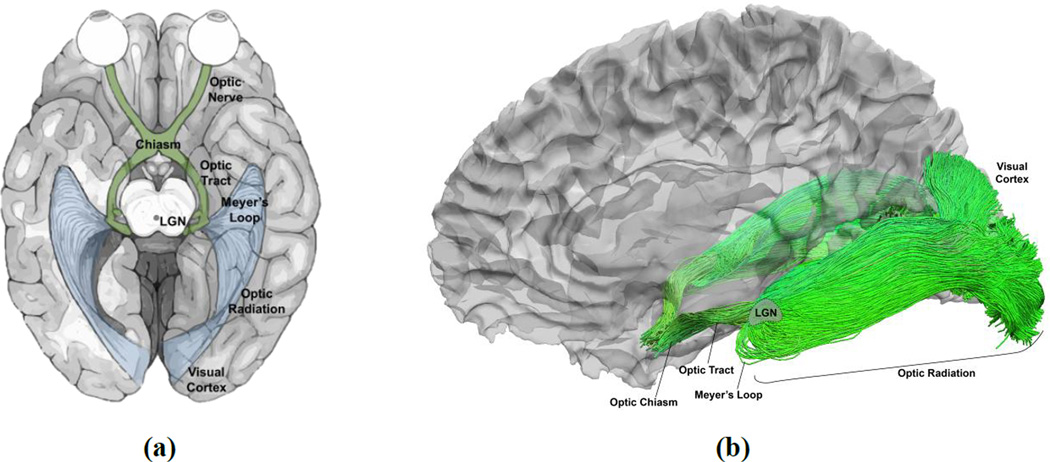
The retinofugal pathway connects the retina to the primary visual cortex (V1) through the lateral geniculate nucleus (LGN). As illustrated in Figure 1 (a), nerve fibers from the retina, forming the optic nerve, partially decussate at the optic chiasm to become the optic tract, and synapse on neurons in the LGN. The LGN is connected to V1 via the optic radiation. As observed in various post-mortem studies (Ebeling & Reulen, 1988; Bürgel et al., 1999; Rubino et al., 2005; Choi et al., 2006; Peltier et al., 2006), the optic radiation on each side of the brain hemisphere forms a contiguous sheet-like structure of retinotopically organized fibers traveling from the LGN to the visual cortex. The optic radiation is often thought of as being composed of three sub-bundles: superior, central, and inferior, which correspond to the inferior, foveal, and superior part of the visual field, respectively. The inferior bundle contains Meyer’s loop, which courses anteriorly from the LGN around the temporal horn before extending posteriorly toward the visual cortex (Meyer, 1907).
Figure 1.
Major components of the human retinofugal pathway and tractography-based reconstruction using multi-shell HARDI data. (a) An illustration of the retinofugal pathway. (b) The human retinofugal pathway, excluding the optic nerves, reconstructed with our FOD-based tractography method.
The clinical importance and unconventional trajectory of the retinofugal pathway have caused it to be the subject of several previous investigations. With the advancement of diffusion MRI (dMRI), there has been increasing interest in studying the human visual pathway in vivo. One milestone in dMRI has been the development of diffusion tensor imaging (DTI) (Basser et al., 1994; Basser & Jones, 2002), which enables the use of streamline tractography to study brain connectivity (Mori et al., 1999). Early attempts to reconstruct the visual pathway using tractography were performed using tensor modeling and deterministic streamline tractography to extract the optic radiations (Yamamoto et al., 2005; Nilsson et al., 2007; Hofer et al., 2010; Wu et al., 2012). These methods relied on manual selection of regions of interest (ROIs) for tractography seeding and were limited to studies of small sample sizes. The tensor model and deterministic propagation algorithms further limited the reconstruction of Meyer’s loop. When compared with post-mortem dissection studies (Ebeling & Reulen, 1988), tensor-based and deterministic methods significantly underestimate the anterior extent of the Meyer’s loop (Sherbondy et al., 2008).
Recent studies have used probabilistic tractography to better capture Meyer’s loop. On a sample of 8 subjects, Sherbondy et al. (2008) proposed a novel algorithm for optic radiation reconstruction using probabilistic tractography, resulting in improved distance metrics for Meyer’s loop compared to dissection studies. The drawback of this method was that it relied heavily on manual ROI delineation and individualized parameter tuning, making it difficult to apply to large scale studies. On a sample of 13 subjects, Benjamin et al. (2014) studied the manual placement of multiple seed ROIs in white matter around the LGN for the reconstruction of each component of the optic radiation. The final bundle was formed by combining the components, but the typical final product obtained in that study did not form the expected continuous sheet representation of the optic radiation. Asymmetry of the left and right Meyer’s loop was studied by Dreessen de Gervai et al. (2014) with the probabilistic tractography tool in MedINRIA (Fillard et al., 2007) on a cohort of 20 healthy subjects. Three sub-bundles of the optic radiation were computed separately with different inclusion ROIs that were manually placed around the LGN. Distance to the temporal pole, temporal horn of the ventricle, and uncinate fasciculus were used for measuring asymmetry. While a leftward asymmetry was found, the reported distance measures deviated dramatically from post-mortem studies. For example, mean distance to the temporal pole was almost 16mm larger than the results reported in postmortem dissection studies (Ebeling & Reulen, 1988). On a sample of 20 patients, a recent study by Lim et al. (2015) developed a probabilistic tractography method for optic radiation reconstruction based on constrained spherical deconvolution (CSD) (Tournier et al., 2007). This study utilized data collected via common clinical scan protocols (30 gradient directions, single b-value, voxel size 2.5×2.5×2.5mm) and demonstrated feasibility for temporal lobe surgery planning.
Other previous works have computed regional probability maps as the final representation of the optic radiation (Ciccarelli et al., 2005; Bassi et al., 2008). In Yogarajah et al. (2009), probabilistic tractography was applied to compare the optic radiation between patients with epilepsy and controls, and study the correlation between the anterior extent of the Meyer’s loop and surgical outcome. Specifically, multi-fiber modeling was used for probabilistic tractography (Parker et al., 2003), but the process still depended on manual selection of inclusion and exclusion ROIs during the tractography process. This method was also used in (Dayan et al., 2013) to study the development of the optic radiation. An image registration based method to warp the optic radiation regions onto intra-operative space was proposed by Daga et al. (2012) to localize the optic radiation during neurosurgery. Clatworthy et al. (2010) proposed an automated method for optic radiation reconstruction based on probabilistic tractography in FSL (Behrens et al., 2003). This method used a post-mortem atlas for automated seed region selection, but the seed regions were concentrated in white matter regions in the optic radiation rather than the LGN, which limited its ability to reconstruct Meyer’s loop. For the above methods, the optic radiation was represented as a probabilistic regional map rather than as fiber tracts, which may be sufficient when obtaining certain regional statistics such as mean FA, but is limited in terms of more detailed geometric analysis such as the relation between the spatial distribution of the tracts and the retinotopic mapping of the visual field on cortex.
A major reason for the unsatisfactory performance of many previous methods in reconstructing an anatomically faithful representation of the optic radiation is the limitation of the tensor model in resolving fiber crossings, which are almost ubiquitous in the brain. Considerable technical advances in image acquisition in the last decade have made high angular resolution diffusion imaging (HARDI) more practical in large scale brain imaging studies. More recently, high resolution, multi-shell HARDI has become increasingly popular, especially with the public release of such data from the Human Connectome Project (HCP) (Van Essen et al., 2012; Toga et al., 2012). Using multiband acceleration, a three-shell, 270-direction dMRI acquisition can now be completed in a half-hour acquisition. Along with the advances in HARDI, more sophisticated fiber orientation models such as the fiber orientation distribution (FOD) have been developed to model fiber crossings within each voxel. Mathematically, the FOD is a non-negative function defined on the unit sphere with its values representing the probability of fiber tracts along each direction (Anderson 2005; Tournier et al., 2007). It is related but different from the orientation distribution function (ODF), which is computed with a series of approximation steps in q-ball imaging (Tuch 2004). The relation of FOD and dMRI signal is modeled directly with a convolution-based forward model, and solved with spherical deconvolution. Compared with tensor mixture models (Behrens et al., 2003; Peled et al., 2006), the FOD has the flexibility to represent arbitrary fiber configurations without the need of specifying the number of fiber crossings a priori. The numerical solution of the FOD is also more tractable as it typically consists of devolution steps that are quadratic or convex. For the reconstruction of FODs from multi-shell HARDI, we recently developed a novel algorithm that can compute sharp FODs with high order spherical harmonics (SPHARMs) from data acquired with arbitrary number of shells and gradient directions (Tran & Shi, 2015).
Building upon these recent advances in multi-shell HARDI, in this work we develop a novel and fully automated method for visual pathway reconstruction. For the modeling of fiber crossings, we use multi-shell HARDI data from the HCP to compute FODs with high order SPHARMs, which provides a sharp representation of fiber directions at each voxel. This greatly enhances our ability of capturing Meyer’s loop in the temporal stem where multiple major fiber bundles cross (Figure 1 (b)). Our system is fully automated as it automatically identifies all ROIs used for the extraction of the fiber bundles, including a novel method for the definition of the LGN ROI for optic radiation reconstruction. To do this, we compute a fiber bundle from the optic chiasm (OC) to the visual cortex with strong curvature constraints, then use shape analysis of the thalamus to automatically delineate an ROI for seeding another round of tractography from LGN to V1. One drawback in previous attempts to compute the optic radiation as three separate sub-bundles was that large gaps separated the sub-bundles and they failed to merge and form the optic radiation as a single sheet-like structure. With a single LGN seed region, our method reliably reconstructs the optic radiation in a way that respects this geometric requirement. Segmentation of the optic radiation into superior, central, and inferior sub-bundles is done post-reconstruction based on a retinotopy template of V1.
We demonstrate the robustness of our method by applying it to the large scale HCP data. Through the use of retinotopic mapping results on cortical surfaces, our method produces highly organized fiber tracts that respect the retinotopic distribution of the optic radiation. Distances from the anterior tip of the Meyer’s loop to the temporal and occipital poles are measured to demonstrate the consistency with post-mortem results. We also compute a probabilistic atlas and compare it with a post-mortem atlas to show that our results are highly comparable. To study the morphometry of fiber bundles, we convert them into genus-zero surface presentation. As a demonstration, we use the surface representation of the optic radiations to study its asymmetry across population using HCP data.
2. Methods and Materials
2.1 MRI data from HCP
In this work, we use the T1-weighted structural MRI and multi-shell HARDI data released from Q1 to Q3 by the HCP. The T1-weighted MRI has an isotropic spatial resolution of 0.7mm. The dMRI data has an isotropic spatial resolution of 1.25mm. The dMRI protocol was designed to acquire data with three b-values (1000, 2000, 3000 mm2/s) from 270 gradient directions. Among the 225 subjects included in the Q1–Q3 release, 215 of them completed both T1 and dMRI scans. Overall 208 of the 215 subjects have complete demographic information, and include 74 males and 134 females with an age range of 22 to 36 years old. For the multi-shell HARDI data, 201 subjects have the complete data from 270 gradient directions, 13 subjects have data from 179 directions, and one subject has data from 89 directions. We use data from these 215 subjects to develop and test our visual pathway reconstruction system.
2.2 FOD computation from multi-shell HARDI data
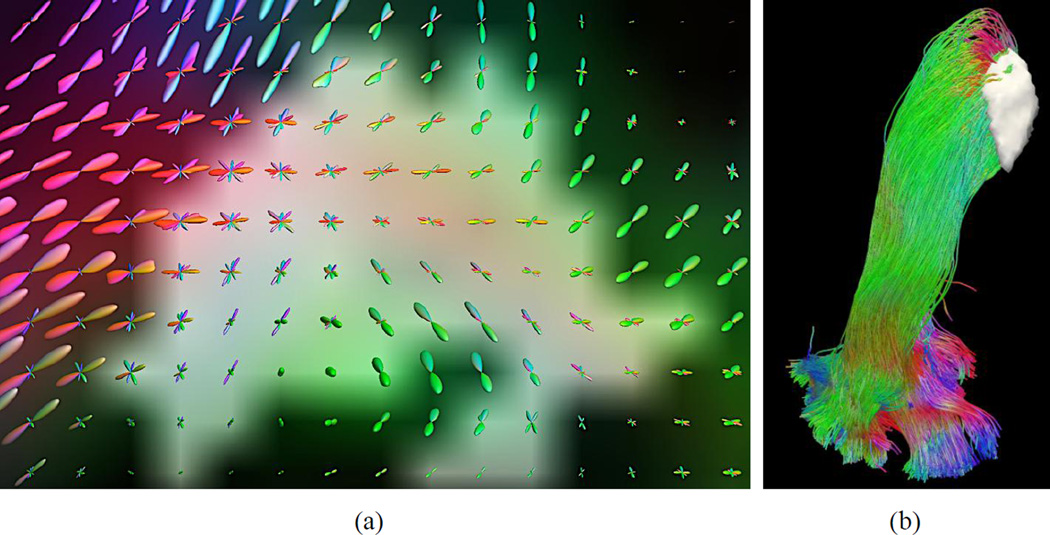
FOD models are computed at each voxel to represent the probability of fiber bundles in each direction. We use a novel algorithm we developed recently to compute FODs from multi-shell HARDI data (Tran & Shi, 2015). This algorithm solves an adaptive energy minimization problem to jointly estimate FODs and compartment parameters from diffusion imaging data. It can be applied to data collected from arbitrary acquisition schemes. For the HCP data, the FODs are represented with spherical harmonics (SPHARM) up to the 16th order. As an illustration, Figure 2(a) shows the FODs computed in the vicinity of the LGN (Figure 2(b)). Because the SPHARM representation is fully compatible with previous works on FOD modeling, we can utilize existing tools for tractography analysis. In this work, we use the probabilistic tractography tool in MRTrix (Tournier et al., 2012) to perform tractography using the calculated FODs.
Figure 2.
FODs for the representation of crossing fibers in the vicinity of the retinofugal pathway. (a) FODs in the neighborhood of the LGN as highlighted in the white gray region. (b) The reconstructed optic radiation with the overlay of the LGN ROI (white gray surface).
2.3 Fiber Bundle Reconstruction
2.3.1 Overall summary
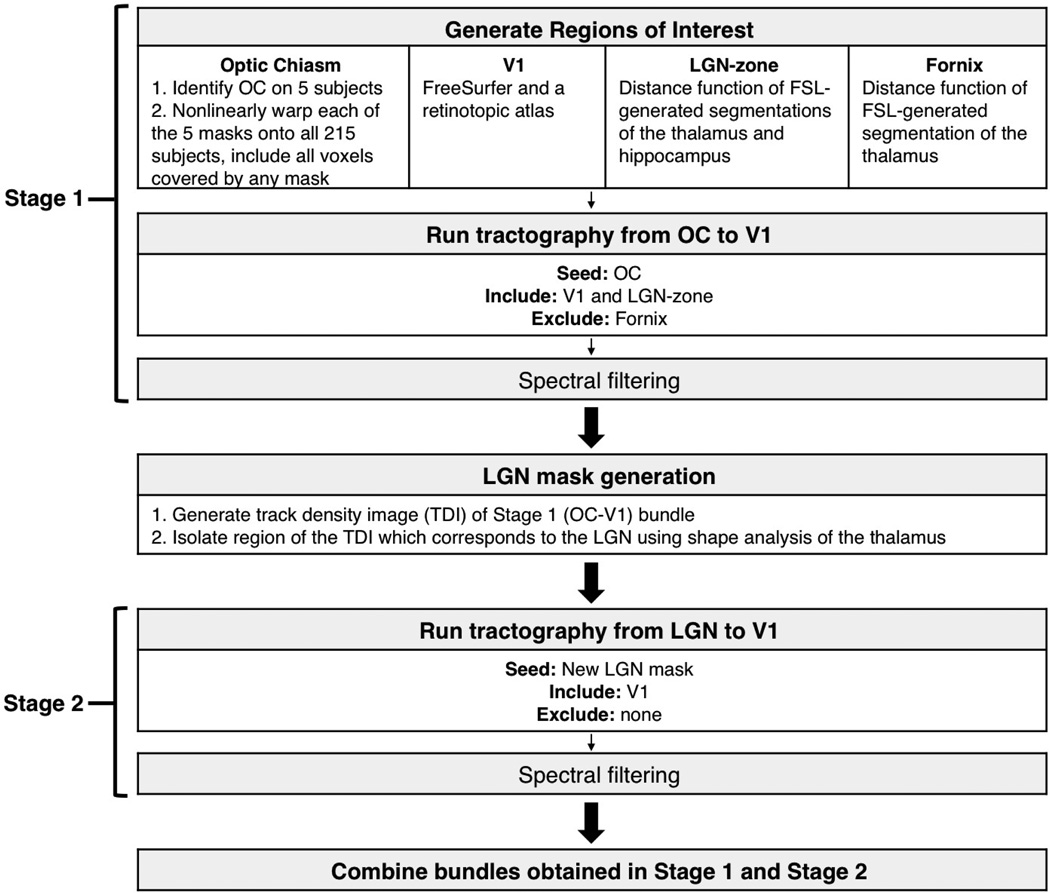
A flowchart of the major processing steps of our reconstruction method is shown in Figure 3. Briefly, probabilistic tractography was performed in two stages and utilized automated image registration and shape analysis for generation of ROIs. Spectral filtering was used to remove outlier tracts after each stage of tractography. The results from the two stages were then merged to form a fiber bundle representation of the complete pathway.
Figure 3.
A summary of the major processing steps in our automated method for retinofugal pathway reconstruction.
2.3.2 Automated delineation of optic chiasm (OC)
For visualization and ROI delineation, we define and calculate a Mean Fiber Direction (MFD) image from the FOD. At each voxel, the MFD is a weighted average of the fiber direction defined as follows:
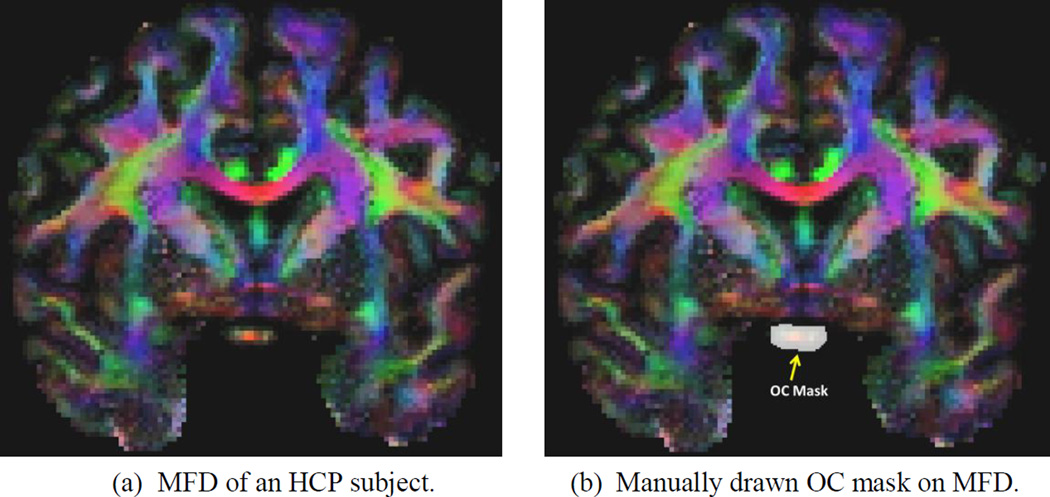
where S denotes the top half of the unit sphere with z>0 and x̱ S. Because the FOD is symmetric with respect to the origin of the unit sphere, we only integrate over the top half of the unit sphere to compute the MFD. As shown in Figure 4(a), the MFD gives a colored representation of the fiber directions that are convenient for the manual identification of ROIs during atlas construction.
Figure 4.
An illustration of the MFD image and its application in manually delineating the OC masks, which will then be used as atlases in automated OC ROI generation via label fusion.
To automatically generate the OC mask for any subject, we first manually draw the mask on five randomly selected subjects using the MFD image. An example of the manually drawn OC mask is shown in Figure 4 (b). Following the label fusion idea (Rohlfing et al., 2004; Sabuncu et al., 2010;Wang et al., 2013), we use the ANTS software (Avants et al., 2008) to compute nonlinear warps that align the MFD image of the atlases with the MFD of a new, different subject. The OC mask of the new subject is then obtained by fusing the five warped atlas masks. To ensure sufficient coverage of the OC, we include all voxels covered by any warped atlas mask. While this could cause the over-inclusion of neighboring voxels outside of the OC in the ROI, their impact on fiber tracking are attenuated because the OC is in a relatively isolated location in the brain.
2.3.3 ROIs defined via T1-weighted MRI processing
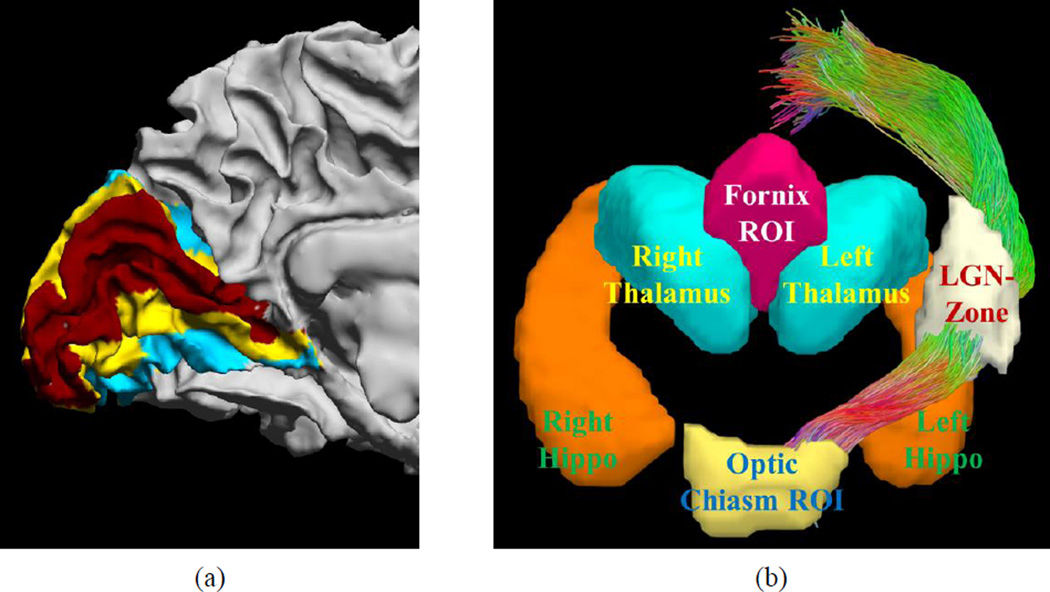
The optic radiation projects to the primary visual cortex (V1) around the calcarine fissure. To automatically extract the V1 ROI, we use the retinotopic mapping method developed by Benson et al. (2012 & 2014). This method first uses FreeSurfer (Dale et al., 1990) to extract the cortical surfaces from T1-weighted MRI, and then warps a retinotopic atlas to the subject space with spherical registration (Fischl et al., 1999). It not only produces V1, V2, and V3 parcellation of the visual cortex (Figure 5 (a)), but also generates eccentricity and angular maps that are useful when examining the retinotopic organization of the reconstructed optic radiation. To use the V1 label as an ROI for tractography, we convert it to an ROI in the voxel space as the collection of voxels within a distance of 3mm to the V1 region on the cortex.
Figure 5.
Automatically generated ROIs for fiber bundle reconstruction. (a) Visual areas map on the cortex: Red: V1, Yellow: V2, Cyan: V3. (b) ROIs for fiber bundle reconstruction.
We also segment the thalamus and hippocampus automatically from the T1 image with the FIRST tool of FSL (Patenaude et al., 2011). The surface representation of the thalamus and hippocampus are computed in a way that ensures smoothness and correct topology (Shi et al., 2010). The signed distance function (SDF) (Osher & Fedkiw, 2003) of the thalamus and hippocampus are then computed to define an inclusion ROI based on the relation of the LGN, thalamus, and hippocampus (Horton et al., 1990; Saeki et al., 2003). For a given surface, the SDF is a function defined over the whole image volume that is negative inside the surface and positive outside the surface. At each voxel, the absolute value of the SDF equals its distance to the closest point on the surface. Let SDFLThal and SDFLHippo denote the SDF of the left thalamus and hippocampus, SDFRThal and SDFRHippo denote the SDF of the right thalamus and hippocampus, we define the inclusion ROI for the left and right LGN, which we denote as the “LGN-zone” that should contain the LGN. The left LGN-zone is defined as follows:
where and denote the partial derivative of a function with respect to the x- and z- direction. The right LGN-zone is defined as follows:
We chose the threshold parameter THDLGN based on the expected size of the LGN, which is approximately of size: 5×6×9mm3 (Horton et al., 1990; Saeki et al., 2003). This corresponds to a diagonal length of 12mm. We allow a 3mm relaxation of this length and select THDLGN as 15mm.
Using the SDF of the left and right thalamus, we also define an exclusion ROI to prevent the tract going through the fornix. The fornix-exclusion-ROI is defined as:
This mathematical definition encodes the anatomical relation between the fornix and the thalamus. When the fornix moves from the hippocampus toward the frontal lobe, it forms an arch-like shape. The above equations describe that this arch is superior and close to both thalami along the middle plane between the left and right thalamus. The threshold THDFornix is chosen as 15mm in our experiments.
All of the ROIs computed above are defined in the space of the T1-weighted MRI. To use them as inclusive or exclusive ROIs for tractography, we warp them to the diffusion MRI space using the ANTS software to compute a nonlinear warp between the T1-weigthed MRI and the B0 image of the diffusion MRI based on the mutual information cost function. After that, all of the ROIs are then transformed to the diffusion MRI space for FOD-based tractography and fiber bundle reconstruction (Figure 5 (b)).
2.3.4 Stage 1: OC to V1 bundle reconstruction for LGN identification
Anatomically, the optic tract begins at the optic chiasm and ends at the LGN. The optic radiation begins at the LGN and ends at the primary visual area (V1). However, due to the macroscopic resolution of MRI, we assume that the optic tract and the straight-shot portions of the optic radiation (i.e. the central and superior optic radiation) can be represented as one continuous bundle in Stage 1 of processing. This allows for the use of tractography to reconstruct a direct OC-to-V1 bundle which will necessarily include the LGN along its path. This bundle can then be used to generate an LGN mask for a more anatomically accurate reconstruction of the optic radiation using the LGN as the seed region in Stage 2 of processing, as described in the following section.
Starting from the OC mask as the seed region, we begin FOD-based probabilistic tractography on each hemisphere separately. There are two inclusion ROIs: V1 and the LGN-zone, and one fornix-exclusion-ROI (Figure 5). The curvature radius parameter of MRTrix used in this stage is 2mm. We set the target number of tracts as 1000.
Spectral filtering is then applied to remove outlier tracts and generate a compact fiber bundle (O’Donnell & Westin, 2007; Li et al., 2009). Specifically, let be the set of fiber lines generated from tractography. The first step of spectral filtering is to define an affinity matrix W of size with its element defined as Wij = e−d(Ci,Cj)2/σ2 where is the distance between two curves and σ is the scale parameter. K-means clustering is then performed in the space spanned by the first N eigenfunctions computed by solving the following equation Lx = λDx, where D = diag(W) and L=D−W. While there is no theoretical guidance on the choice of N, we find in our practice a choice of N=20 provides satisfactory results. For K-means clustering, we set the maximum number of clusters as 10, and remove clusters with less than 1/30th number of the total tracts.
2.3.5 LGN mask generation
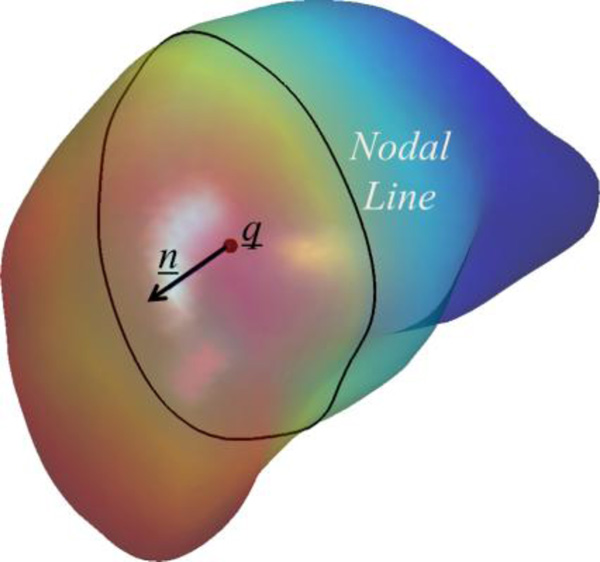
Assuming that the LGN is located in the region of the posterior thalamus along the path of the resultant OC-to-V1 fiber bundle (Sherbondy et al. 2009), we then apply intrinsic shape analysis to locate it. With a surface representation of the thalamus, we use the nodal line of its first non-constant Laplace-Beltrami eigenfunction to describe the posterior position of the LGN relative to the thalamus body (Lai et al., 2009). As shown in Figure 6, this function provides an intrinsic description of the anterior-posterior trend of the thalamus surface. The nodal line is the zero level-set of the eigenfunction and it intrinsically divides the thalamus surface into the anterior and posterior parts. To extend this anterior-posterior description on the surface to the volume around the thalamus, we fit a plane P to the nodal line to define the posterior portion of the thalamus in the 3D space. Let q̱ denote the mean position of the nodal line of the eigenfunction. This plane P passes q̱ and minimizes the distance to all points on the nodal line. Let ṉ be the normal direction of this plane that points toward the anterior end of the thalamus. For a point x̱ in the thalamus, we calculate its projection along the line determined by q̱ and ṉ as follows
and determine that it belongs to the posterior portion of the thalamus if proj(x̱)<0. Let α denote the minimal value of the projection for all the points in the thalamus. The LGN ROI is defined as the portion of the fiber bundle between the two planes proj (x̱) = 0 and proj(x̱) = α. To generate a voxel-based ROI, we convert the fiber bundle from OC to V1 to a tract density image (TDI) (Calamante et al., 2010), where the value of each voxel represents the number of fiber tracts passing through it. Let TDIoc-v1 denote this TDI image. We then define the LGN ROI as composed of voxels that satisfies
Figure 6.
An illustration of the intrinsic shape analysis results of the left thalamus of an HCP subject. The thalamus surface is colored with the Laplace-Beltrami eigenfunction and its nodal line is plotted as the black contour on the surface. The centroid of the nodal line and the normal direction are also plotted.
Across the 215 HCP subjects, the volume of the resultant LGN ROI is 1113 ± 214 mm3, which is much larger than the LGN volume (91–157 mm3) as found in dissection studies (Andrews et al. 1997). The large size of the ROI, along with the laminar organization of the LGN into layers that each receive input from the entire visual field, indicate that the LGN ROI generated by our method should provide sufficient coverage for its use as the seed region for the next stage of tractography.
2.3.6 Stage 2: reconstruction of the optic radiation from LGN to V1
Using the LGN ROI as the seed region and the V1 ROI as the target ROI, we run FOD-based probabilistic tractography to reconstruct the optic radiation. To capture Meyer’s loop, the curvature radius parameter in MRTrix is reduced to 1mm, allowing for the sharp curve of the inferior portion of the optic radiation as it travels around the temporal horn. For a dense coverage of the optic radiation, we set the target tract number as 25,000. Outliers from the reconstructed optic radiation are removed with the same spectral filtering approach as described in section 2.3.4 to generate a clean fiber bundle. After merging the fiber bundles from the first and second stage, we obtain the final bundle representation of the retinofugal pathway from optic chiasm to the primary visual cortex.
2.4 Anatomical Measurements
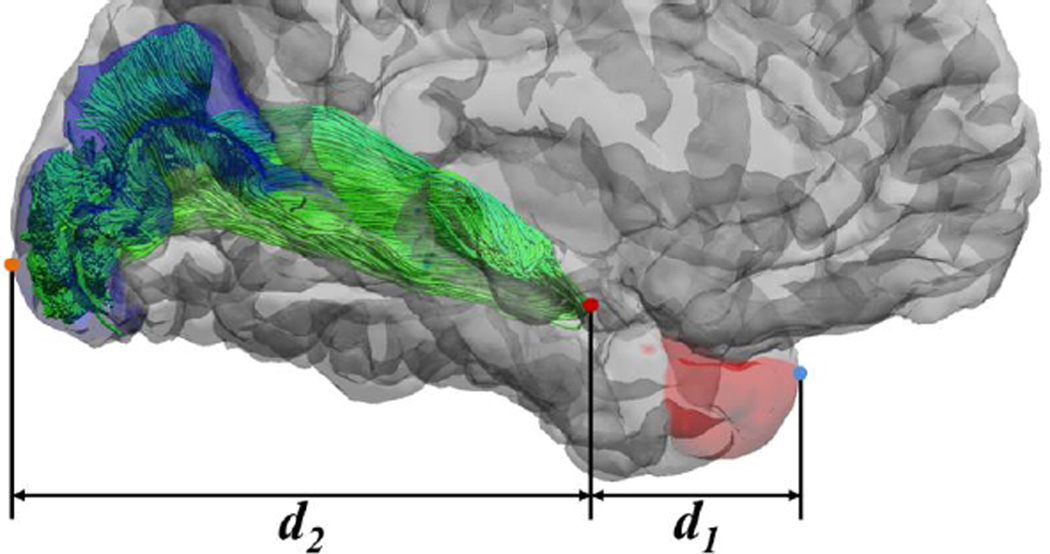
All HCP images have been AC-PC aligned in preprocessing, which allows for automated anatomical measurements that are comparable to the post-mortem dissection study (Ebeling & Reulen, 1988). As shown in Figure 7, three landmark points were automatically identified for distance measurements. For the tip of Meyer’s loop, we identify it as the most anterior point on the optic radiation bundle in the AC-PC aligned space. For the temporal pole landmark, we use the most anterior vertex in the FreeSurfer temporal pole ROI. For the occipital pole landmark, we use the most posterior vertex of the FreeSurfer V1 ROI. Following the method in Ebeling & Reulen (1988), we then calculate the distance d1 between the anterior tip of Meyer’s loop and the temporal pole as the absolute difference of the y-coordinates of their corresponding landmarks. The distance d2 from Meyer’s loop to the occipital pole is calculated similarly.
Figure 7.
An illustration of the distances to the temporal and occipital poles. Both the volumetric and dMRI data in HCP are AC-PC aligned. With FreeSurfer, we automatically generate the labels for the temporal pole (red area) and V1 area (blue area), which allows the automated generation of the most anterior point of the temporal pole (blue dot) and the most posterior point of the occipital pole (brown dot). As illustrated above, distances from the most anterior point of the optical radiation (red dot) to the temporal and occipital pole are then calculated to compare with post-mortem results of (Ebeling & Reulen, 1988). Here d1 and d2 denote the absolute difference of the y-coordinate from the tip of the Meyer’s loop to the temporal pole and occipital pole, respectively.
3. Results
3.1 HCP results
We applied our method to dMRI data released during the first three quarters of the Human Connectome Project (HCP). Overall there are 215 HCP subjects in this cohort and our method successfully completed the reconstruction for all subjects in both cerebral hemispheres. All computations were run on LONI Pipeline (Dinov et al., 2011). Most of the computational cost was devoted to cortical surface and FOD reconstruction, which combine for around 30 hours of CPU time for each subject. Once this was done, it took around 3 hours to compute the ROIs and run FOD-based tractography to finish the retinofugal pathway reconstruction.
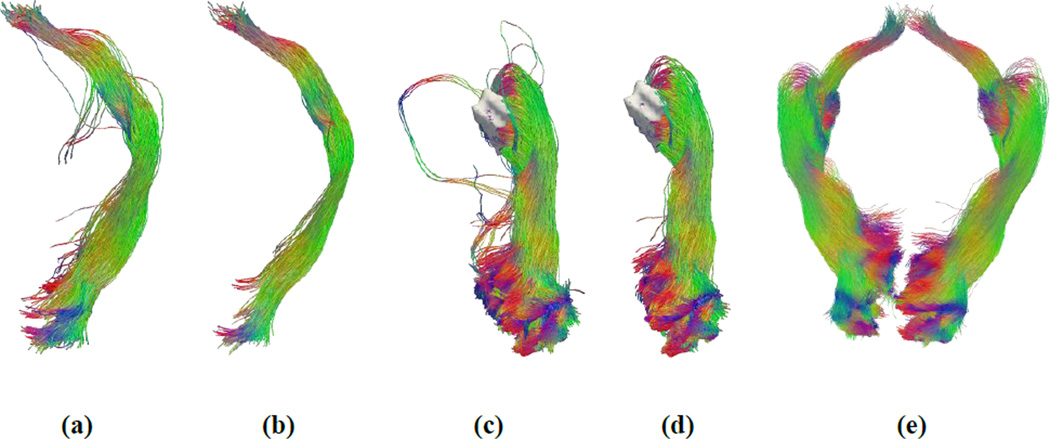
Figure 8 shows the fiber bundle reconstruction results generated by the intermediate steps of our method. Figure 8(a) shows the fiber bundle that connects the OC and V1 with strong curvature constraints as described in section 2.5. After spectral filtering, a clean bundle was obtained as shown in Figure 8(b). The optic tract from OC to LGN is part of this bundle and can be obtained by truncating this bundle at the LGN. The automatically extracted LGN mask and the fiber bundle from the LGN to V1, obtained with weak curvature constraints as described in section 2.6, are shown in Figure 8(c). After the removal of outlier curves with spectral filtering, a clean reconstruction of the optic radiation was obtained and shown in Figure 8(d). Finally, we merge the results from the first and second stages to provide a complete representation of the visual pathway from OC to V1 as shown in Figure 8(e). More representative reconstruction results of HCP subjects are shown in Figure 9. These images demonstrate that our method is able to successfully compute a sheet-like, anatomically plausible reconstruction of human visual pathway, including Meyer’s loop.
Figure 8.
Fiber bundle reconstruction results from different steps of the reconstruction system. (a) Fiber bundle connecting the OC and V1 with strong curvature constraints as described in section 2.5. (b) OC to V1 after spectral filtering. (c) The automatically extracted LGN mask (white surface) and the fiber bundle from the LGN to V1, obtained with weak curvature constraints as described in section 2.6. (d) LGN to V1 after spectral filtering. (e) After merging the results from the first (b) and second (d) stages from OC to V1 for both the left and right hemispheres.
Figure 9.
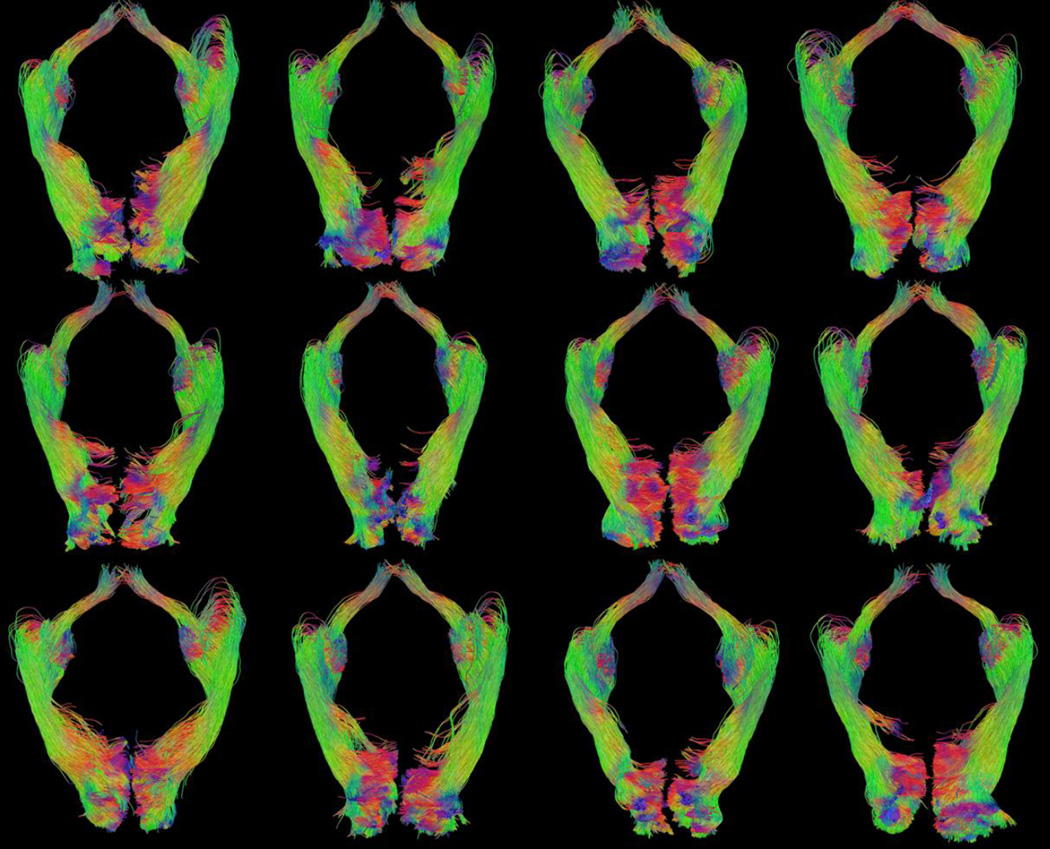
Examples of retinofugal visual pathway reconstruction results from 12 different HCP subjects. All tracts were rendered from the inferior-posterior view. (Image top = anterior, image left = right hemisphere)
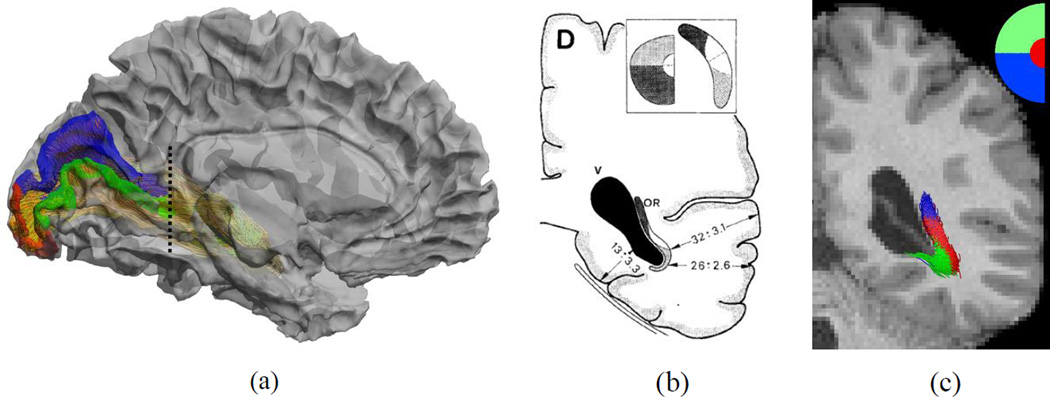
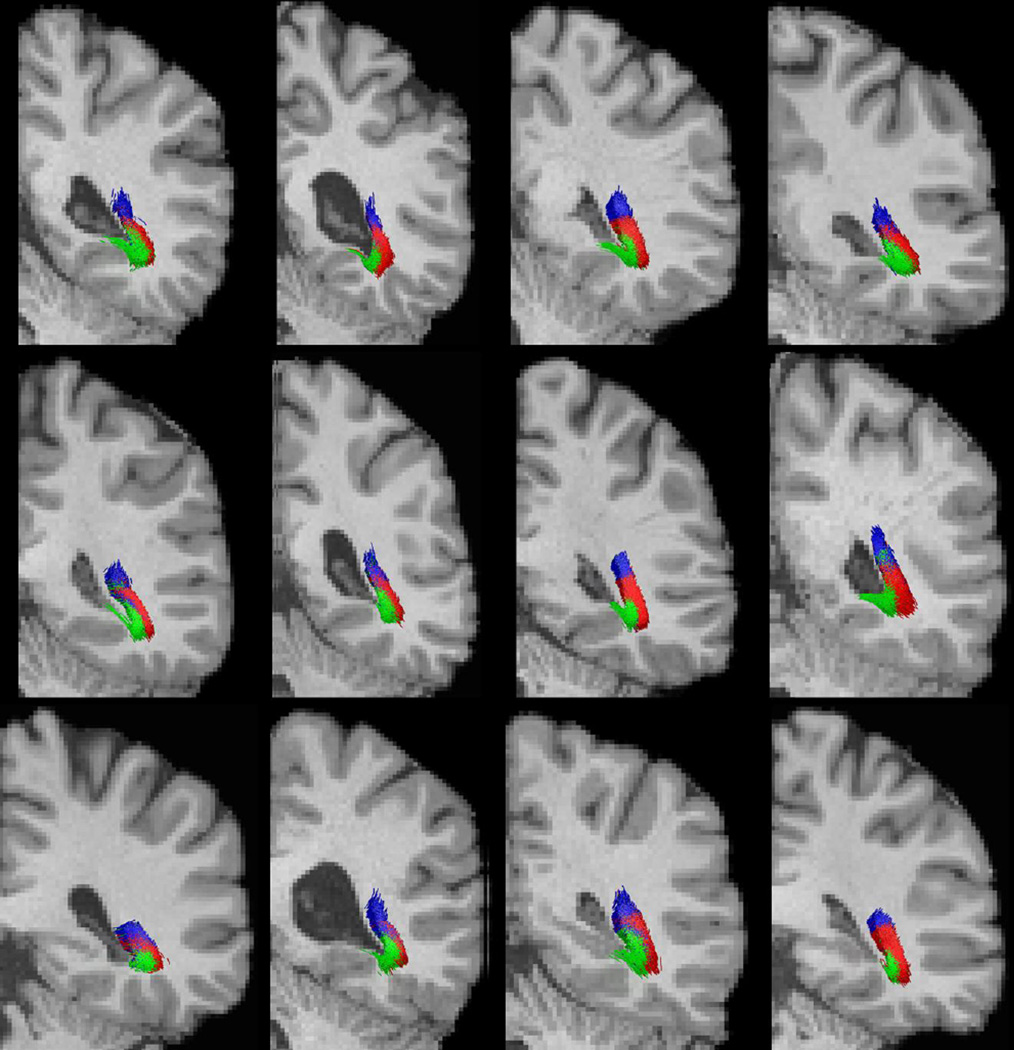
To examine if the reconstructions maintain the retinotopic organization of the fiber tracts as they project to the primary visual cortex, we compare them with post-mortem dissection studies (Ebeling & Reulen, 1988). We project eccentricity and angular maps to the V1 area of the cortex using retinotopic mapping based on cortical surfaces (Benson et al. 2012). To examine the retinotopic organization of the fiber bundle, we divided the visual field into three sub-fields: foveal field with eccentricity ≤ 3°, upper quadrant, and lower quadrant with eccentricity > 3°, which correspond to the red, green, and blue regions in Figure 10(a). Cortical regions in V1 that correspond to these sub-fields were labeled using the retinotopic template of Benson et al. (2012), and the labels were propagated from V1 to LGN, along the reconstructed optic radiation. A comparison of the retinotopic organization of the optic radiation reconstructed by our method and the dissection study by Ebeling & Reulen (1988) at the level of the trigone on a coronal section shows excellent agreement between the two (Figure 10 (b) and (c)). Each fiber tract in Figure 10 (c) is shown in the same color as the V1 sub-region in Figure 10 (a) to which it projects. Similar to dissection results, the fibers wrap around the ventricle, organized by their retinotopic projection onto the visual cortex. Figure 11 shows the retinotopic organization of the left optic radiation of the 12 examples seen in Figure 9 at the same coronal view; the fibers demonstrate a consistent spatial organization as they project to the three cortical regions. Their relative positions along the ventricle are also largely similar.
Figure 10.
A comparison of the retinotopic organization of the reconstructed fiber bundle with post-mortem dissection. (a) Retinotopic parcellation of the V1 cortex and the cutting plane (dashed line). (b) Post-mortem dissection result (Ebeling & Reulen, 1988. With permission from Springer Science and Business Media.) that shows the retinotopic organization of the optic radiation. (c) Retinotopic parcellation of the optic radiation fiber bundle reconstructed by our method.
Figure 11.
Retinotopic organization of the left optic radiation of the 12 examples shown in Figure 9. The same coloring scheme as in Figure 10 (c) is used.
3.2 Meyer’s loop
Meyer’s loop has been a challenge for tractography-based methods of optic radiation reconstruction. Qualitatively, as shown in Figure 9, our results appear to provide an anatomically meaningful characterization of Meyer’s loop, with fibers coursing anteriorly toward the temporal pole before extending posteriorly to the occipital cortex. For a more quantitative characterization, we calculate the distance between Meyer’s loop and the temporal/occipital poles and compare the results with post-mortem measurements. All measurements were standardized and automated as explained in the methods section.
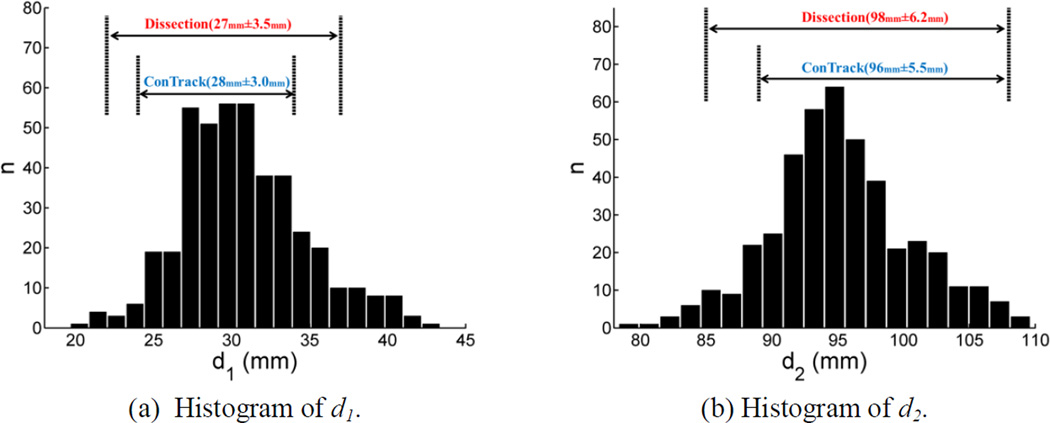
Histograms of these two distance measures obtained from the HCP cohort of 215 subjects are plotted in Figure 12 (a) and (b). As a comparison, we also plotted the ranges of the distance measures from the dissection study of Ebeling & Reulen (1988) and the DTI-based Contrack method (Sherbondy et al., 2008), which was applied on 8 subjects and depended on manual inputs for ROI delineation. Summary statistics of the distance measurements from all methods are listed in Table 1. We can see that our results agree with post-mortem measurements in terms of mean and standard deviation. Our large scale study shows a wider, albeit comparable, range of distributions compared with the dissection study and ConTrack, both of which had small sample sizes. Additionally, we did not find a statistically significant difference between the left and right hemisphere distances from Meyer’s loop to the temporal pole (P=0.44).
Figure 12.
Histograms of the distances to the temporal and occipital poles calculated from our OR reconstruction were plotted in (a) and (b), respectively. For comparisons, we also plotted the ranges of the distance measures from post-mortem dissection (Ebeling & Reulen, 1988) and the Contrack method (Sherbondy et al., 2008) above the histograms.
Table 1.
Statistics of the distance between the anterior tip of the Meyer’s loop and anatomical landmarks: the temporal and occipital pole. For our results, we listed the measurements from each hemisphere separately. Results from post-mortem dissection (Ebeling & Ruelen, 1988) and a DTI-based ConTrack method (Sherbondy et al., 2008) were listed for comparisons, where the measurements from both hemispheres were pooled together to obtain the statistics. d1 and d2 denote the absolute difference of the y-coordinate from the anterior tip of Meyer’s loop to the temporal pole and occipital pole, respectively. All measurements are in mm.
| Measurement | Our Res: LH | Our Res: RH | Dissection (Ebeling & Ruelen, 1988) |
ConTrack (Sherbondy et al., 2008) |
|---|---|---|---|---|
| d1 | 30.7±4.0 | 30.9±4.0 | 27±3.5 | 28±3.0 |
| d1 range | (19.7, 43.4) | (21.4, 42.0) | (22, 37) | (24, 34) |
| d2 | 95.4±5.2 | 95.0±5.4 | 98±6.2 | 96±5.5 |
| d2 range | (82.3, 109.7) | (78.3, 109.1) | (85, 108) | (89, 108) |
3.3 Probabilistic atlas of the optic radiation
To further validate our method, we construct a probabilistic atlas of the optic radiations and compare it with a post-mortem atlas of optic radiations (Bürgel et al., 1999), which was reconstructed in MR image space using data from myelin-stained histological sections of 10 human brains and image registration. By comparing our atlas with the post-mortem atlas, we further demonstrate the validity of our tractography-based model of human visual pathway.
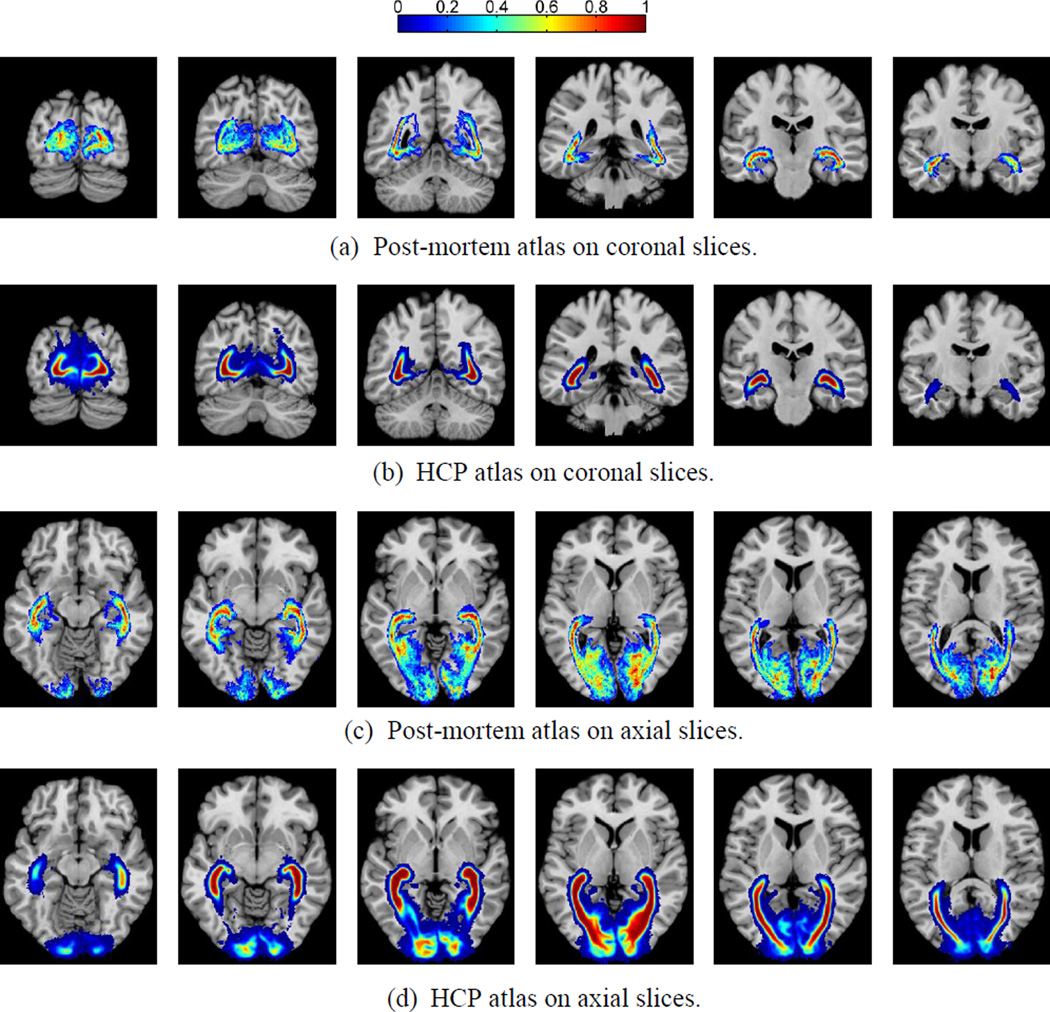
To construct the atlas, we first computed the tract density image (TDI) of each bundle and binarized it with a threshold of zero. Because the post-mortem atlas is in the image space of the ICBM (International Consortium for Brain Mapping) single subject atlas, we used the ANTS software to compute a diffeomorphic warp from the T1-weighted MRI of each HCP subject to this atlas. This allows us to warp the binary image of individual bundles into the common space of the ICBM single subject atlas. All warped binary images were summed together and divided by the number of HCP subjects (215) to obtain the final atlas as shown in Figure 13, which shows six coronal and axial slices from both the post-mortem and tractographic atlases. Our tractography results and the post-mortem atlas demonstrate similar spatial distribution patterns across the image space, including the branching of the optic radiation as it extends to the cortex, which has been difficult to capture in previous studies (Clatworthy et al., 2010).
Figure 13.
Probabilistic atlas of the optic radiation constructed from HCP data set as compared to post-mortem data. Results on five coronal and axial slices were plotted to compare with the post-mortem atlas from (Bürgel et al., 1999). (a) Post-mortem coronal; (b) HCP coronal; (c) Post-mortem axial; (d) HCP axial.
3.4 Inter-hemispheric asymmetry of the optic radiation
The reconstruction results from the large population of HCP subjects can be used to study the morphometry of retinofugal pathway. To demonstrate this, we focus on studying the inter-hemispheric asymmetry of the optic radiation.
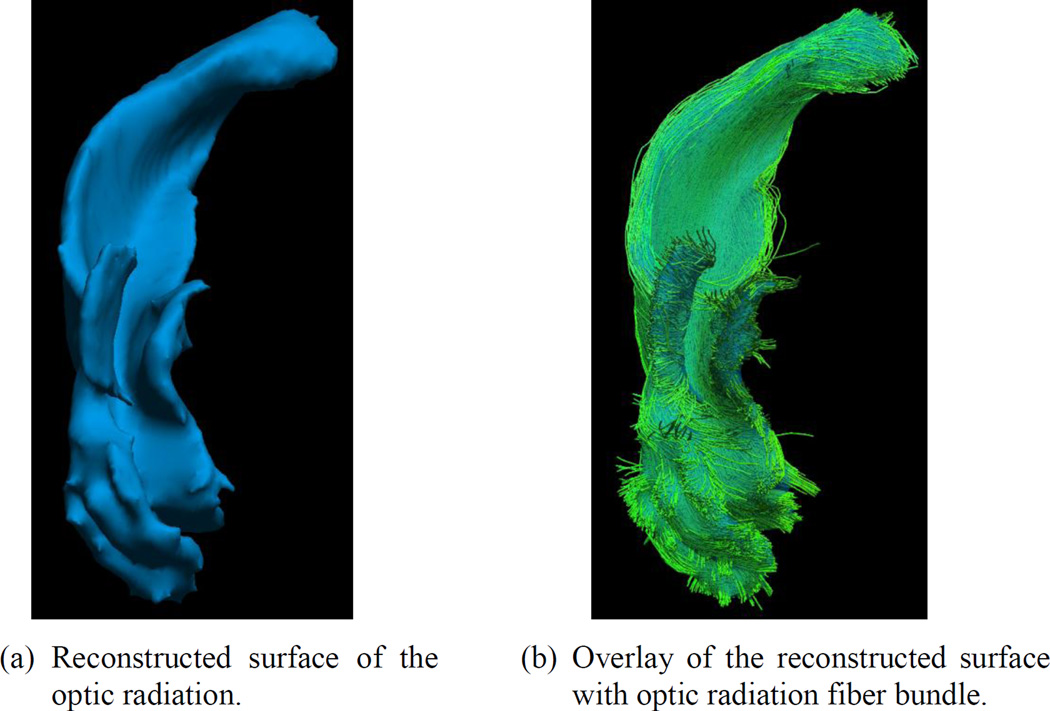
Using the TDI image of the reconstructed optic radiation, we generated a surface representation that ensures the smoothness of the surface, guarantees genus-zero topology, and avoids volume shrinkage (Shi et al., 2010). As an example, in Figure 14 we show the reconstructed surface and its overlay with the optic radiation bundle shown in Figure 8(d). We then measure the volume of this smooth surface for population studies. Using the skull-stripped MRI of each subject, we calculate the intracranial volume. The volume of the optic radiation is then divided by the intracranial volume to obtain its normalized volume.
Figure 14.
Surface representation of the optic radiation.
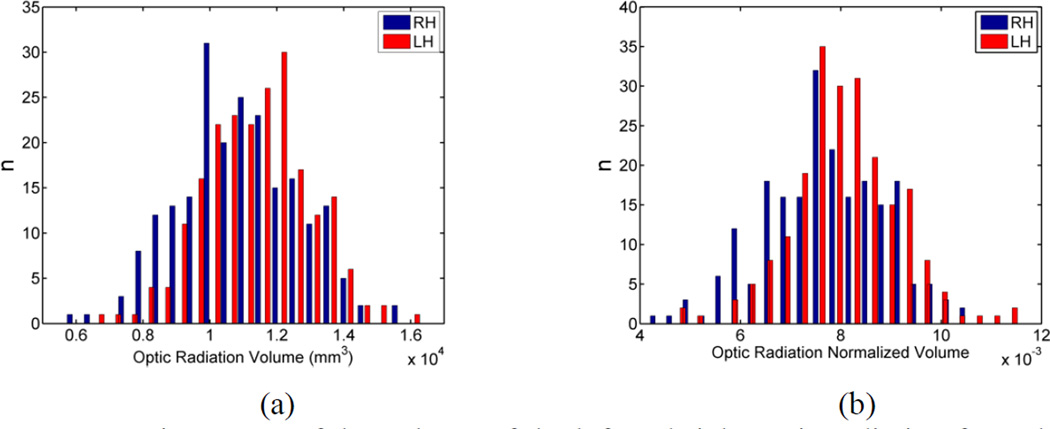
Histograms of the original and normalized volumes of the left and right optic radiation of the 215 HCP subjects are plotted in Figure 15. Both histograms show a left-ward asymmetry of the optic radiation volume. Paired t-tests were applied to evaluate the volumetric asymmetry of the optic radiation. In Table 2, we listed the mean and standard deviation of the volumes and the P-values from t-tests. Statistically significant results were obtained for both the original and normalized measures. Both the histograms and the t-tests show that the volume of the left optic radiation is significantly larger than the right optic radiation across the HCP population.
Figure 15.
Histograms of the volume of the left and right optic radiation from the HCP population. (a) Original volume; (b) Normalized volume.
Table 2.
Asymmetry of optic radiation volumes.
| Measurement | Optic Radiation: LH | Optic Radiation: RH | P-Value |
|---|---|---|---|
| Original Vol (mm3) | 1.15E4±1.59E3 | 1.08E4±1.76E3 | 2.5E-8 |
| Normalized volume | 0.0081±0.0011 | 0.0077±0.0012 | 2.1E-8 |
Discussion
In this work we develop a fully automated method for the reconstruction of the retinofugal pathway without manual placement of ROIs. There are two unique aspects of our method. First, it synergizes the rich information obtained using cutting-edge multi-shell HARDI data with the FOD’s ability to precisely model fiber directions within each voxel. Using FOD models, our method demonstrates robust performance in mapping Meyer’s loop in a way that is consistent with post-mortem measurements, which has been difficult to achieve in previous studies. Second, we develop a novel and automated approach for locating the LGN ROI using fiber tractography and shape analysis of the thalamus and hippocampus. With the LGN as the seed ROI and V1 as the target ROI, our method successfully reconstructs the optic radiation as a sheet-like structure along the roof of the lateral ventricle.
In this study we used dMRI data from the HCP, which consists of multi-shell HARDI data allowing for the computation of FODs with high order spherical harmonics. These sharp FODs are keys to obtaining an accurate retinotopic organization of fiber tracts within the optic radiation. The FOD reconstruction method in (Tran & Shi, 2015), however, can also be applied to regular, single-shell dMRI protocols that are frequently used in brain imaging studies. Thus our method is also applicable to common dMRI data that are widely available in research as well as clinical settings. Of course, the FODs computed from such data will be less sharp, which could lead to more false positives in probabilistic tractography and affect the inference of retinotopic organization of the reconstructed fiber bundle. However, with the increasing availability of multiband acquisition techniques, it is now possible to acquire the multi-shell HARDI data in a clinically feasible timeframe. Thus we still recommend an HCP-like protocol for high quality retinofugal pathway reconstruction.
One important aspect of optic radiation reconstruction is correctly modeling Meyer’s loop. To do this, we reduced the tractography curvature constraint to allow for the sharp curve near the temporal pole. In the posterior part of the optic radiation, however, this flexibility could result in an increase of false positives that violate the retinotopic organization of the fiber tracts. Thus the final curvature constraint of 1mm was chosen to reconcile the two goals of fully capturing Meyer’s loop while maintaining accurate fiber orientations closer to the visual cortex. A common metric used to judge tractographic representations of Meyer’s loop is the measurement of the distance between its anterior tip and the temporal pole (Lim et al., 2015; Sherbondy et al., 2008). This is an important indicator especially for surgical planning applications. However, it is worth noting that attaining a shorter average distance should not be taken as the sole marker of the validity of a given technique, especially when the differences among techniques are small (1~2mm). Other features such as the retinotopic organization of the fiber tracts should also be considered to judge the overall validity of the reconstruction. In fact, this distance measure has been shown to vary by several millimeters in different dissection studies, even when the dissections are carried out by the same group (Rubino et al., 2005; Choi et al., 2006). There are several population factors that will also undoubtedly affect such distance measures. Given that gray matter has been shown to atrophy at an accelerated rate compared to white matter, the age of the study population is a potential confounder when comparing distance measures between dissection and dMRI studies performed on older vs. younger subjects (Ge et al., 2002). Additionally, the distance between the temporal pole and the Meyer’s loop can be affected by the technique used to measure it. Some studies have relied on manual measurement by visual inspection, which may introduce bias. In this study, we used a fully automated method aligned along the AC-PC line, resulting in standardized measurement. Despite the aforementioned intricacies related to the measurement of the distance between Myer’s loop and the temporal pole, it is still a useful metric when used as a general figure to judge the validity of a technique. Our average distance values between the temporal pole and the Meyer’s loop were 30.7 and 30.9 for the left and right hemispheres, respectively. This falls very close to the average value found in many dissection studies (Ebling & Reulen, 1988; Choi et al., 2006) as well as dMRI studies (Sherbondy et al., 2008; Lim et al., 2015). For future work, we work also introduce more flexible curvature controls that are adaptive to anatomical priors about the shape of the fiber tracts along different parts of the retinofugal pathway. This will likely improve the retinotopic organization of the fiber bundle and enhance the specificity when studying the relation of localized retina impairment and fiber tract changes.
In this study, we demonstrate how our method can be used to obtain volumetric measurements of the optic radiations which can then be used in population studies. Specifically, we find left-ward asymmetry of the optic radiation. This is consistent with post-mortem study results that also found the optic radiation was larger on the left hemisphere on a sample size of 10 (Dreessen de Gervai et al. 2014). Our results provide an in vivo validation of this finding on a large HCP cohort. One confounding factor about measuring fiber bundle volume is the partial volume effect due to the presence of multiple bundles within the same voxel. To overcome this difficulty, we need to acquire images with higher resolution in future work and confirm if the same asymmetry can be detected.
This study uses data from the HCP cohort, which consists of young and healthy subjects in the age range of 25–35 years old. For future work, we will apply this method to study changes of the retinofugal pathway in patients with visual impairment. Additionally, the robustness of our method in capturing Meyer’s loop may have great value in epilepsy and brain tumor surgical planning.
Acknowledgements
This work was in part supported by the National Institute of Health (NIH) under Grant K01EB013633, P41EB015922, P50AG005142.
Footnotes
Publisher's Disclaimer: This is a PDF file of an unedited manuscript that has been accepted for publication. As a service to our customers we are providing this early version of the manuscript. The manuscript will undergo copyediting, typesetting, and review of the resulting proof before it is published in its final citable form. Please note that during the production process errors may be discovered which could affect the content, and all legal disclaimers that apply to the journal pertain.
References
- Anderson AW. Measurement of fiber orientation distributions using high angular resolution diffusion imaging. Magn. Reson. Med. 2005;54(5):1194–1206. doi: 10.1002/mrm.20667. [DOI] [PubMed] [Google Scholar]
- Andrews TJ, Halpern SD, Purves D. Correlated size variations in human visual cortex, lateral geniculate nucleus, and optic tract. The Journal of Neuroscience. 1997;17.8(1997):2859–2868. doi: 10.1523/JNEUROSCI.17-08-02859.1997. [DOI] [PMC free article] [PubMed] [Google Scholar]
- Avants BB, Epstein CL, Grossman M, Gee JC. Symmetric diffeomorphic image registration with cross-correlation: evaluating automated labeling of elderly and neurodegenerative brain. Med. Image Anal. 2008;12(1):26–41. doi: 10.1016/j.media.2007.06.004. [DOI] [PMC free article] [PubMed] [Google Scholar]
- Basser PJ, Mattiello J, LeBihan D. MR diffusion tensor spectroscopy and imaging. Biophys. J. 1994;66:259–267. doi: 10.1016/S0006-3495(94)80775-1. [DOI] [PMC free article] [PubMed] [Google Scholar]
- Basser PJ, Jones DK. Diffusion-tensor MRI: theory, experimental design and data analysis — a technical review. NMR Biomed. 2002;15:456–467. doi: 10.1002/nbm.783. [DOI] [PubMed] [Google Scholar]
- Bassi L, Ricci D, Volzone A, Allsop J, Srinivasan L, Pai A, Ribes C, Ramenghi L, Mercuri E, Mosca F, Edwards A, Cowan F, Rutherford M, Counsell S. Probabilistic diffusion tractography of the optic radiations and visual function in preterm infants at term equivalent age. Brain. 2008;131:573–582. doi: 10.1093/brain/awm327. [DOI] [PubMed] [Google Scholar]
- Behrens TE, Woolrich MW, Jenkinson M, Johansen-Berg H, Nunes RG, Clare S, Matthews PM, Brady JM, Smith SM. Characterization and propagation of uncertainty in diffusion-weighted MR imaging. Magn. Reson. Med. 2003;50(5):1077–1088. doi: 10.1002/mrm.10609. [DOI] [PubMed] [Google Scholar]
- Benjamin CF, Singh JM, Prabhu SP, Warfield SK. Optimization of tractography of the optic radiations. Hum. Brain Mapp. 2014;35(2):683–697. doi: 10.1002/hbm.22204. [DOI] [PMC free article] [PubMed] [Google Scholar]
- Benson NC, Butt OH, Datta R, Radoeva PD, Brainard DH, Aguirre GK. The retinotopic organization of striate cortex is well predicted by surface topology. Curr Biol. 2012;22(21):2081–2085. doi: 10.1016/j.cub.2012.09.014. [DOI] [PMC free article] [PubMed] [Google Scholar]
- Benson NC, Butt OH, Brainard DH, Aguirre GK. Correction of distortion in flattened representations of the cortical surface allows prediction of V1–V3 functional organization from anatomy. PLoS Comput. Biol. 2014;10(3):e1003538. doi: 10.1371/journal.pcbi.1003538. [DOI] [PMC free article] [PubMed] [Google Scholar]
- Bürgel U, Schormann T, Schleicher A, Zilles K. Mapping of histologically identified long fiber tracts in human cerebral hemispheres to the MRI volume of a reference brain: position and spatial variability of the optic radiation. NeuroImage. 1999;10(5):489–499. doi: 10.1006/nimg.1999.0497. [DOI] [PubMed] [Google Scholar]
- Calamante F, Tournier JD, Jackson GD, Connelly A. Track-density imaging (TDI):super-resolution white matter imaging using whole-brain track-density mapping. Neuroimage. 2010;53(4):1233–1243. doi: 10.1016/j.neuroimage.2010.07.024. [DOI] [PubMed] [Google Scholar]
- Ciccarelli O, Toosy A, Hickman S, Parker G, Wheeler-Kingshott C, Miller D, Thompson A. Optic radiation changes after optic neuritis detected by tractography-based group mapping. Hum Brain Mapp. 2005;25:308–316. doi: 10.1002/hbm.20101. [DOI] [PMC free article] [PubMed] [Google Scholar]
- Choi C, Rubino PA, Fernandez-Miranda JC, Abe H, Rhoton AL., Jr Meyer's loop and the optic radiations in the transsylvian approach to the mediobasal temporal lobe. Neurosurgery. 2006;59(4 Suppl 2):ONS228–ONS235. doi: 10.1227/01.NEU.0000223374.69144.81. [DOI] [PubMed] [Google Scholar]
- Clatworthy PL, Williams GB, Acosta-Cabronero J, Jones SP, Harding SG, Johansen-Berg H, Baron JC. Probabilistic tractography of the optic radiations—an automated method and anatomical validation. NeuroImage. 2012;49(3):2001–2012. doi: 10.1016/j.neuroimage.2009.10.083. [DOI] [PubMed] [Google Scholar]
- Congdon N, O'Colmain B, Klaver CC, Klein R, Muñoz B, Friedman DS, Kempen J, Taylor HR, Mitchell P Eye Diseases Prevalence Research Group. Causes and prevalence of visual impairment among adults in the United States. Arch. Ophthalmol. 2004;122(4):477–485. doi: 10.1001/archopht.122.4.477. [DOI] [PubMed] [Google Scholar]
- da Cruz L, Coley BF, Dorn J, Merlini F, Filley E, Christopher P, Chen FK, Wuyyuru V, Sahel J, Stanga P, Humayun M, Greenberg RJ, Dagnelie G Argus II Study Group. The Argus II epiretinal prosthesis system allows letter and word reading and long-term function in patients with profound vision loss. Br. J. Ophthalmol. 2013;97(5):632–636. doi: 10.1136/bjophthalmol-2012-301525. [DOI] [PMC free article] [PubMed] [Google Scholar]
- Daga P, Winston G, Modat M, White M, Mancini L, Cardoso MJ, Symms M, Stretton J, McEvoy AW, Thornton J, Micallef C, Yousry T, Hawkes DJ, Duncan JS, Ourselin S. Accurate localization of optic radiation during neurosurgery in an interventional MRI suite. IEEE Trans. Med. Imag. 2012;31(4):882–891. doi: 10.1109/TMI.2011.2179668. [DOI] [PubMed] [Google Scholar]
- Dale AM, Fischl B, Sereno MI. Cortical surface-based analysis. I. Segmentation and surface reconstruction. NeuroImage. 1990;9:179–194. doi: 10.1006/nimg.1998.0395. [DOI] [PubMed] [Google Scholar]
- Dayan M, Munoz M, Jentschke S, Chadwick MJ, Cooper JM, Riney K, Vargha-Khadem F, Clark CA. Optic radiation structure and anatomy in the normally developing brain determined using diffusion MRI and tractography. Brain Struct. Funct. 2005;220(1):291–306. doi: 10.1007/s00429-013-0655-y. [DOI] [PMC free article] [PubMed] [Google Scholar]
- Dinov ID, Torri F, Macciardi F, Petrosyan P, Liu Z, Zamanyan A, Eggert P, Pierce J, Genco A, Knowles JA, Clark A, Van Horn JD, Ames J, Kesselman C, Toga AW. Applications of the Pipeline Environment for Visual Informatics and Genomics Computations. BMC Bioinformatics. 2011;12:304. doi: 10.1186/1471-2105-12-304. [DOI] [PMC free article] [PubMed] [Google Scholar]
- Dreessen de Gervai P, Sboto-Frankenstein UN, Bolster RB, Thind S, Gruwel ML, Smith SD, Tomanek B. Tractography of Meyer's Loop asymmetries. Epilepsy Res. 2014;108(5):872–882. doi: 10.1016/j.eplepsyres.2014.03.006. [DOI] [PubMed] [Google Scholar]
- Ebeling U, Reulen H. Neurosurgical topography of the optic radiation in the temporal lobe. Acta Neurochir (Wien) 1988;92:29–36. doi: 10.1007/BF01401969. [DOI] [PubMed] [Google Scholar]
- Fillard P, Pennec X, Arsigny V, Ayache N. Clinical DT-MRI estimation, smoothing, and fiber tracking with log-Euclidean metrics. IEEE Trans Med Imaging. 2007;26(11):1472–1482. doi: 10.1109/TMI.2007.899173. [DOI] [PubMed] [Google Scholar]
- Fischl B, Sereno MI, Tootell R, Dale AM. High-resolution intersubject averaging and a coordinate system for the cortical surface. Hum Brain Mapp. 1999;8:272–284. doi: 10.1002/(SICI)1097-0193(1999)8:4<272::AID-HBM10>3.0.CO;2-4. [DOI] [PMC free article] [PubMed] [Google Scholar]
- Ge Y, Grossman RI, Babb JS, Rabin ML, Mannon LJ, Kolson DL. Age-related total gray matter and white matter changes in normal adult brain. Part I: volumetric MR imaging analysis. American journal of neuroradiology. 2002;23(8):1327–1333. [PMC free article] [PubMed] [Google Scholar]
- Hinton DR, Sadun AA, Blanks JC, Miller CA. Optic-nerve degeneration in Alzheimer's disease. N Engl J Med. 1986;315(8):485–487. doi: 10.1056/NEJM198608213150804. [DOI] [PubMed] [Google Scholar]
- Hofer S, Karaus A, Frahm J. Reconstruction and dissection of the entire human visual pathway using diffusion tensor MRI. Front Neuroanat. 2010;4:15. doi: 10.3389/fnana.2010.00015. [DOI] [PMC free article] [PubMed] [Google Scholar]
- Horton JC, Landau K, Maeder P, Hoyt WF. Magnetic resonance imaging of the human lateral geniculate body. Arch Neurol. 1990;47:201–206. doi: 10.1001/archneur.1990.00530110059017. [DOI] [PubMed] [Google Scholar]
- Humayun MS, Dorn JD, da Cruz L, Dagnelie G, Sahel JA, Stanga PE, Cideciyan AV, Duncan JL, Eliott D, Filley E, Ho AC, Santos A, Safran AB, Arditi A, Del Priore LV, Greenberg RJ Argus II Study Group. Interim results from the international trial of Second Sight's visual prosthesis. Ophthalmology. 2012;119(4):779–788. doi: 10.1016/j.ophtha.2011.09.028. [DOI] [PMC free article] [PubMed] [Google Scholar]
- Jacobson SG, Cideciyan AV, Ratnakaram R, Heon E, Schwartz SB, Roman AJ, Peden MC, Aleman TS, Boye SL, Sumaroka A, Conlon TJ, Calcedo R, Pang JJ, Erger KE, Olivares MB, Mullins CL, Swider M, Kaushal S, Feuer WJ, Iannaccone A, Fishman GA, Stone EM, Byrne BJ, Hauswirth WW. Gene therapy for leber congenital amaurosis caused by RPE65 mutations: safety and efficacy in 15 children and adults followed up to 3 years. Arch Ophthalmol. 2012;130(1):9–24. doi: 10.1001/archophthalmol.2011.298. [DOI] [PMC free article] [PubMed] [Google Scholar]
- Lai R, Shi Y, Dinov I, Chan TF, Toga AW. Laplace-Beltrami nodal counts: a new signature for 3D shape analysis. Proc ISBI. 2009;2009:694–697. doi: 10.1109/ISBI.2009.5193142. [DOI] [PMC free article] [PubMed] [Google Scholar]
- Li H, Xue Z, Guo L, Liu T, Hunter J, Wong S. A hybrid approach to automatic clustering of white matter fibers. Neuroimage. 2010;49(2):1249–1258. doi: 10.1016/j.neuroimage.2009.08.017. [DOI] [PubMed] [Google Scholar]
- Lilja Y, Nilsson DT. Strengths and limitations of tractography methods to identify the optic radiation for epilepsy surgery. Quantitative Imaging in Medicine and Surgery. 2015;5(2):288. doi: 10.3978/j.issn.2223-4292.2015.01.08. [DOI] [PMC free article] [PubMed] [Google Scholar]
- Lim JC, Phal PM, Desmond PM, Nichols AD, Kokkinos C, Danesh-Meyer HV, Kaye AH, Moffat BA. Probabilistic MRI Tractography of the Optic Radiation Using Constrained Spherical Deconvolution: A Feasibility Study. PloS one. 2015;10(3):e0118948. doi: 10.1371/journal.pone.0118948. [DOI] [PMC free article] [PubMed] [Google Scholar]
- Meyer A. The connections of the occipital lobes and the present status of the cerebral visual affections. Trans. Assoc. Am. Physicians. 1907;22:7–16. [Google Scholar]
- Mori S, Crain BJ, Chacko VP, Van Zijl PCM. Three-dimensional tracking of axonal projections in the brain by magnetic resonance imaging. Annals of Neurology. 1999;45(2):265–269. doi: 10.1002/1531-8249(199902)45:2<265::aid-ana21>3.0.co;2-3. [DOI] [PubMed] [Google Scholar]
- Nilsson D, Starck G, Ljungberg M, Ribbelin S, Jönsson L, Malmgren K, Rydenhag B. Intersubject variability in the anterior extent of the optic radiation assessed by tractography. Epilepsy Res. 2007;77(1):11–16. doi: 10.1016/j.eplepsyres.2007.07.012. [DOI] [PubMed] [Google Scholar]
- O’Donnell L, Westin CF. Automatic Tractography Segmentation Using a High-Dimensional White Matter Atlas. IEEE Trans. Med. Imag. 2007;26(11):1562–1575. doi: 10.1109/TMI.2007.906785. [DOI] [PubMed] [Google Scholar]
- Osher SJ, Fedkiw RP. Level Set Methods and Dynamic Implicit Surfaces. Springer; 2003. [Google Scholar]
- Parker GJ, Haroon HA, Wheeler-Kingshott CA. A framework for a streamline-based probabilistic index of connectivity (PICo) using a structural interpretation of MRI diffusion measurements. J. Magn. Reson. Imaging. 2003;18:242–254. doi: 10.1002/jmri.10350. [DOI] [PubMed] [Google Scholar]
- Patenaude B, Smith SM, Kennedy D, Jenkinson M. A Bayesian Model of Shape and Appearance for Subcortical Brain. NeuroImage. 2011;56(3):907–922. doi: 10.1016/j.neuroimage.2011.02.046. [DOI] [PMC free article] [PubMed] [Google Scholar]
- Peled S, Friman O, Jolesz F, Westin CF. Geometrically constrained two-tensor model for crossing tracts in DWI. Magn. Reson. Imaging. 2006;24(9):1263–1270. doi: 10.1016/j.mri.2006.07.009. [DOI] [PMC free article] [PubMed] [Google Scholar]
- Peltier J, Travers N, Destrieux C, Velut S. Optic radiations: a microsurgical anatomical study. J Neurosurg. 2006;105(2):294–300. doi: 10.3171/jns.2006.105.2.294. [DOI] [PubMed] [Google Scholar]
- Reich DS, Smith SA, Gordon-Lipkin EM, Ozturk A, Caffo BS, Balcer LJ, Calabresi PA. Damage to the optic radiation in multiple sclerosis is associated with retinal injury and visual disability. Arch Neurol. 2009;66(8):998–1006. doi: 10.1001/archneurol.2009.107. [DOI] [PMC free article] [PubMed] [Google Scholar]
- Rohlfing T, Brandt R, Menzel R, Maurer CR., Jr Evaluation of atlas selection strategies for atlas-based image segmentation with application to confocal microscopy images of bee brains. NeuroImage. 2004;21(4):1428–1442. doi: 10.1016/j.neuroimage.2003.11.010. [DOI] [PubMed] [Google Scholar]
- Rubino PA, Rhoton AL, Jr, Tong X, Oliveira Ed. Three-dimensional relationships of the optic radiation. Neurosurgery. 2005;57(4 Suppl):219–227. doi: 10.1227/01.neu.0000176415.83417.16. [DOI] [PubMed] [Google Scholar]
- Sabuncu MR, Yeo BT, Van Leemput K, Fischl B, Golland P. A generative model for image segmentation based on label fusion. IEEE Trans. Med. Imaging. 2010;29(10):1714–1729. doi: 10.1109/TMI.2010.2050897. [DOI] [PMC free article] [PubMed] [Google Scholar]
- Saeki N, Fujimoto N, Kubota M, Yamaura A. MR demonstration of partial lesions of the lateral geniculate body and its functional intra-nuclear topography. Clin. Neurol. Neurosurg. 2003;106:28–32. doi: 10.1016/j.clineuro.2003.08.002. [DOI] [PubMed] [Google Scholar]
- Schwartz SD, Hubschman JP, Heilwell G, Franco-Cardenas V, Pan CK, Ostrick RM, Mickunas E, Gay R, Klimanskaya I, Lanza R. Embryonic stem cell trials for macular degeneration: a preliminary report. Lancet. 2012;379(9817):713–720. doi: 10.1016/S0140-6736(12)60028-2. [DOI] [PubMed] [Google Scholar]
- Sherbondy AJ, Dougherty RF, Napel S, Wandell BA. Identifying the human optic radiation using diffusion imaging and fiber tractography. J. Vis. 2008;8(10):12.1–12.11. doi: 10.1167/8.10.12. [DOI] [PMC free article] [PubMed] [Google Scholar]
- Shi Y, Lai R, Morra JH, Dinov I, Thompson PM, Toga AW. Robust surface reconstruction via Laplace-Beltrami eigen-projection and boundary deformation. IEEE Trans. Med. Imaging. 2010;29(12):2009–2022. doi: 10.1109/TMI.2010.2057441. [DOI] [PMC free article] [PubMed] [Google Scholar]
- Stingl K, Bartz-Schmidt KU, Besch D, Braun A, Bruckmann A, Gekeler F, Greppmaier U, Hipp S, Hörtdörfer G, Kernstock C, Koitschev A, Kusnyerik A, Sachs H, Schatz A, Stingl KT, Peters T, Wilhelm B, Zrenner E. Artificial vision with wirelessly powered subretinal electronic implant alpha-IMS. Proc Biol Sci. 2013;280(1757):20130077. doi: 10.1098/rspb.2013.0077. [DOI] [PMC free article] [PubMed] [Google Scholar]
- Sun GC, Chen XL, Zhao Y, Wang F, Hou BK, Wang YB, Xu BN. Intraoperative high-field magnetic resonance imaging combined with fiber tract neuronavigation-guided resection of cerebral lesions involving optic radiation. Neurosurgery. 2011;69(5):1070–1084. doi: 10.1227/NEU.0b013e3182274841. [DOI] [PubMed] [Google Scholar]
- Toga A, Clark K, Thompson P, Shattuck D, Van Horn J. Mapping the human connectome. Neurosurgery. 2012;71(1):1–5. doi: 10.1227/NEU.0b013e318258e9ff. [DOI] [PMC free article] [PubMed] [Google Scholar]
- Tournier JD, Calamante F, Connelly A. Robust determination of the fiber orientation distribution in diffusion MRI: non-negativity constrained super-resolved spherical deconvolution. NeuroImage. 2007;35(4):1459–1472. doi: 10.1016/j.neuroimage.2007.02.016. [DOI] [PubMed] [Google Scholar]
- Tournier JD, Calamante F, Connelly A. MRTrix: diffusion tractography in crossing fibers regions. International Journal on Imaging Systems and Technology. 2012;22(1):53–66. [Google Scholar]
- Tran G, Shi Y. Fiber orientation and compartment parameter estimation from multi-shell diffusion imaging. IEEE. Trans. Med. Imaging. 2015 doi: 10.1109/TMI.2015.2430850. In Press. [DOI] [PMC free article] [PubMed] [Google Scholar]
- Tuch DS. Q-ball imaging. Magn Reson Med. 2004;52(6):1358–1372. doi: 10.1002/mrm.20279. [DOI] [PubMed] [Google Scholar]
- Yogarajah M, Focke NK, Bonelli S, Cercignani M, Acheson J, Parker GJ, Alexander DC, McEvoy AW, Symms MR, Koepp MJ, Duncan JS. Defining Meyer's loop-temporal lobe resections, visual field deficits and diffusion tensor tractography. Brain. 2009;132(6):1656–1668. doi: 10.1093/brain/awp114. [DOI] [PMC free article] [PubMed] [Google Scholar]
- Van Essen DC, Ugurbil K, Auerbach E, Barch D, Behrens TE, Bucholz R, Chang A, Chen L, Corbetta M, Curtiss SW, Della Penna S, Feinberg D, Glasser MF, Harel N, Heath AC, Larson-Prior L, Marcus D, Michalareas G, Moeller S, Oostenveld R, Petersen SE, Prior F, Schlaggar BL, Smith SM, Snyder AZ, Xu J, Yacoub E WU-Minn HCP Consortium. The Human Connectome Project: a data acquisition perspective. NeuroImage. 2012;62(4):2222–2231. doi: 10.1016/j.neuroimage.2012.02.018. [DOI] [PMC free article] [PubMed] [Google Scholar]
- Wang H, Suh JW, Das SR, Pluta J, Craige C, Yushkevich PA. Multi-Atlas Segmentation with Joint Label Fusion. IEEE Trans. Pattern Anal. Mach. Intell. 2013;35(3):611–623. doi: 10.1109/TPAMI.2012.143. [DOI] [PMC free article] [PubMed] [Google Scholar]
- Wu W, Rigolo L, O'Donnell LJ, Norton I, Shriver S, Golby AJ. Visual pathway study using in vivo diffusion tensor imaging tractography to complement classic anatomy. Neurosurgery. 2002;70(1 Suppl Operative):145–156. doi: 10.1227/NEU.0b013e31822efcae. [DOI] [PMC free article] [PubMed] [Google Scholar]
- Yamamoto T, Yamada K, Nishimura T, Kinoshita S. Tractography to depict three layers of visual field trajectories to the calcarine gyri. Am. J. Ophthalmol. 2005;140(5):781–785. doi: 10.1016/j.ajo.2005.05.018. [DOI] [PubMed] [Google Scholar]


