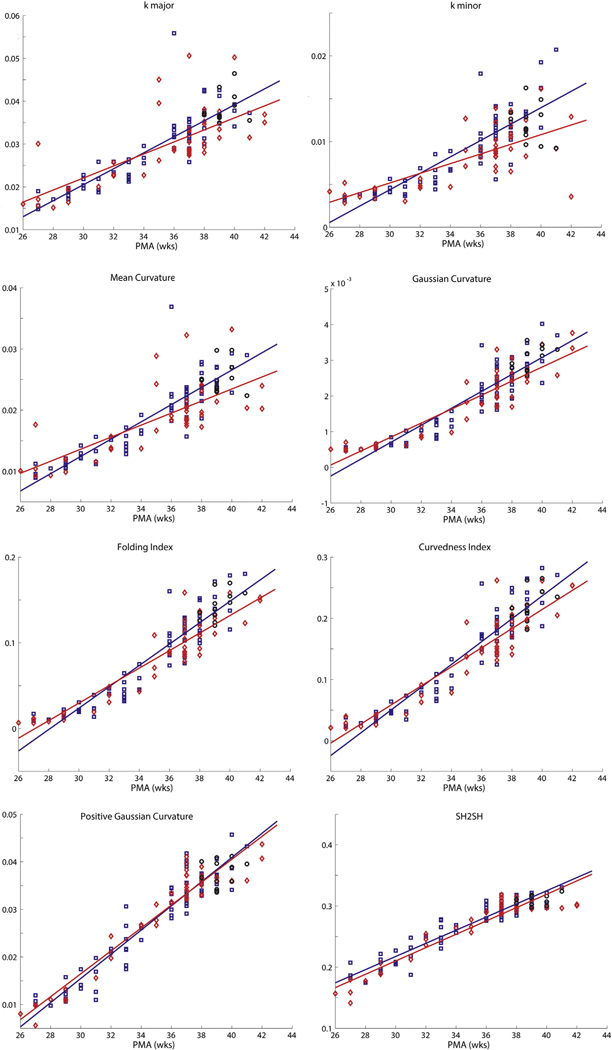
Fig. 4.
Plots demonstrating a representative group of the folding measures listed in Table 1 versus PMA for term, uninjured preterm and injured preterminfants. Note the similarity of the plots across measures. In each plot, black circles represent terminfants, blue squares represent uninjured preterminfants and red diamonds represent injured preterminfants. Solid lines denote results from linear fits of data, with blue lines representing results from uninjured preterm infants and red lines representing results from injured preterm infants.

