Abstract
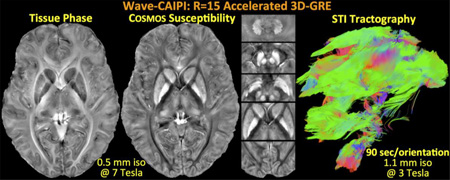
Three-dimensional Gradient Echo (GRE) is the main workhorse sequence used for Susceptibility Weighted Imaging (SWI), Quantitative Susceptibility Mapping (QSM) and Susceptibility Tensor Imaging (STI). Achieving optimal phase signal-to-noise ratio requires late echo times, thus necessitating a long repetition time (TR). Combined with the large encoding burden of whole-brain coverage with high resolution, this leads to increased scan time. Further, the dipole kernel relating the tissue phase to the underlying susceptibility distribution undersamples the frequency content of the susceptibility map. Scans at multiple head orientations along with Calculation Of Susceptibility through Multi-Orientation Sampling (COSMOS) are one way to effectively mitigate this issue. Additionally, STI requires a minimum of 6 head orientations to solve for the independent tensor elements in each voxel. The requirements of high-resolution imaging with long TR at multiple orientations substantially lengthen the acquisition of COSMOS and STI. The goal of this work is to dramatically speed up susceptibility mapping at multiple head orientations. We demonstrate highly efficient acquisition using 3D-GRE with Wave-CAIPI, and dramatically reduce the acquisition time of these protocols. Using R=15 fold acceleration with Wave-CAIPI permits acquisition per head orientation in 90 s at 1.1 mm isotropic resolution, and 5:35 minutes at 0.5 mm isotropic resolution. Since Wave-CAIPI fully harnesses the 3D spatial encoding capability of receive arrays, the maximum g-factor noise amplification remains below 1.30 at 3T and 1.12 at 7T. This allows a 30-minute exam for STI with 12 orientations, thus paving the way to its clinical application.
Keywords: Quantitative Susceptibility Mapping, Susceptibility Tensor Imaging, phase imaging, Wave-CAIPI, parallel imaging
Graphical abstract
1. Introduction
Quantitative Susceptibility Mapping (QSM) aims to estimate the tissue susceptibility distribution that gives rise to subtle changes in the main magnetic field (Shmueli et al., 2009; Rochefort et al., 2008), which are captured by the image phase in a gradient echo (GRE) experiment. The underlying susceptibility distribution is related to the acquired tissue phase through an ill-posed linear system (Marques & Bowtell, 2005). To facilitate its solution, spatial regularization that imposes sparsity or smoothness assumptions, or additional GRE volumes acquired at multiple head orientations, are required. Influential regularized QSM techniques include MEDI (de Rochefort et al., 2010; Liu et al., 2011, 2012b), HEIDI (Schweser et al., 2012) and Compressed Sensing (CS) (Wu et al., 2012b). On the other hand, multi-orientation sampling relies on the fact that, as the head is rotated inside the receive array, the dipole kernel also moves relative to the main magnetic field (Liu et al., 2009). This way, the undersampled frequency content of the susceptibility map varies as a function of rotation, thereby enabling dipole inversion through the solution of an over-determined linear system. Such multi-orientation reconstruction is termed Calculation Of Susceptibility through Multi-Orientation Sampling (COSMOS), and has been shown to provide higher quality estimates than regularized QSM from a single orientation (Liu et al., 2011; Wharton & Bowtell, 2010).
A further advantage of COSMOS is that it does not require additional regularization, thus obviating regularization parameter value selection. The main difficulties with multi-orientation sampling are the increased acquisition time and patient discomfort due to less natural head positioning. In contrast, regularized single-orientation QSM benefits from reduced acquisition time. The drawbacks of single-orientation reconstruction include regularization parameter value selection and the presence of streaking artifacts or over-smoothing.
Susceptibility Tensor Imaging (STI) models the susceptibility distribution in each voxel as a tensor, and is thus capable of capturing the orientation dependence and anisotropy of the tissue susceptibility (Liu, 2010). STI entails the estimation of 6 independent entries in a 3×3 symmetric tensor per voxel, and requires data acquired at 6 or more head orientations to solve the ensuing inverse problem. Since the increased sampling requirement complicates STI data acquisition, previous in vivo human studies necessitated excessively long scan times and limited spatial resolution: (i) 16 min/orientation in (Li et al., 2012a) at 2×2×2 mm3 resolution without parallel imaging acceleration, (ii) 10 min/orientation in (Wisnieff et al., 2013) at 1.5×1.5×1.5 mm3 resolution without parallel imaging acceleration, and (iii) 5:15 min/orientation in (Li et al., 2012b) at 1 mm3 resolution with R=2.5×2 SENSE acceleration (Pruessmann et al., 1999)). Collecting 12 orientations using the protocol reported in (Wisnieff et al., 2013) would have taken 2 hours of constant scanning; repositioning, reshimming and calibration led to a total imaging time of 4 hours. Employing prior information and regularized reconstruction allows STI estimation from fewer head orientations (Li et al., 2012b; Wisnieff et al., 2013; Li & van Zijl, 2014). Following the main eigenvector direction in STI permits fiber tractography, which has been demonstrated in mouse brain (Liu et al., 2012a), kidney (Xie et al., 2014) and heart (Dibb et al., 2014).
Prohibitively long scan times impede research and clinical applications of multi-orientation sampling, limiting its spatial resolution and restricting its use to ex vivo animal studies or highly compliant human subjects. In this work, we address this shortcoming and use highly efficient data acquisition to enable whole-brain, multi-orientation susceptibility mapping in clinically relevant scan times. Due to its ability to distribute aliasing across all 3 spatial dimensions, 3D-GRE with Wave-CAIPI (Bilgic et al., 2015) permits highly accelerated parallel imaging with low image artifact and noise amplification penalties. We pursue the application of Wave-CAIPI in multi-orientation imaging on two fronts: We propose a 20-minute protocol at 0.5 mm isotropic resolution and 3 head orientations with whole-brain coverage at 7T. This is made possible by a 5:35 minute acquisition per orientation upon R=15 fold acceleration, and yields susceptibility maps with exquisite contrast and detail in the cortex, basal ganglia and cerebellum. Second, we propose a 30-minute STI protocol at 1.1 isotropic resolution and 12 head orientations with whole-brain coverage at 3T. At R=15 fold acceleration, Wave-CAIPI permits a 90 second acquisition per orientation, thus enabling robust, high-resolution in vivo STI in a clinically relevant scan time. Through such efficient encoding, we are also demonstrating STI tractography in the human brain for the first time.
The overall contributions of this work are:
Employing R=15 fold accelerated Wave-CAIPI for high-resolution COSMOS imaging at 7T, thus enabling whole-brain acquisition with 0.5 mm isotropic resolution in 5:35 minutes/orientation.
Deploying the same acceleration factor to dramatically speed up STI acquisition, achieving 1.1 mm isotropic resolution with whole-brain coverage and long TE/TR in 90 s/orientation. Demonstrating in vivo STI tractography in the human brain for the first time.
Making Matlab software available for STI and COSMOS online at: martinos.org/~berkin/COSMOS_STI_Toolbox.zip
2. Theory
2.1 COSMOS
As the imaged object is rotated with respect to the main magnetic field, the dipole convolution relating the acquired phase ϕi to the scalar susceptibility distribution χ becomes
| (1) |
where i is the orientation index, F is the Discrete Fourier Transform and Di denotes the dipole kernel in the ith frame due to The index kzi is the projection of the k-space vector in the ith frame onto the main field direction. The collection of phase images at N orientations can be formatted to yield the over-determined system,
| (2) |
This set of equations can be solved in the least-squares sense by considering the problem
| (3) |
Taking the gradient of Eq.3 and setting it to zero yields a closed-form solution,
| (4) |
This solution requires only Fast Fourier Transform (FFT) evaluations, point-wise multiplications, and the inversion of a diagonal matrix. It is thus extremely efficient, usually requiring several seconds of computation. A further refinement to the least-squares formulation makes use of the magnitude signal to penalize the deviation from the measured data via weighted least-squares,
| (5) |
where W is a diagonal matrix with entries proportional to the magnitude image. The solution of this problem involves the inversion of non-diagonal matrices, hence necessitating the use of iterative optimization (Liu et al., 2009).
2.2 Susceptibility Tensor Imaging
STI models the orientation dependence of tissue susceptibility through a tensor model, which results in a 3×3 symmetric matrix representing the apparent susceptibility tensor for each voxel. In the object’s frame of reference, the observed phase in the ith frame is related to this tensor via
| (6) |
Here, χ̿ is the susceptibility tensor and Hi is the unit vector representing the main field direction in the ith frame. Note that Eq.6 is evaluated on a voxel-by-voxel basis, so that at a particular k-space position k, the 1-dimensional scalar (Fϕi)k is related to the 3×3 k-space tensor (Fχ̿)k. Now defining the operator Ai that represents the mapping from χ̿ to Fϕi across all k-space elements, the STI inversion can also be formulated as a least-squares problem,
| (7) |
3. Methods
3.1 Wave-CAIPI acquisition, reconstruction and g-factor computation
Wave-CAIPI modifies the 3D-GRE sequence to follow a “corkscrew” trajectory in k-space, which gives rise to voxel spreading in the readout dimension. Since the amount of the spreading effect is dependent on the (y,z) coordinates, the voxels that collapse on each other due to undersampling are spread further apart in accelerated acquisitions. With the addition of 2D-CAIPI slice-shifting (Breuer et al., 2006), the combined effect dramatically improves the parallel imaging capability. Even though Wave-CAIPI traverses a non-Cartesian trajectory, it is possible to employ point spread function (PSF) formalism to represent data acquisition on a Cartesian grid (Bilgic et al., 2015). Determination of the PSFs is equivalent to k-space trajectory estimation, which was pre-computed on a head phantom prior to all in vivo acquisitions reported herein, thus requiring no additional scan time for human subjects.
Wave-CAIPI reconstruction employs a generalized SENSE model (Pruessmann et al., 1999), including coil sensitivity and PSF estimates. Specifically, the reconstruction is decoupled into sub-problems that are solved independently for each set of collapsed readout rows. At R=15 acceleration, we solve for 15 collapsed readout image rows at a time, and loop over y (phase) and z (slice) spatial positions. This leads to the forward SENSE model,
| (8) |
where are the unknown readout rows, are the collapsed coil data, are the slice-shifting operators that undo the 2D-CAIPI interslice shifts, are the Wave point spread operators, and Cij are the coil sensitivities. To capture the noise correlation across the receive channels, the coil sensitivities and the coil images are pre-whitened with the inverse square root of the noise covariance matrix,Ψ−1/2. For the present experiments, M=32 coils are used to unalias N=15 readout rows. Compactly representing this system as E·row = coil, the g-factor value at position r is evaluated in closed-form as .
3.2 Wave-CAIPI at 7T: COSMOS acquisition and processing
A healthy volunteer (female, age 26) was scanned using a research whole-body 7T system (Siemens AG, Erlangen, Germany) in compliance with the Institutional Review Board (IRB) requirements. A custom tight-fitting 32-channel head coil was used for reception (Keil et al., 2010). Low-resolution, rapid 3D-GRE data were acquired with head array and birdcage mode for coil sensitivity estimation. The parameters for these calibration scans were: TR/TE = 5.3/1.53 ms, FOV = 255×255×180 mm3, resolution = 2×3×3 mm3, matrix size = 128×85×60, bandwidth = 1950 Hz/pixel, flip angle = 25°, with 20% slice oversampling to prevent wrap-around due to imperfect slab selective excitation. Since the 7T system lacks a body coil receiver, birdcage mode was employed as reference for coil sensitivity estimation. This permitted computation of the phase offset of each channel in the head array, thereby eliminating potential phase singularities in the combined phase image. After normalizing the head array data with the birdcage mode image, 7th order polynomial fitting and iterative JSENSE processing (Ying & Sheng, 2007) were performed to estimate coil sensitivity profiles.
For the 0.5 mm isotropic resolution scan with R=15 fold acceleration, the same FOV was used and the orientation of the acquisition box was held constant across different head orientations. The remaining parameters were: TR/TE = 29/19.5 ms, matrix size = 480×480×360, bandwidth = 100 Hz/pixel, flip angle was optimized based on the Ernst angle relation, and was set to 10.8°. The sinusoidal gradient waveforms for the corkscrew trajectory were designed to have 7 cycles during the 10 ms readout while not exceeding Gmax=20 mT/m and slew=70 mT/m/ms. Slab-selective excitation was achieved using a custom RF pulse with sharp cut-off (time-bandwidth product = 50) to image an 18-cm thick slab in the head-foot direction. This excitation allowed data acquisition without the need for slice oversampling, where the RF pulse was VERSE’d (Conolly et al., 1988) to allow rapid coverage of the large extent in excitation k-space without incurring high Specific Absorption Rate (SAR). Acquisition time was 5:35 minutes per orientation.
Data were acquired at a total of three orientations, with rotations of 0°, 7.4° and 13° relative to the main field. B0 shimming and coil sensitivity calibration acquisition were performed prior to QSM acquisition at each orientation. Following Wave-CAIPI reconstruction, brain masks were generated using FSL-BET (Smith, 2002). Raw phase images of each orientation were unwrapped and filtered using Laplacian unwrapping and V-SHARP background removal with kernel size = 25 (Li et al., 2011; Wu et al., 2012b) using the STI Suite (available at people.duke.edu/~cl160/). FSL-FLIRT (Jenkinson et al., 2002) was used to compute the rotation matrices from the magnitude data. The tissue phase images were then registered onto the neutral frame, which was assumed to coincide with the main magnetic field, using the computed rotations with sinc interpolation. Finally, COSMOS reconstruction with weighted least-squares formulation (Eq.5) was employed to compute the susceptibility map. Since the tight-fitting head coil allowed only minor head rotations, a Tikhonov penalty was added to mitigate the residual streaking artifacts via the regularizer with regularization parameter λ = 0.05. Optimization was performed using LSQR (Paige & Saunders, 1982).
3.3 Wave-CAIPI at 3T: STI acquisition and processing
A healthy volunteer (female, age 30) was scanned at a Siemens 3T TIM Trio system (Erlangen, Germany) in compliance with the IRB requirements. For parallel reception, a 32-channel product head coil was used. Low-resolution, rapid 3D-GRE data were acquired with head and body coils for coil sensitivity calibration. The parameters for the calibration acquisition were: TR/TE = 3.7/1.67 ms, FOV = 255×255×180 mm3, resolution = 2×3×3 mm3, matrix size = 128×85×60, bandwidth = 1030 Hz/pixel, flip angle = 15°, with 20% slice oversampling and the acquisition time was 23 s. This set of low-resolution images was acquired for each head orientation, and was used to compute coil sensitivity profiles with the same polynomial fitting and JSENSE pipeline. Shimming and sensitivity calibration were performed for each head orientation. Following these preparation steps, R=15 fold accelerated Wave-CAIPI data were collected with the same FOV and TR/TE = 35/25 ms, 1.1 mm isotropic resolution, matrix size = 240×240×168, bandwidth = 100 Hz/pixel, flip angle = 14° (Ernst angle), slab selective RF pulse with time-bandwidth product = 50, and FOV/2 slice-shift. The Wave gradient waveforms were designed to have 7 sinusoidal cycles during the 10 ms readout while not exceeding Gmax=5 mT/m and slew=50 mT/m/ms. Acquisition time was 90 s per orientation.
Data were acquired at 12 different orientations with angles up to 25.4° relative to the main field. The same phase processing pipeline was followed (BET, FLIRT, STI-Suite) to generate tissue phase images registered onto the neutral frame. Thanks to the increased number of orientations and the larger head coil that allowed greater angles, COSMOS computation was performed using the closed-form solution in Eq.4 without additional regularization. STI eigenvalues were obtained from Eq.7 using an LSQR solver (Paige & Saunders, 1982). Mean Magnetic Susceptibility (MMS) and Magnetic Susceptibility Anisotropy (MSA) were derived from the eigenvalues using χMMS = (λ1 + λ2 + λ3)/3 and χMSA = λ1 − (λ2 + λ3)/2 where λ1 denotes the most paramagnetic component. STI tractography solution and visualization were performed using Diffusion Toolkit and TrackVis (Wang et al., 2007). Tracks of lengths within the range 20 mm to 100 mm were plotted.
3.4 Characterization of Off-Resonance effects for Wave-CAIPI
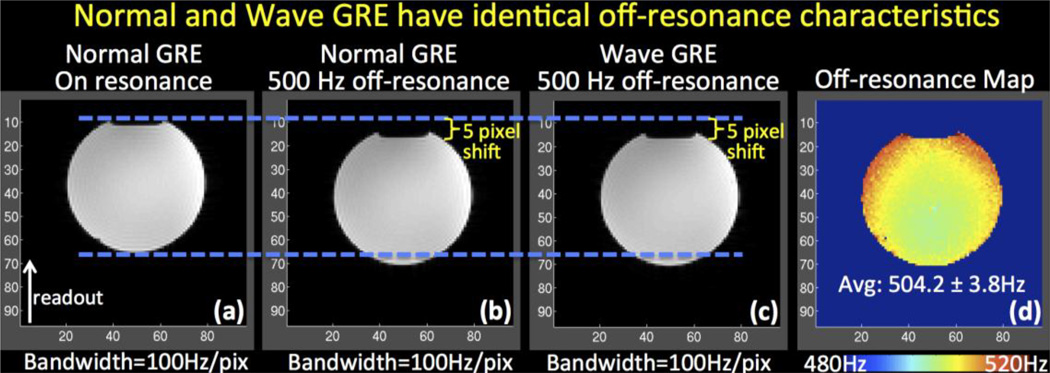
Wave-CAIPI provides a rapid acquisition without undesirable image distortion/blurring from B0 inhomogeneity. This is because Wave-CAIPI traverses k-space in the readout direction with the same constant rate as conventional acquisitions, with B0 inhomogeneity-related phase evolving solely as a function of kx. To validate this, a water phantom was scanned at 3T using conventional and Wave-CAIPI 3D-GRE sequences with 2 mm isotropic resolution, 96×96×60 matrix size, FOV=192×192×120, TR/TE=20/10 ms and 100 Hz/pixel bandwidth. Both datasets were fully-sampled and acquired in the presence of large B0 off-resonance (500 Hz) imposed by manually offsetting the B0 shims. To serve as ground truth, conventional GRE data were also collected on-resonance with otherwise identical parameters. To keep the echo spacing short and prevent phase wraps, B0 mapping was conducted using three sequentially acquired conventional GRE volumes with echo times TE1/TE2/TE3=9.5/10/10.5 ms. It is also possible to employ a single GRE acquisition with multiple echos for field mapping (Robinson et al., 2011; Robinson & Jovicich, 2011), albeit at the cost of more involved processing.
3.5 Comparison to Normal GRE and 2D-CAIPI
To provide quantitative comparison to existing acquisitions techniques, a healthy volunteer (female, age 28) was scanned at a Siemens 3T TIM Trio system. Using the same coil sensitivity calibration protocol, R=15 fold accelerated normal GRE, 2D-CAIPI and Wave-CAIPI data were collected with the same parameter setting as in section 3.3. For parallel imaging, the same set of coil sensitivities were used for all three methods. The reconstruction for normal GRE and 2D-CAIPI employed a direct SENSE inversion, while Wave-CAIPI used iterative SENSE. The software implementation for 2D-CAIPI and Wave-CAIPI reconstruction is available online at martinos.org/~berkin/Wave_Caipi_Toolbox.zip and is detailed in (Bilgic et al., 2015). G-factor analysis was also performed for each dataset.
3.6 Time-SNR Analysis to Quantify Data Quality
A healthy volunteer (male, age 35) was scanned at a Siemens 3T TIM Trio system to quantify the robustness and data quality of Wave-CAIPI. To this end, R=15 fold accelerated normal GRE and Wave-CAIPI data as well as fully-sampled, time-matched normal GRE with reduced slice coverage were acquired. To enable time-SNR analysis, 7 averages were collected during each of the acquisitions. The parameter setting for R=15 fold accelerated normal GRE and Wave-CAIPI was identical to that of section 3.3, corresponding to a scan time of 90 seconds / average. The fully-sampled, time-matched acquisition had substantially reduced slice coverage of 16 slices with identical voxel size of 1.1 mm isotropic. To attain the same 90 seconds / average scan time, the fully-sampled acquisition had also employed reduced in-plane FOV of 204×178.5 mm2 and a corresponding matrix size of 192×168. Following zero padding in image space to size 240×240, fully-sampled data were coil combined using the same sensitivity profiles employed for R=15 parallel imaging reconstruction.
The stability of the acquisition techniques was quantified using time-SNR analysis. The “signal” term in the time-SNR metric was estimated with the mean image computed over the 7 averages. The “noise” term was taken to be the standard deviation across the 7 averages, and the ratio of “signal / noise” yielded the time-SNR estimates. To account for involuntary movement, motion correction was applied using MCFLIRT (Jenkinson et al., 2002) across the averages. Registration matrices for motion correction were estimated on the brain masked magnitude volumes, which were then applied to real and imaginary channels of the complex volumes.
4. Results
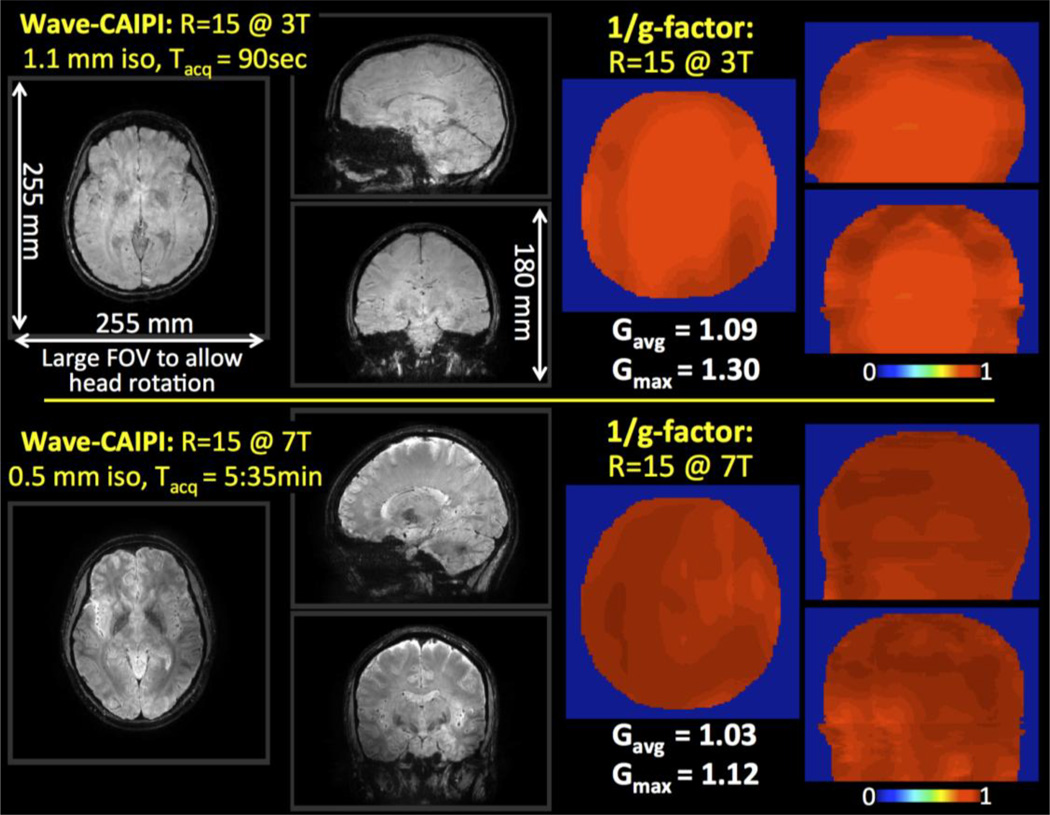
Fig.1 shows Wave-CAIPI reconstructions at 3T and 7T for the neutral head orientation. The large FOV allows for capturing the head rotation without repositioning the acquisition volume. From g-factor analysis, the maximum and average g-factors were found to be gmax = 1.09 and gavg = 1.30 at 3T, and gmax = 1.03 and gavg = 1.12 at 7T.
Fig. 1.
R=15 fold accelerated 3D-GRE with Wave-CAIPI at 3T and 7T. The large FOV (255×255×180 mm3) allows imaging of the entire brain across head orientations without moving the prescribed acquisition volume. G-factor analysis reveals high-quality parallel imaging with reduced noise amplification penalty at both field strengths.
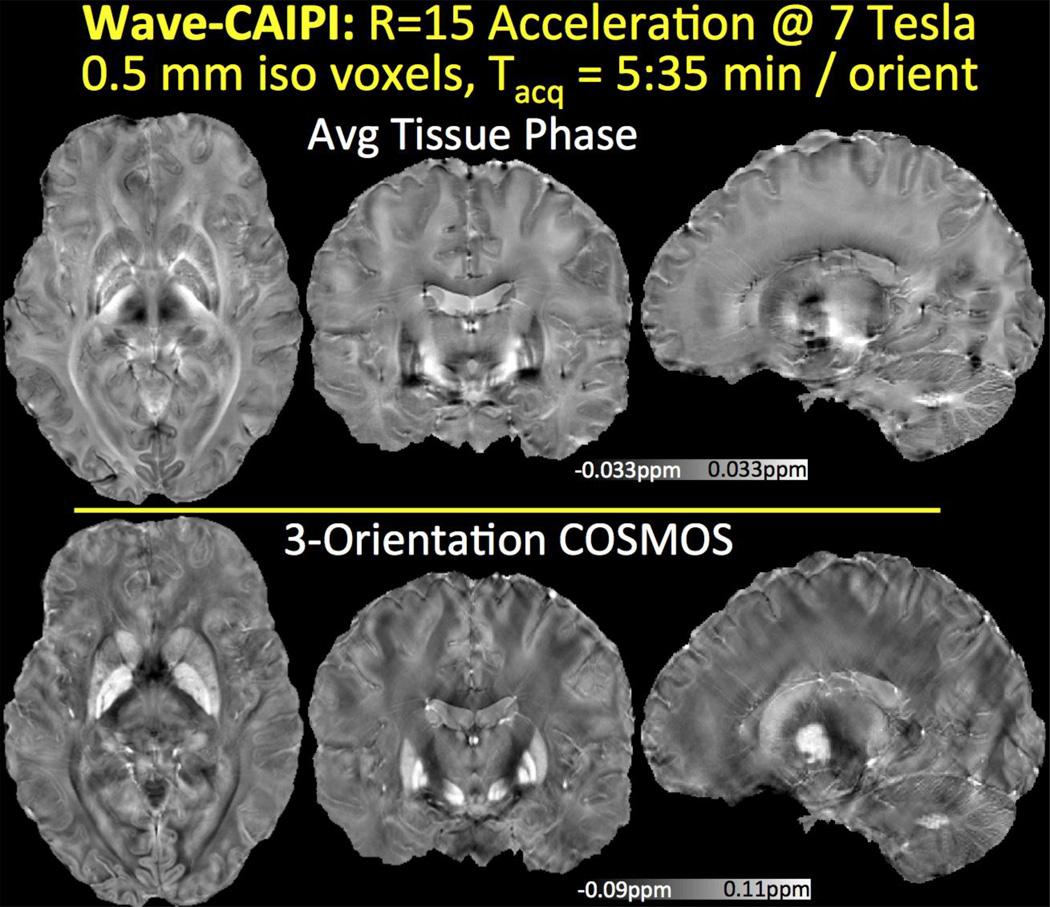
Tissue phase averaged across orientations and the COSMOS reconstruction with 0.5 mm isotropic resolution at 7T are presented in Fig.2. Mean intensity projections are computed over 2.5 mm thick slabs. Detailed depiction and high tissue contrast in the cortex, basal ganglia and cerebellum is observed in phase and susceptibility images.
Fig. 2.
Tissue phase and susceptibility map obtained from 15-fold accelerated Wave-CAIPI acquisition with 0.5 mm isotropic resolution at 7T. High encoding efficiency yields a 5:35 min acquisition per head orientation with long TR/TE = 29/19.5 ms.
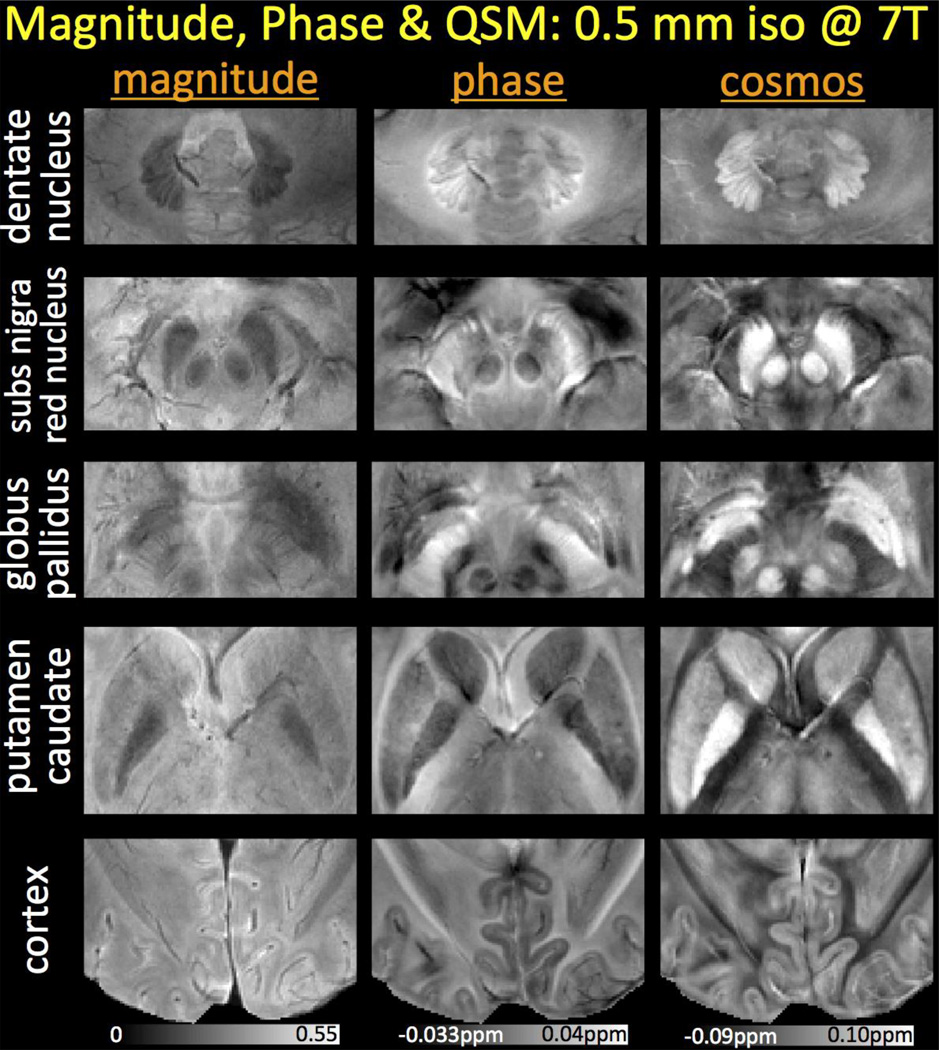
Fig.3 shows a zoomed view of basal ganglia nuclei, cerebellum and gray-white matter contrast in the cortex with high-resolution at 7T. While phase and susceptibility images provide increased conspicuity relative to the magnitude data, COSMOS is seen to yield even better localization than the tissue phase due to deconvolution of the dipole effects.
Fig. 3.
Zoomed views of magnitude, phase and susceptibility reconstructions at 7T. While phase and COSMOS yield higher contrast than the magnitude signal, QSM deconvolution further mitigates the non-local dipole effects seen in the frequency maps. This provides the susceptibility images with the ability to depict the cerebellum, basal ganglia and cerebral cortex with superb contrast.
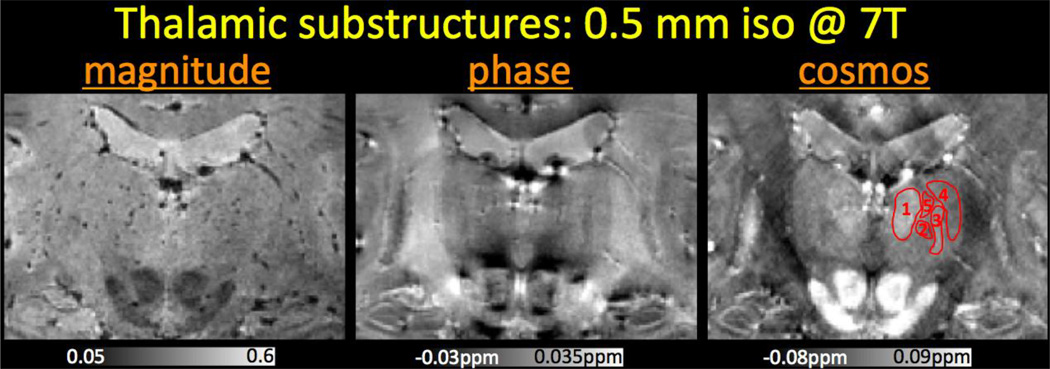
Fig.4 focuses on the thalamic substructures, where the susceptibility contrast shows improved conspicuity in identifying these subtle nuclei.
Fig. 4.
Zoomed views of the thalamic substructures at 7T with 0.5 mm isotropic resolution. The nuclei visible in COSMOS reconstruction from this view are (1) medial dorsal, (2) centromedian and parafascicular, (3) ventral posterior (lateral & medial), (4) ventral lateral, and (5) intralaminar nuclei.
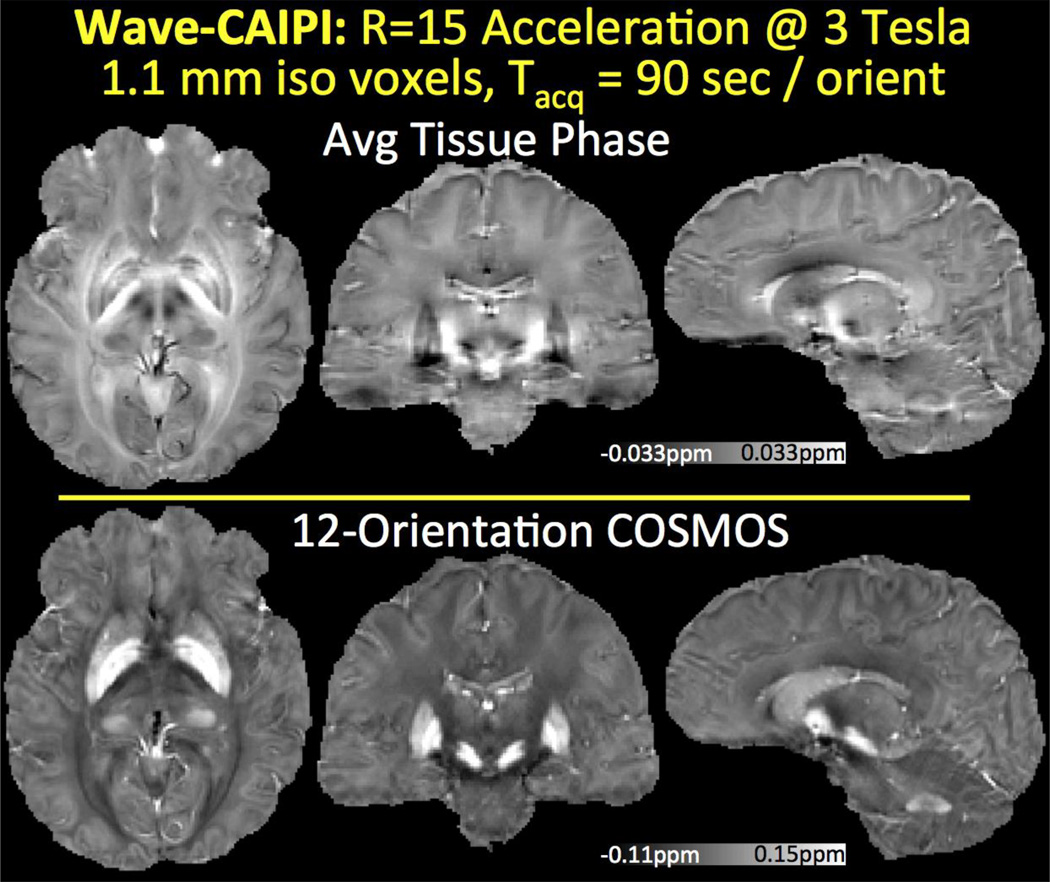
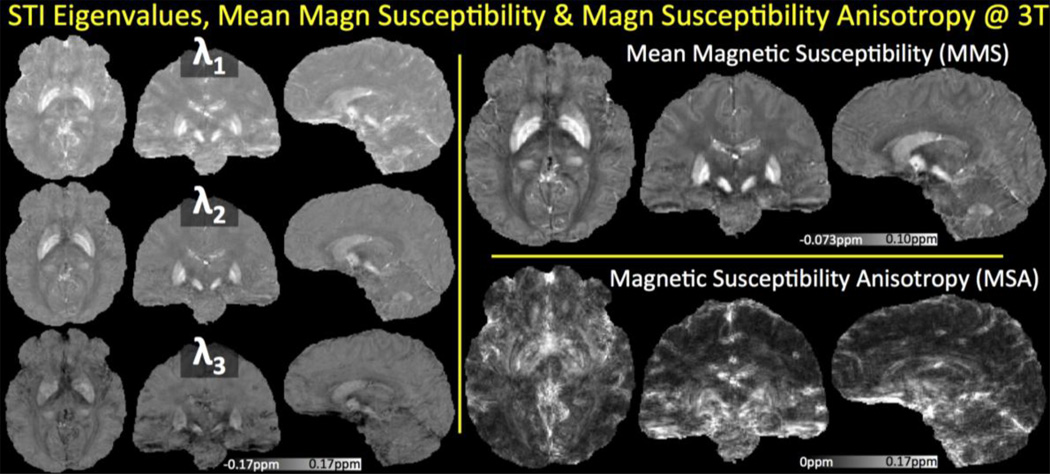
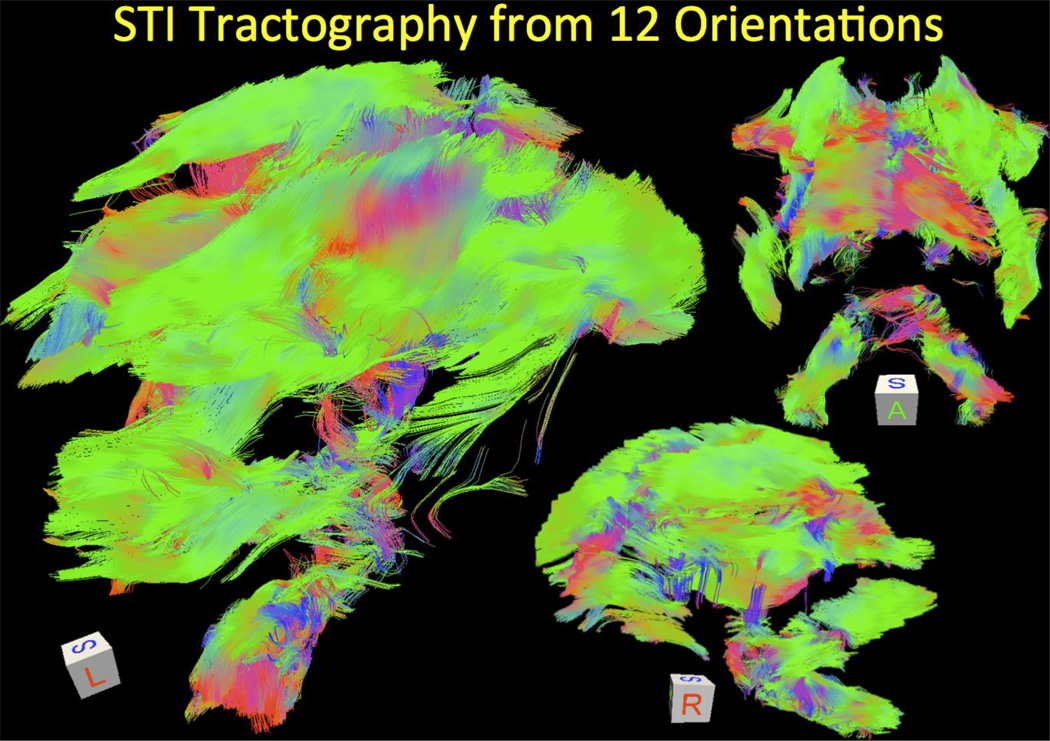
12-orientation Wave-CAIPI acquisition with 1.1 mm isotropic resolution at 3T is used to create the average phase and COSMOS images in Fig.5. In addition to these scalar maps, STI analysis yielded the eigenvalues, MMS and MSA plots depicted in Fig.6. In both figures, mean intensity projections were computed over 3 mm thick slabs. Tractography solution following the major eigenvector led to the fiber visualizations in Fig.7.
Fig. 5.
Tissue phase and COSMOS solution from 12 orientation data acquired using 15-fold accelerated Wave-CAIPI with 1.1 mm isotropic resolution at 3T. For each orientation, this led to a 90 s scan with long TR/TE = 35/25 ms.
Fig. 6.
Susceptibility Tensor Imaging analysis from 12 orientations at 3T. Tensor eigenvalues are depicted on the left, where the principal component λ1 corresponds to the most paramagnetic eigenvalue. The average of the eigenvalues yielded the Mean Magnetic Susceptibility, while the combination λ1−(λ2+λ3)/2 revealed the Magnetic Susceptibility Anisotropy.
Fig. 7.
Tractography solution following the main eigenvector of the STI eigensystem at each voxel. Sagittal and coronal views are shown, where color coding indicates the directionality of the fibers. The orientations are reflected in the cube displayed in each panel.
The effect of off-resonance acquisition for Wave-CAIPI is demonstrated in Fig.8, where the Wave-CAIPI reconstruction results in a sharp image with the same image shift of 5 voxels along the readout direction as the standard acquisition. This illustrates that the Wave trajectory does not incur any undesirable image distortion/blurring from B0 inhomogeneity, and that the off-resonance characteristic is the same as the conventional GRE acquisition.
Fig. 8.
The effect of off-resonance on Wave-CAIPI acquisition is a voxel shift in the readout direction identical to conventional acquisition. (a) Conventional GRE data acquired on-resonance. (b) Conventional GRE acquired at 500 Hz off-resonance. (c) GRE acquired using Wave-CAIPI trajectory at 500 Hz off-resonance. (d) Estimated B0 map.
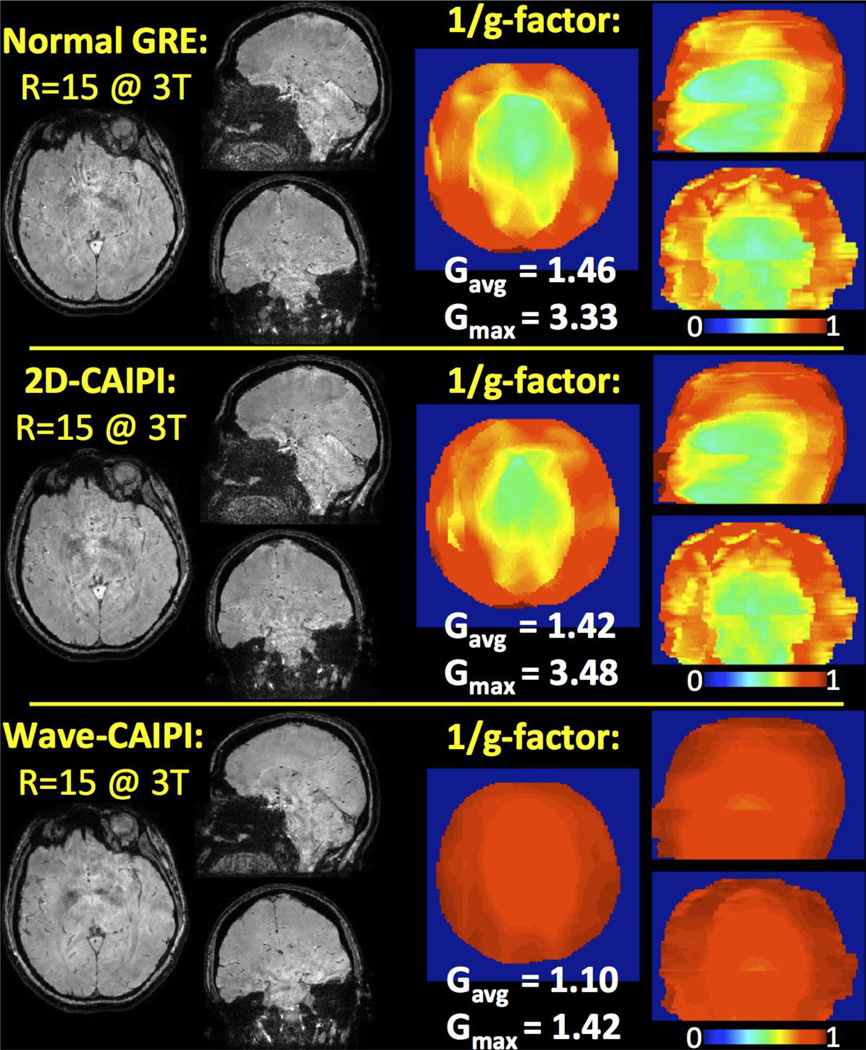
Parallel imaging performance of normal GRE, 2D-CAIPI and Wave-CAIPI are compared in Fig.9. G-factor analysis results are depicted for acceleration factor R=15 with 1.1 mm isotropic voxel size at 3T. The maximum and average g-factors were found to be gmax = 3.33, 3.48 and 1.42, and gavg = 1.46, 1.42 and 1.10 for normal GRE, 2D-CAIPI and Wave-CAIPI, respectively.
Fig. 9.
Parallel imaging performances of normal GRE, 2D-CAIPI and Wave-CAIPI at 3T upon R=15 fold acceleration. Wave-CAIPI reduces the maximum g-factor by more than 2 fold while incurring only 10% noise amplification on average.
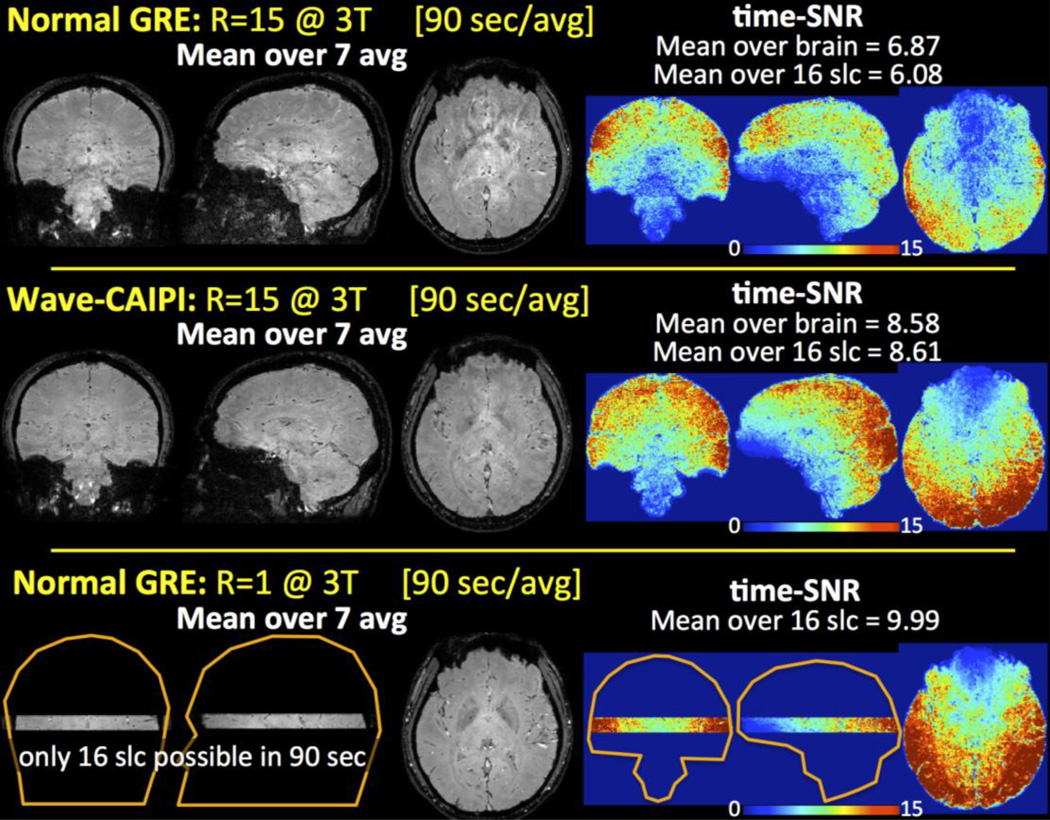
Mean volumes computed over 7 averages and time-SNR analyses are presented in Fig.10. The average time-SNR values inside the brain mask limited to 16 slices were 6.08, 8.61 and 9.99 for R=15 fold accelerated normal GRE, Wave-CAIPI and the fully-sampled normal GRE, respectively. The average time-SNR inside the entire brain mask was 6.87 and 8.58 for R=15 normal GRE and Wave-CAIPI.
Fig. 10.
Mean volumes computed over 7 averages for R=15 normal GRE and Wave-CAIPI, and time-matched, fully-sampled normal GRE. Time-SNR analyses revealed improved stability and robustness in Wave-CAIPI relative to accelerated normal GRE.
5. Discussion
5.1 Wave-CAIPI Acquisition & Reconstruction
Wave-CAIPI modifies the 3D-GRE acquisition to incur interslice shifts in the phase encoding dimension and voxel spreading along the readout direction. This creates a highly efficient sampling strategy that spreads the aliasing in all 3 spatial dimensions. Unlike EPI sampling, the Wave trajectory incurs no geometric distortion, and the off-resonance effect is simply a voxel shift in the readout direction identical to what is seen in a conventional 3D-GRE acquisition (shown in Fig.8). The Wave trajectory creates the same amount of voxel shift in the readout direction due to B0 inhomogeneity as would any Cartesian acquisition, with no additional blurring or distortion. The reason for the off-resonance characteristic that is identical to that of a conventional GRE is that the off-resonance phase in Wave-CAIPI evolves only as a function of kx and not ky/kz. The relatively low readout bandwidth (100 Hz/pixel) was chosen to improve the SNR. This would lead to ~5 mm fat-water shift at both 3T and 7T (assuming 450 Hz frequency shift and 1.1 mm spatial resolution at 3T, and 1050 Hz shift and 0.5 mm resolution at 7T). This amount of fat-water shift was relatively small and did not cause signal overlap across subcutaneous lipid and brain voxels (Fig.1). Even though the subject’s head undergoes a rigid rotation and shimming is applied per each orientation, field inhomogeneity is likely to cause to imperfect alignment of the rotated scans. To mitigate this issue, we employed registration with 12 degrees of freedom rather than the more restrictive rigid body (6 degrees of freedom) registration.
The point-spread formalism permits Cartesian treatment of this non-Cartesian trajectory, thus obviating the need for gridding or non-uniform FFT (Fessler & Sutton, 2003). PSF estimation was performed prior to human scanning on a head phantom, independently of the in vivo acquisitions, hence requiring no additional scan time for the human subjects. Parallel imaging reconstruction is currently performed in Matlab, and takes 1 hour for 1.1 mm isotropic whole-brain data. Fast reconstruction employing the efficient Berkeley Advanced Reconstruction Toolbox (BART) is in progress (Uecker et al., 2013), and can potentially speed up the reconstruction by an order of magnitude.
Since the loading of the receive array is affected as the subject’s head moves, coil sensitivity calibration is performed for each head rotation. The current study uses fast 3D-GRE acquisitions with head and body coil reception using the shortest TR/TE combination possible, which require 23 s per volume. Coil sensitivities obtained from the head/body coil normalization provide high-quality parallel imaging and phase-sensitive coil combination. This is because this normalization eliminates the magnitude and phase contrast belonging to the imaged object, and yields the underlying coil profile. The normalized coil profiles are further smoothed with polynomial fitting and iteratively processed using JSENSE to improve their fidelity. Processing this calibration information with the recent ESPIRiT algorithm (Uecker et al., 2014) will allow automated coil profile estimation, and obviate the need for polynomial smoothing.
Application of highly accelerated Wave-CAIPI imaging to multi-orientation QSM may facilitate the research and clinical investigations of COSMOS and STI protocols. At 15-fold acceleration, the maximum g-factor noise amplification penalty gmax due to parallel imaging reconstruction remains below 1.30 at 3T and 1.12 at 7T (Fig.1). This dramatic speed-up may particularly be useful for STI acquisition, which has been limited to animal and highly-compliant human studies to date, requiring up to 4 hours of scanning (Li et al., 2012a; Wisnieff et al., 2013). Wave-CAIPI acceleration permits a 30-minute full STI examination with 12 orientations (Figs.5–7), including coil sensitivity calibration and shimming for each orientation (18 min for Wave-CAIPI + 8 min for coil profiles + 4 min for shimming). It also allows COSMOS imaging with 0.5 mm isotropic resolution and 3 orientations to be completed in 20 minutes (17 minutes for Wave-CAIPI, 3 min for calibration and shimming). With the ability to provide exquisite cortical contrast and superb depiction of basal ganglia nuclei and cerebellum (Figs.2&3), rapid Wave-CAIPI imaging at ultra-high-resolution may pave the way towards “in vivo histology” through MRI (Deistung et al., 2013). During the long scan time (17 minutes/orientation, w/o parallel imaging, 0.4 mm isotropic resolution, TE=10.5 ms) required in the elegant COSMOS study by Deistung et al., involuntary subject movement will become an additional complication. Upon 15-fold acceleration, we substantially reduce the motion sensitivity while providing a practical acquisition time-frame and improved phase contrast at the longer TE of 19.5 ms.
In addition to providing exquisite contrast in the cortex, basal ganglia and cerebellum, high-resolution susceptibility mapping enabled identification of thalamic substructures at ultra high field. The lateral dorsal, medial dorsal, centromedian and ventral posterior (lateral and medial) nuclei of the thalamus were particularly discernable in the susceptibility map (Fig.4). Conversely, the magnitude contrast was low and homogenous throughout the thalamus and the phase image suffered from non-local dipole effects that prohibited observation of these nuclei. The more easily distinguishable substructures, anterior, ventral anterior, pulvinar, medial geniculate and lateral geniculate nuclei, were observed in the susceptibility maps and the magnitude images. Susceptibility contrast had again superior conspicuity in these substructures. Having the ability to scroll through the QSM volume while evaluating the contrast helped us delineate these substructures.
High-resolution COSMOS imaging provides detailed depiction of iron-rich deep gray matter structures including the substantia nigra, subthalamic nucleus, globus pallidus, red nucleus, putamen and caudate as well as the dentate nucleus in the cerebellum (Fig.3). As excessive iron deposition in these nuclei occurs in a variety of neurodegenerative disorders, e.g. Alzheimer's disease (Acosta-Cabronero et al., 2013) and multiple sclerosis (Langkammer et al., 2013), susceptibility mapping has the potential of providing a tool for monitoring or even diagnosis. Furthermore, the superb contrast-to-noise ratio in the susceptibility images of the subthalamic nucleus, substantia nigra and globus pallidus may facilitate precise electrode placement in deep brain stimulation (DBS) (Liu et al., 2013b; Deistung et al., 2013). STI, on the other hand, is an emerging tool for measurement and quantification of susceptibility anisotropy in white matter, which mainly originates from the myelin membrane lipids (Li et al., 2012a). STI is being developed as a high-resolution fiber tracking technique as GRE acquisitions attain sub-millimeter resolution with high SNR (Liu et al., 2014). It is has been recently reported that prenatal alcohol exposure significantly reduces susceptibility anisotropy of the white matter, and magnetic susceptibility may be more sensitive than DTI for detecting subtle myelination changes (Cao et al., 2014). Mapping the susceptibility anisotropy is a key step in analyzing STI data, and has already been demonstrated in (Liu et al., 2013a; Xie et al., 2014; Li et al., 2012b). In this work, we have taken this analysis further to demonstrate the first STI tractography in the human brain.
The benefits of employing signal reception at ultra-high-field strength in this study were three-fold: (i) In addition to the increased SNR in the complex signal, phase evolution also occurs at a faster rate proportional to the main field strength. Compared to 3T, this permits similar tissue contrast to be attained at a shorter TE values, thus making it possible to use a smaller TR at 7T. (ii) Increased orthogonality of the coil sensitivity profiles due to reduced wavelength provides better parallel imaging performance (Wiesinger et al., 2004), as can be seen in the g-factor analysis in Fig.1. (iii) Tight-fitting custom head coil brings the detector elements closer to the head, thus yielding increased SNR and g-factor performance. This, however, also presents a disadvantage for COSMOS imaging. Due to limited space, the largest degree of rotation was only 13° at 7T, whereas up to 40° of rotation was possible with the product head coil at 3T. This constraint necessitated Tikhonov regularization to mitigate residual streaking artifacts (Fig.2). Acquiring additional head orientations will improve the conditioning of the inversion, albeit at the cost of additional scan time.
Wave-CAIPI had been previously shown to provide substantial improvement in image quality relative to normal GRE acquisitions at 3T and 7T (Bilgic et al., 2015). This improvement had been quantified by computing g-factor maps as well as reconstruction errors relative to fully sampled acquisition. At R=9 fold acceleration, Wave-CAIPI had achieved 2 fold reduction in the maximum g-factor and reconstruction error compared to normal GRE. Herein, we have further compared g-factor noise amplification at R=15 fold acceleration for normal GRE, 2D-CAIPI and Wave-CAIPI methods (Fig.9). As it provides more than 2 fold reduction in maximum g-factor, rapid acquisition with Wave-CAIPI is again seen to retain high image quality. We note that the improvement due to 2D-CAIPI over normal GRE was minimal because the employed slice shift was not optimal. We have used an FOV/2 shift factor, which leads to an FOV/10 shift in the collapsed space at R=5-fold in-plane undersampling. Due to such small shift, the variation in coil sensitivities has not increased significantly, and the g-factor benefit was minimal.
Further, the stability and robustness of Wave-CAIPI in providing improved data quality was quantified through time-SNR analysis (Fig.10). Compared to the fully-sampled, time-matched normal GRE acquisition, R=15 fold accelerated Wave-CAIPI retained 86% of the time-SNR while dramatically improving the slice coverage. Conversely, time-SNR of R=15 normal GRE acquisition remained at 61% of the fully-sampled data. While acquiring larger number of repetitions would provide a more robust measure of time-SNR, we limited the repetitions to 7 averages per method to complete the in vivo scan under 45 minutes. This has allowed us to keep inter- and intra- repetition motion to a minimum. Despite this, intra-repetition motion correction was applied to improve fidelity of tSNR metrics.
Wave-CAIPI multi-orientation acquisitions detailed herein employed a large FOV (255 mm in-plane) that was held constant throughout the head rotations. This way, repositioning the acquisition volume was not necessary, and a single rotation matrix was sufficient to describe the orientation relative to the main field. Employing tight-fitting FOV acquisition at lower acceleration factor with repositioning of the acquisition box at each head orientation would result in similar parallel imaging performance. However, this would entail a more complicated reconstruction, requiring the inclusion of additional rotation matrices.
5.3 Extensions
Analysis on numerical phantom and in vivo data in (Li & van Zijl, 2014) indicate that the maximum degree of head rotation is more important than the total number of head orientations to minimize the angular error in STI fiber orientation. It could then be a viable strategy to use a larger head coil, such as the 20-channel product coil, and achieve larger degrees of rotation. Due to reduced channel count, the parallel reception capability will decrease, e.g. R=9 acceleration with Wave-CAIPI may provide similar g-factor performance to the 32-channel case with R=15 fold speed-up. The increase in acquisition time could then be balanced by reducing the number of head orientations to e.g. 8, and while retaining similar, or potentially better, STI fiber orientation fidelity. The reconstruction quality can also be improved by constraining the gray matter and CSF voxels to have isotropic susceptibility, thus reducing the number of unknowns in the STI inverse problem (Li & van Zijl, 2014).
Another interesting venue in STI research is the use of tensor orientation and symmetry constraints with the help of additional DTI data (Li et al., 2012b; Wisnieff et al., 2013). This strategy can be used to synergistically combine DTI with accelerated Wave-CAIPI data, thus making a 10-minute STI examination possible with 4 orientations and 1.1 mm isotropic resolution.
Strong magnetic susceptibility differences near air-tissue and air-bone interfaces induce macroscopic static magnetic field inhomogeneity that hampers the investigation of inferior frontal and temporal brain regions. This has motivated specialized hardware development for compensation of these effects (Pan et al., 2012; Juchem et al., 2011; Stockmann et al., 2014; Truong et al., 2014). We expect such hardware to improve the fidelity of STI tractography, especially in the vicinities of the nasal cavity and ear canals. Further comparison and validation against DTI tractography is warranted to investigate the fidelity of these tracts.
Due to the long TE required for building up phase and susceptibility contrast, single-echo 3D-GRE acquisition has considerable dead time prior to data sampling window. This unused time can be utilized by sampling additional echos, which can be combined in a weighted average to improve magnitude and phase SNR (Wu et al., 2012a). Alternatively, “echo-shifting” approach can be used to improve encoding efficiency at the cost of SNR (Liu et al., 1993; Feinberg et al., 2002; Loenneker et al., 1996). Echo-shift strategy has the potential to provide further improvement in acquisition efficiency of Wave-CAIPI, thus attaining >20-fold acceleration. To this end, MultiPINS pulses (Eichner et al., 2014; Norris et al., 2011) can be utilized to excite sets of “comb” slices that cover the entire brain. Considering an echo-shift factor of 2×, it is possible to employ 2 RF excitation pulses, 1st RF exciting odd numbered slices, and 2nd RF exciting even numbered slices. By playing RF pulses during the unused period before the data acquisition, sequence timing can be fully utilized to obtain >1.5-fold improvement in efficiency.
The maximum gradient/slew specifications of the Wave corkscrew trajectory were relatively mild for the low-bandwidth acquisitions employed in this work. For higher bandwidth (e.g. multi-echo or EPI) acquisitions, it will be necessary to push the system closer to its limits to provide substantial g-factor reduction. Due to the fast Gx encoding utilized in EPI, Gy and Gz corkscrew gradients can be used with a single rather than multiple cycles per kx readout. This would enable corkscrew trajectory with a large enough radius to be generated effectively to spread the aliasing.
6. Conclusions
Wave-CAIPI acquisition/reconstruction technique allows 15-fold accelerated 3D-GRE acquisition with high image quality and reduced g-factor noise amplification penalty. This speed-up can facilitate the acquisition of STI and COSMOS protocols, which require data acquired at multiple head orientations relative to the main field. At 7T, Wave-CAIPI allows whole-brain COSMOS imaging at 0.5 mm isotropic voxel size in 5:35 min/orientation. Accounting for shimming and coil sensitivity calibration, this enables a 20-minute protocol with superb depiction of cortical contrast, midbrain and basal ganglia. At 3T, 15-fold acceleration enables a 90 s/orientation acquisition with 1.1 mm isotropic resolution and whole-brain coverage. Including shimming and sensitivity calibration, this makes a 30-minute STI examination with 12 head rotations possible.
Research highlights.
15-fold acceleration with Wave-CAIPI facilitates COSMOS and STI acquisition
G-factor noise amplification of Wave-CAIPI is below 1.30 at 3T and 1.12 at 7T
Efficient acquisition permits in vivo STI tractography in human brain for the first time
Acknowledgement
Grant sponsor: NIH; Grant numbers: R00EB012107, P41RR14075, R01EB017337, R01MH096979, R01NS079653 and R21-HL122759.
Grant sponsor: the NIH Blueprint for Neuroscience; Grant number: 1U01MH093765 (Human Connectome Project)
Abbreviations
- GRE
gradient echo
- SWI
susceptibility weighted imaging
- QSM
quantitative susceptibility mapping
- STI
susceptibility tensor imaging
- SNR
signal-to-noise ratio
- TE
echo time
- TR
repetition time
- COSMOS
calculation of susceptibility through multi-orientation sampling
- CAIPI
controlled aliasing in parallel imaging
- CS
compressed sensing
- DTI
diffusion tensor imaging
- CSF
cerebrospinal fluid
- FFT
fast Fourier transform
- SHARP
sophisticated harmonic artifact reduction for phase
Footnotes
Publisher's Disclaimer: This is a PDF file of an unedited manuscript that has been accepted for publication. As a service to our customers we are providing this early version of the manuscript. The manuscript will undergo copyediting, typesetting, and review of the resulting proof before it is published in its final citable form. Please note that during the production process errors may be discovered which could affect the content, and all legal disclaimers that apply to the journal pertain.
| COSMOS and STI: | martinos.org/~berkin/COSMOS_STI_Toolbox.zip |
References
- Acosta-Cabronero J, Williams G, Cardenas-Blanco A, Arnold RJ, Lupson V, Nestor PJ. In Vivo Quantitative Susceptibility Mapping (QSM) in Alzheimer’s Disease. PloS one. 2013;8(11):81093. doi: 10.1371/journal.pone.0081093. [DOI] [PMC free article] [PubMed] [Google Scholar]
- Bilgic B, Gagoski BA, Cauley SF, Fan AP, Polimeni JR, Grant PE, Wald LL, Setsompop K. Wave-CAIPI for highly accelerated 3D imaging. Magnetic resonance in medicine. 2015;73(6):2152–2162. doi: 10.1002/mrm.25347. [DOI] [PMC free article] [PubMed] [Google Scholar]
- Breuer F, Blaimer M, Mueller MF, Seiberlich N, Heidemann RM, Griswold MA, Jakob PM. Controlled aliasing in volumetric parallel imaging (2D CAIPIRINHA) Magnetic Resonance in Medicine. 2006;55.3:549–556. doi: 10.1002/mrm.20787. [DOI] [PubMed] [Google Scholar]
- Cao W, Li W, Han H, O’Leary-Moore S, Sulik KK, Johnson GA, Liu C. Prenatal alcohol exposure reduces magnetic susceptibility contrast and anisotropy in the white matter of mouse brains. NeuroImage. 2014;102:748–755. doi: 10.1016/j.neuroimage.2014.08.035. [DOI] [PMC free article] [PubMed] [Google Scholar]
- Conolly S, Nishimura D, Mackovski A, Glover G. Variable-rate selective excitation. Journal of Magnetic Resonance. 1988;78(3):440–458. [Google Scholar]
- Deistung A, Schäfer A, Schweser F, Biedermann U, Turner R, Reichenbach JR. Toward in vivo histology: A comparison of quantitative susceptibility mapping (QSM) with magnitude-, phase-, and R2*-imaging at ultra-high magnetic field strength. NeuroImage. 2013;65:299–314. doi: 10.1016/j.neuroimage.2012.09.055. [DOI] [PubMed] [Google Scholar]
- Dibb R, Xie L, Liu C. Magnetic Susceptibility Anisotropy of the Myocardium. Proceedings of the 22nd Annual Meeting of ISMRM; Milan, Italy. 2014. p. 627. 2014. [Google Scholar]
- Eichner C, Wald LL, Setsompop K. A low power radiofrequency pulse for simultaneous multislice excitation and refocusing. Magnetic Resonance in Medicine. 2014;72(4):949–958. doi: 10.1002/mrm.25389. [DOI] [PubMed] [Google Scholar]
- Feinberg DA, Reese TG, Wedeen VJ. Simultaneous echo refocusing in EPI. Magnetic resonance in medicine. 2002;48(1):1–5. doi: 10.1002/mrm.10227. [DOI] [PubMed] [Google Scholar]
- Fessler J, Sutton B. Nonuniform fast Fourier transforms using min-max interpolation. IEEE transactions on signal processing. 2003;51(2):560–574. [Google Scholar]
- Jenkinson M, Bannister P, Brady M, Smith S. Improved optimization for the robust and accurate linear registration and motion correction of brain images. Neuroimage. 2002;17(2):825–841. doi: 10.1016/s1053-8119(02)91132-8. [DOI] [PubMed] [Google Scholar]
- Juchem C, Nixon TW, McIntyre S, Boer VO, Rothman DL, de Graaf RA. Dynamic multi-coil shimming of the human brain at 7 T. Journal of magnetic resonance (San Diego, Calif.: 1997) 2011;212(2):280–288. doi: 10.1016/j.jmr.2011.07.005. [DOI] [PMC free article] [PubMed] [Google Scholar]
- Keil B, Triantafyllou C, Hamm M, Wald LL. Proc. Intl. Soc. Mag. Reson. Med. 18 (2010) Stockholm, Sweden: 2010. Design optimization of a 32-channel head coil at 7 T; p. 1493. 2010. [Google Scholar]
- Langkammer C, Liu T, Khalil M, Enzinger C, Jehna M, Fuchs S, Fazekas F, Wang Y, Ropele S. Quantitative susceptibility mapping in multiple sclerosis. Radiology. 2013;267(2):551–559. doi: 10.1148/radiol.12120707. [DOI] [PMC free article] [PubMed] [Google Scholar]
- Li W, Wu B, Avram AV, Liu C. Magnetic susceptibility anisotropy of human brain in vivo and its molecular underpinnings. NeuroImage. 2012a;59(3):2088–2097. doi: 10.1016/j.neuroimage.2011.10.038. [DOI] [PMC free article] [PubMed] [Google Scholar]
- Li W, Wu B, Liu C. Quantitative susceptibility mapping of human brain reflects spatial variation in tissue composition. Neuroimage. 2011;55(4):1645–1656. doi: 10.1016/j.neuroimage.2010.11.088. [DOI] [PMC free article] [PubMed] [Google Scholar]
- Li X, Vikram DSD, Lim IALI, Jones CKC, Farrell JaD, van Zijl PCM. Mapping magnetic susceptibility anisotropies of white matter in vivo in the human brain at 7T. Neuroimage. 2012b;62(1):314–330. doi: 10.1016/j.neuroimage.2012.04.042. [DOI] [PMC free article] [PubMed] [Google Scholar]
- Li X, van Zijl PCM. Mean magnetic susceptibility regularized susceptibility tensor imaging (MMSR-STI) for estimating orientations of white matter fibers in human brain. Magnetic resonance in medicine. 2014;72(3):610–619. doi: 10.1002/mrm.25322. [DOI] [PMC free article] [PubMed] [Google Scholar]
- Liu C. Susceptibility tensor imaging. Magnetic Resonance in Medicine. 2010;63(6):1471–1477. doi: 10.1002/mrm.22482. [DOI] [PMC free article] [PubMed] [Google Scholar]
- Liu C, Li W, Tong K, Yeom KW, Kuzminski S. Susceptibility-weighted imaging and quantitative susceptibility mapping in the brain. Journal of Magnetic Resonance Imaging. 2014 doi: 10.1002/jmri.24768. Early view (DOI: 10.1002/jmri.24768). [DOI] [PMC free article] [PubMed] [Google Scholar]
- Liu C, Li W, Wu B, Jiang Y, Johnson GA. 3D fiber tractography with susceptibility tensor imaging. NeuroImage. 2012a;59(2):1290–1298. doi: 10.1016/j.neuroimage.2011.07.096. [DOI] [PMC free article] [PubMed] [Google Scholar]
- Liu C, Murphy NE, Li W. Probing white-matter microstructure with higher-order diffusion tensors and susceptibility tensor MRI. Frontiers in integrative neuroscience. 2013a;7:11. doi: 10.3389/fnint.2013.00011. [DOI] [PMC free article] [PubMed] [Google Scholar]
- Liu G, Sobering G, Duyn J, Moonen CTW. A. functional MRI technique combining principles of echo-shifting with a train of observations (PRESTO) Magnetic Resonance in Medicine. 1993;30(6):764–768. doi: 10.1002/mrm.1910300617. [DOI] [PubMed] [Google Scholar]
- Liu J, Liu T, de Rochefort L, Ledoux J, Khalidov I, Chen W, Tsiouris AJ, Wisnieff C, Spincemaille P, Prince MR, Wang Y. Morphology enabled dipole inversion for quantitative susceptibility mapping using structural consistency between the magnitude image and the susceptibility map. NeuroImage. 2012b;59(3):2560–2568. doi: 10.1016/j.neuroimage.2011.08.082. [DOI] [PMC free article] [PubMed] [Google Scholar]
- Liu T, Eskreis-Winkler S, Schweitzer AAD, Chen W, Kaplitt MG, Tsiouris, a J, Wang Y. Improved Subthalamic Nucleus Depiction with Quantitative Susceptibility Mapping. Neuroradiology. 2013b;269(1):216–223. doi: 10.1148/radiol.13121991. [DOI] [PMC free article] [PubMed] [Google Scholar]
- Liu T, Liu J, de Rochefort L, Spincemaille P, Khalidov I, Ledoux JR, Wang Y. Morphology enabled dipole inversion (MEDI) from a single-angle acquisition: comparison with COSMOS in human brain imaging. Magnetic Resonance in Medicine. 2011;66(3):777–783. doi: 10.1002/mrm.22816. [DOI] [PubMed] [Google Scholar]
- Liu T, Spincemaille P, de Rochefort L, Kressler B, Wang Y. Calculation of susceptibility through multiple orientation sampling (COSMOS): a method for conditioning the inverse problem from measured magnetic field map to susceptibility source image in MRI. Magnetic Resonance in Medicine. 2009;61(1):196–204. doi: 10.1002/mrm.21828. [DOI] [PubMed] [Google Scholar]
- Loenneker T, Hennel F, Hennig J. Multislice interleaved excitation cycles (MUSIC): An efficient gradient-echo technique for functional MRI. Magnetic Resonance in Medicine. 1996;35(6):870–874. doi: 10.1002/mrm.1910350613. [DOI] [PubMed] [Google Scholar]
- Marques JP, Bowtell R. Application of a Fourier-based method for rapid calculation of field inhomogeneity due to spatial variation of magnetic susceptibility. Concepts in Magnetic Resonance Part B: Magnetic Resonance Engineering. 2005;25B(1):65–78. [Google Scholar]
- Norris D, Koopmans PJ, Boyacioğlu R, Barth M. Power independent of number of slices (PINS) radiofrequency pulses for low-power simultaneous multislice excitation. Magnetic Resonance in Medicine. 2011;66(5):1234–1240. doi: 10.1002/mrm.23152. [DOI] [PubMed] [Google Scholar]
- Paige C, Saunders M. LSQR: An algorithm for sparse linear equations and sparse least squares. ACM Transactions on Mathematical Software. 1982;8(1):43–71. [Google Scholar]
- Pan JW, Lo K-M, Hetherington HP. Role of very high order and degree B0 shimming for spectroscopic imaging of the human brain at 7 tesla. Magnetic resonance in medicine. 2012;68(4):1007–1017. doi: 10.1002/mrm.24122. [DOI] [PMC free article] [PubMed] [Google Scholar]
- Pruessmann K, Weiger M, Scheidegger MB, Boesiger P. SENSE: sensitivity encoding for fast MRI. Magnetic Resonance in Medicine. 1999;42.5:952–962. [PubMed] [Google Scholar]
- Robinson S, Grabner G, Witoszynskyj S, Trattnig S. Combining phase images from multi-channel RF coils using 3D phase offset maps derived from a dual-echo scan. Magnetic Resonance in Medicine. 2011;65(6):1638–1648. doi: 10.1002/mrm.22753. [DOI] [PubMed] [Google Scholar]
- Robinson S, Jovicich J. B0 mapping with multi-channel RF coils at high field. Magnetic resonance in medicine. 2011;66(4):976–988. doi: 10.1002/mrm.22879. [DOI] [PubMed] [Google Scholar]
- Rochefort L, de Brown R, Prince MR, Yi W. Quantitative MR susceptibility mapping using piece-wise constant regularized inversion of the magnetic field. Magnetic Resonance in Medicine. 2008;60(4):1003–1009. doi: 10.1002/mrm.21710. [DOI] [PubMed] [Google Scholar]
- De Rochefort L, Liu T, Kressler B, Liu J, Spincemaille P, Lebon V, Wu J, Wang Y. Quantitative susceptibility map reconstruction from MR phase data using bayesian regularization: validation and application to brain imaging. Magnetic Resonance in Medicine. 2010;63(1):194–206. doi: 10.1002/mrm.22187. [DOI] [PubMed] [Google Scholar]
- Schweser F, Sommer K, Deistung A, Reichenbach JR. Quantitative susceptibility mapping for investigating subtle susceptibility variations in the human brain. NeuroImage. 2012;62(3):2083–2100. doi: 10.1016/j.neuroimage.2012.05.067. [DOI] [PubMed] [Google Scholar]
- Shmueli K, Zwart J, de Gelderen P, van Li T, Dodd SJ, Duyn JH. Magnetic susceptibility mapping of brain tissue in vivo using MRI phase data. Magnetic Resonance in Medicine. 2009;62(6):1510–1511. doi: 10.1002/mrm.22135. [DOI] [PMC free article] [PubMed] [Google Scholar]
- Smith S. Fast robust automated brain extraction. Human brain mapping. 2002;17:143–155. doi: 10.1002/hbm.10062. [DOI] [PMC free article] [PubMed] [Google Scholar]
- Stockmann J, Witzel T, Keil B, Mareyam A, Polimeni J, LaPierre C, Wald L. Proc. Intl. Soc. Mag. Reson. Med. Vol. 22. Milan, Italy: 2014. A 32ch combined RF-shim brain array for efficient B0 shimming and RF reception at 3T; p. 400. 2014. [Google Scholar]
- Truong T-K, Darnell D, Song AW. Integrated RF/shim coil array for parallel reception and localized B0 shimming in the human brain. NeuroImage. 2014;103C:235–240. doi: 10.1016/j.neuroimage.2014.09.052. [DOI] [PMC free article] [PubMed] [Google Scholar]
- Uecker M, Lai P, Murphy M, Virtue P, Elad M, Pauly JM, Vasanawala S, Lustig M. ESPIRiT—an eigenvalue approach to autocalibrating parallel MRI: Where SENSE meets GRAPPA. Magnetic Resonance in Medicine. 2014;71(3):990–1001. doi: 10.1002/mrm.24751. [DOI] [PMC free article] [PubMed] [Google Scholar]
- Uecker M, Virtue P, Ong F, Murphy M, Alley M, Vasanawala S, Lustig M. ISMRM Workshop on Data Sampling and Image Reconstruction. Sedona: 2013. Software Toolbox and Programming Library for Compressed Sensing and Parallel Imaging. 2013. [Google Scholar]
- Wang R, Benner T, Sorensen A, Wedeen VJ. Proc Intl Soc Mag Reson Med. Vol. 15. Berlin, Germany: 2007. Diffusion toolkit: a software package for diffusion imaging data processing and tractography; p. 3720. [Google Scholar]
- Wharton S, Bowtell R. Whole-brain susceptibility mapping at high field: a comparison of multiple- and single-orientation methods. Neuroimage. 2010;53(2):515–525. doi: 10.1016/j.neuroimage.2010.06.070. [DOI] [PubMed] [Google Scholar]
- Wiesinger F, Moortele V, de Adriany G, De Zanche N, Ugurbil K, Pruessmann KP. Parallel imaging performance as a function of field strength—an experimental investigation using electrodynamic scaling. Magnetic Resonance in Medicine. 2004;52(5):953–964. doi: 10.1002/mrm.20281. [DOI] [PubMed] [Google Scholar]
- Wisnieff C, Liu T, Spincemaille P, Wang S, Zhou D, Wang Y. Magnetic susceptibility anisotropy: Cylindrical symmetry from macroscopically ordered anisotropic molecules and accuracy of MRI measurements using few orientations. NeuroImage. 2013;70C:363–376. doi: 10.1016/j.neuroimage.2012.12.050. [DOI] [PMC free article] [PubMed] [Google Scholar]
- Wu B, Li W, Avram AAV, Gho SS-M, Liu C. Fast and tissue-optimized mapping of magnetic susceptibility and T2* with multi-echo and multi-shot spirals. NeuroImage. 2012a;59(1):297–305. doi: 10.1016/j.neuroimage.2011.07.019. [DOI] [PMC free article] [PubMed] [Google Scholar]
- Wu B, Li W, Guidon A, Liu C. Whole brain susceptibility mapping using compressed sensing. Magnetic Resonance in Medicine. 2012b;67(1):137–147. doi: 10.1002/mrm.23000. [DOI] [PMC free article] [PubMed] [Google Scholar]
- Xie L, Dibb R, Cofer GP, Li W, Nicholls PJ, Johnson GA, Liu C. Susceptibility tensor imaging of the kidney and its microstructural underpinnings. Magnetic resonance in medicine. 2014 doi: 10.1002/mrm.25219. [DOI] [PMC free article] [PubMed] [Google Scholar]
- Ying L, Sheng J. Joint image reconstruction and sensitivity estimation in SENSE (JSENSE) Magnetic Resonance in Medicine. 2007;57(6):1196–1202. doi: 10.1002/mrm.21245. [DOI] [PubMed] [Google Scholar]


