

Abstract
Forward genetic screens using Sleeping Beauty (SB)-mobilized T2/Onc transposons have been used to identify common insertion sites (CISs) associated with tumor formation. Recurrent sites of transposon insertion are commonly identified using ligation-mediated PCR (LM-PCR). Here, we use RNA sequencing (RNA-seq) data to directly identify transcriptional events mediated by T2/Onc. Surprisingly, the majority (∼80%) of LM-PCR identified junction fragments do not lead to observable changes in RNA transcripts. However, in CIS regions, direct transcriptional effects of transposon insertions are observed. We developed an automated method to systematically identify T2/Onc-genome RNA fusion sequences in RNA-seq data. RNA fusion-based CISs were identified corresponding to both DNA-based CISs (Cdkn2a, Mycl1, Nf2, Pten, Sema6d, and Rere) and additional regions strongly associated with cancer that were not observed by LM-PCR (Myc, Akt1, Pth, Csf1r, Fgfr2, Wisp1, Map3k5, and Map4k3). In addition to calculating recurrent CISs, we also present complementary methods to identify potential driver events via determination of strongly supported fusions and fusions with large transcript level changes in the absence of multitumor recurrence. These methods independently identify CIS regions and also point to cancer-associated genes like Braf. We anticipate RNA-seq analyses of tumors from forward genetic screens will become an efficient tool to identify causal events.
Insertional mutagenesis approaches have identified components of metabolic, signaling, and developmental pathways (St Johnston 2002). Slow-transforming retroviruses (Uren et al. 2005) and engineered transposon/transposase systems have been used to implicate driver genes involved in tumor formation (Collier et al. 2005). Tissue-specific expression (Starr et al. 2009) of Sleeping Beauty (SB) transposase (Ivics et al. 1997) can mobilize genomically integrated T2/Onc, inducing tumor formation in wild-type (WT) mice and accelerating tumor formation in predisposed mice. Sites of transposon insertion are identified via direct sequencing of ligation-mediated PCR (LM-PCR) products generated from restriction enzyme (reLM-PCR) digestion or shearing (shLM-PCR) of tumor DNA. Processing of the sequencing data generates lists of insertion locations, which are further analyzed to identify common insertion sites (CISs) (Sarver et al. 2012). A wide range of tumor tissues including gastrointestinal tract, liver, peripheral nerve, pancreas, and osteosarcoma (Keng et al. 2009; Starr et al. 2009; Pérez-Mancera et al. 2012; Rahrman et al. 2013; Moriarity et al. 2015) have been studied using these approaches.
The T2/Onc transposon contains a bi-functional molecular construct designed to accelerate tumor formation using two separate mechanisms. T2/Onc can activate transcription and utilize an internal splice donor to generate in-frame fusion mRNA transcripts. T2/Onc also contains two independent splice acceptors capable of disruption of transcript independent of the orientation of transposon insertion (Collier et al. 2005).
While use of reLM-PCR followed by CIS analyses has successfully identified many tumor suppressors and oncogenes important to both human and mouse tumors, this methodology suffers from a number of limitations. Properly positioned restriction sites are necessary for successful cloning. If they are not present in ideal locations, reLM-PCR will fail to identify insertions. The LM-PCR process also utilizes two PCR amplification steps, and as a result the relative clonality of an insertion within a given tumor cannot be clearly defined unless shearing-based approaches are utilized. The use of shearing prior to linker attachment partially alleviates some of these problems because the presence of multiple fragments may indicate that an insertion is clonal. Further, insertions present on the chromosome where the T2/Onc transposon concatemer resides prior to mobilization are often not considered in CIS analyses, due to the “local hopping” phenomenon of SB transposition. Additionally, it is often not clear (1) which gene is functionally affected by a set of recurrent insertions and (2) whether the transposon is activating transcription or generating premature truncations.
Given these limitations, we set out to determine whether we could use RNA-seq data obtained from SB-mutagenized tumors to identify how transposon insertion in a given tumor was affecting RNA transcripts of nearby loci. We show that RNA-seq data can be used to identify insertions directly via the presence of transposon-endogenous gene fusion transcripts and provide a pipeline for this analysis.
Results
Direct visualization of transcriptional modulation by transposon insertion
RNA-seq data was obtained from SB-induced WT (n = 5) and SB-accelerated LSL-Trp53R270H (n = 9) osteosarcoma tumors from 14 unique mice (Moriarity et al. 2015). We hypothesized that transcriptional modifications driven by T2/Onc insertion would be directly observable by examining the sequence mapping footprints in regions of the genome containing CISs. Functionally relevant insertions should modify transcript levels near genes with transposon insertions, and these modifications should not be present in tumors without insertions. To test this, the RNA-seq data sets were mapped to the mouse genome, and the genomic regions around CISs were visualized. Strong evidence for transposon-mediated transcriptional modification was present. For example, Eras is a putative oncogene activating the PI3-kinase pathway in undifferentiated stem cells (Takahashi et al. 2003). Three out of 14 mice had SB insertions detected by LM-PCR between the first and second exons in orientations expected to activate transcription of Eras. In the three tumors with insertions, large increases in transcript are visually apparent corresponding to insertion-mediated transcriptional activation. The three tumors with insertions have FPKM values above 100, while the remaining 11 have values close to zero (P < 3.97 × 10⁻⁵) (Fig. 1A). Myc (2/14) and Mycl1 (2/14) were also observed to be significantly increased in tumors with evidence for transposon insertions (Supplemental Fig. S1).
Figure 1.

Transcription near CIS insertions. Image showing FPKM values for (A) Eras and (B) Nf2 for each of the 14 SB osteosarcoma (OS) tumors. An exon map of the gene region is shown indicating the direction of transcription below the FPKM bar plots. For each tumor, a histogram of the raw number of reads observed within each 100-bp window is shown. The locations of LM-PCR-identified insertions are shown with triangles. Blue triangles represent positive orientation insertions that can activate transcription on the + strand, while green triangles represent negative orientation insertions that can activate transcription on the − strand. RNA fusions identified in the RNA-seq data are described in the figure legend (bottom right).
As an example of a loss-of-function insertion, Nf2 is a tumor suppressor gene (Morrison et al. 2001) and 4/14 tumors had LM-PCR insertions within Nf2. In each of the four tumors, decreases in the transcript levels are observable directly following the transposon insertion site consistent with the premature truncation of a single allele of the Nf2 gene. Decreased transcript levels were not observable in the remaining 10 tumors that did not contain transposon insertions (Fig. 1B).
Paired-end sequences derived from mRNA near sites of T2/Onc insertion contain fusion transcripts
Paired-end reads that mapped near the site of insertion in each of the exemplary CIS cases described above were examined using the IGV browser. In a typical RNA-seq experiment, the vast majority of paired-end sequences will map near each other in genomic location, taking into consideration the complexities of splicing. In regions near transposon insertion, sequences were present where one read pair mapped to the genome while the other read pair did not. The majority of the single mapping sequences pointed in the same direction, and this was often associated with a change in overall transcript level. We hypothesized that fusion transcripts composed of murine genome-derived mRNA fused to transposon-derived mRNA were present. To test this hypothesis, we mapped the sequence data to the mm9 genome where the T2/Onc transposon sequence (position 1–2153) was added as an extra chromosome. Approximately 50% of the previously single-end mapping sequences now mapped as fusion sequences, where one end of the pair mapped to a genomic location and the other mapped to the T2/Onc transposon (Fig. 2).
Figure 2.

Mapping to a modified mm9 genome. (A) IGV view of Eras genomic region from a tumor containing a transposon insertion. (B) Within the Eras transcript Exon 2, many unmapped read pairs were observed in the regions of fusions following mapping to the standard mm9 genome. (C) Remapping to the mm9 genome with added T2/Onc sequence reveals the presence of T2/Onc-genome fusion sequences. Many of the previously unmapped pairs now map to the T2/Onc sequence.
Fusion sequences were observed to map to five distinct regions of the T2/Onc transposon (Fig. 3A). The location of fusion pair mapping within T2/Onc indicates which genetic element of T2/Onc is being utilized. Fusions generated from the T2/Onc transcriptional activator mapped to the splice donor region following the transcriptional activator. Tumor O245 had an insertion between Exon 6 and Exon 7 of Capzb that led to transcriptional activation starting at Exon 7 (Fig. 3B). In addition to initiating known transcripts, the T2/Onc transcriptional activator was also observed to trigger previously unobserved transcripts. Tumor O165 had an insertion in an orientation predicted to activate transcription of a novel transcript on the opposite strand relative to the Capzb gene (Fig. 3C). In additional cases, splicing of the novel opposite strand transcript was observed. Tumor O112 had an insertion between Exon 1 and Exon 2 of Rere in an orientation predicted to lead to premature disruption of the transcript (Fig. 3D).
Figure 3.

Location of fusion within T2/Onc sequence indicates transposon mechanism of transcriptional alteration. (A) Map of a single copy of the T2/Onc transposon showing the locations of the various fusion products. The location of the fusion pair mapping to T2/Onc indicates how T2/Onc is modifying the transcript in order to generate the observed fusion event. (B) Transcriptional activation within the Capzb gene. (C) Transcriptional activation of the opposite strand of the Capzb gene. (D) Transcriptional activation on the opposite strand with apparent splicing in the Rere gene. (E) Premature truncation in Abca1. (F) Premature truncation and transcriptional activation happening at the same time in Abca1. Locations of LM-PCR junction fragments and fusion products are shown as described for Figure 1.
Fusions generated from prematurely truncated sequences mapped to the splice acceptor regions. An insertion was observed between Exon 2 and Exon 3 in Abca1 in the same orientation as the insertion in Rere, but instead of observing opposite strand transcriptional activation, we observed a truncation fusion product and a decrease in transcript (Fig. 3E). An insertion in the opposite orientation in Abca1 resulted in both a premature truncation and a transcriptional activation within the same gene (Fig. 3F). In addition to spliced products, fusions generated from transcriptional read-through from the inverted repeat/direct repeat (IR/DR) were observed in Eras and Rere (Figs. 1A, 3C). These were usually associated with the site of insertion identified by LM-PCR and were present at a lower rate than the spliced products, when spliced products were also present.
RNA fusions can be systematically identified
We identified all sequences where one end of the paired read mapped to one of the five T2/Onc sequence regions and the other mapped to the genome. Across the 14 tumors, 1806 fusions were observed (Supplemental Table S1). Many of the fusions are in close proximity to each other and describe alternatively spliced products. Each tumor had 28 to 324 distinct fusions (Table 1).
Table 1.
Summary of tumor RNA-seq, LM-PCR, and fusion data
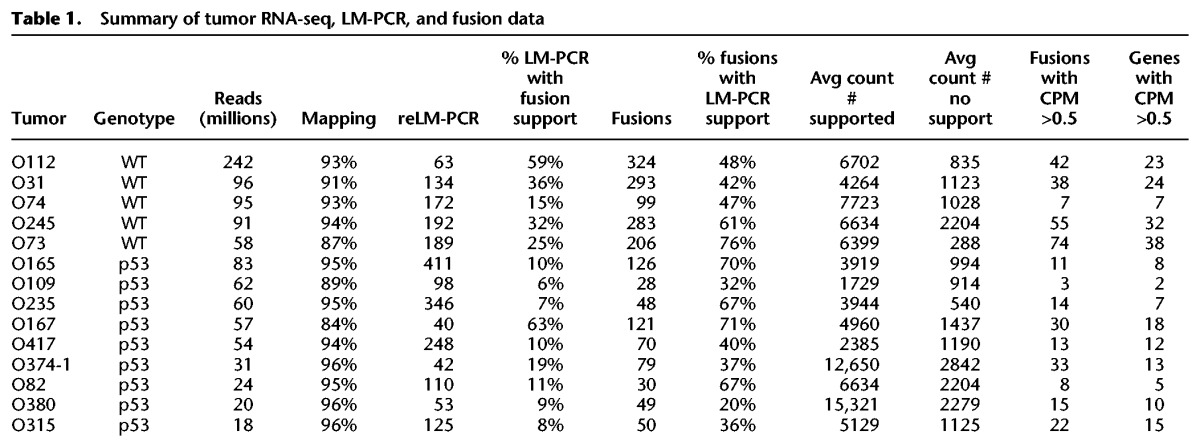
Libraries were sequenced to varying depths from 18 to 241 million paired-end reads to identify the optimal read depth. The depth of sequencing showed a relationship with the total number of fusion regions observed (r2 = 0.56). The slope of the trend line (1.4) indicates that, for each million additional reads in depth, on average an additional 1.4 fusions will be identified. The y-intercept of the trend line (31) indicates that, even at lower sequence depth, a significant number of fusions will be identified (Fig. 4A). To normalize the number of fusion events across such a wide depth of sequencing, we calculated counts per million (CPM) values for each fusion. A CPM of 0.5 would mean that in the smallest library at least 10 fusion-spanning paired-end reads were present.
Figure 4.

Interplay between sequencing depth, LM-PCR depth, and RNA fusions. (A) Total number of fusions observed in each sample plotted against the sequencing depth. (B) The number of fragments in six tumors using the shLM-PCR technique, ordered in increasing number of fragments which is a semiquantitative indication of clonality and the number of fusions which support these shLM-PCR junction fragments. (C) Relationship between shLM-PCR number of supporting fragments and RNA fusion support. As more supporting shear fragments are observed, the percentage of insertions with observed fusions increases.
In the SB tumors, apparent fusions were observed in the Foxf2 gene, as well as the En2 gene, both of which were used in the construction of the T2/Onc transposon. In addition, we mapped RNA-seq data from tumors derived from a traditional genetic mouse tumor model (without SB mutagenesis) and did not observe fusions.
Many reLM-PCR insertions are not supported by RNA fusions, and insertions with fusion support have increased read counts
Across these 14 tumors, 2223 insertion sites were identified by reLM-PCR followed by TAPDANCE analysis (Supplemental Table S3). Three hundred seventy-six of the 2223 insertion sites (∼17%) have an RNA fusion event within ±100,000 bp of the LM-PCR site (Table 1). While reLM-PCR amplification is not linear, we suspected reLM-PCR insertions with increased read numbers are generally more likely to be clonal driver events, therefore generating observable fusions. If this was the case, reLM-PCR reads with RNA fusion support should have increased read numbers relative to reLM-PCR reads without RNA fusion support. reLM-PCR insertions supported by RNA–transposon fusions were observed, on average, 5142 times across all 14 libraries, while unsupported insertions were observed an average of 1026 times (Table 1). The increase in read number for fusion-supported insertions holds true independently for each tumor library and is highly statistically significant (P = 0.00004, two-group t-test).
Clonal insertions identified by shLM-PCR have increased fusion support
Shearing has been used as an alternative to restriction enzymes to fragment DNA prior to LM-PCR and has been reported as a semiquantitative method to identify clonal insertions based on the presence of multiple supporting fragments (Koudijs et al. 2011; Riordan et al. 2014). If the observed fusions were generated primarily from clonal insertions, shLM-PCR insertion locations with more supporting fragments would have increased fusion support. We generated shLM-PCR data from six tumors for which we also had RNA-seq data and examined the support (Supplemental Table S4). As the number of distinct supporting fragments increases, the likelihood of fusion support also increases (Fig. 4C). These results indicate that shLM-PCR junctions with many shear fragments are more likely to be clonal and generate fusion transcripts than shLM-PCR junctions with fewer shear fragments.
RNA fusions are observed that are not supported by LM-PCR
Of the 1806 potential fusions identified across 14 tumors, 974 (53%) are within 100,000 bases of a reLM-PCR-identified insertion. Eight hundred thirty-two fusions without LM-PCR support map to 514 unique genes, including a fusion to Myc. Of the 574 fusions identified across six tumors, where shLM-PCR was available, 407 (71%) were supported by shLM-PCR. One hundred sixty-seven fusions without shLM-PCR map to 120 genes and include fusions to Rb1, Wrn, Notch2, and Csf1r. These results indicate that a significant number of transposon insertions are being missed by LM-PCR based methodology but can be inferred by the presence of RNA fusions. RT-PCR was used to validate that transposon-derived fusion sequences were present in the tumors in six examples where reLM-PCR did not identify transposon insertions (Supplemental Figs. S2–S9).
RNA fusions can define precise RNA CIS (RCIS) genes
RCISs were calculated from the RNA fusion locations and compared to DNA CISs (DCISs) generated with reLM-PCR junction fragments. Thirty-five DCIS regions (Supplemental Table S5) and 31 RCIS regions (Supplemental Table S6) were identified. Many regions were present in both lists, including Eras, Nf2, Pten, Mycl1, Cdkn2a, Sema6d, Rere, Ammecr1, Heatr3, Abca1, Lims2, and Cd2ap (Supplemental Table S7). Additional genomic regions strongly associated with cancer were only found in the RCIS list, including Myc, Akt1, Pth, Csf1r, Fgfr2, Wisp1, Map3k5, and Map4k3. Significantly more RCISs were observed in SB-induced WT tumors than in SB-accelerated LSL-Trp53R270H tumors (P = 0.0008).
In many cases, CISs have multiple genes in close proximity, and RNA-seq data can discern which transcripts are directly modified. We identified insertions between Ameccr1 and Rgag1 and the insertions are closer to the Ammecr1 gene, while Rgag1 transcript level is strongly increased (Fig. 5A). RNA-seq data can also allow identification of the specific transcriptional modification occurring in each tumor. The Cdkn2a (p16) locus has reLM-PCR insertions in four tumors, two within the gene predicted to disrupt the transcript and one in an orientation suggesting transcriptional activation (Fig. 5B). The tumor with the highest level of Cdkn2a (O73) has a reLM-PCR insertion and fusion indicating transcriptional activation of Cdkn2a. The tumor with the lowest level of Cdkn2a transcript (O74) has an insertion activating transcription of a noncanonical transcript on the opposite strand. In summary, RNA-seq data complement reLM-PCR and allow direct identification of the transposon-mediated transcriptional changes within CISs that were not clear from the reLM-PCR data alone.
Figure 5.

Precise identification of CIS transposon targeting. Histograms, similar to Figure 1, allow precise identification of the molecular mechanism of insertion in CIS near (A) Ammecr1 and Rgag1, and (B) Cdkn2a. Locations of LM-PCR junction fragments and fusion products are shown as described for Figure 1.
Tumor-centric models of recurrent and nonrecurrent driver events
Identifying driver events that are present in specific tumors is necessary to understand heterogeneous tumor formation, and nonrecurrent fusions may be important drivers of tumor formation (Table 2). Two distinct approaches were utilized with the RNA-seq data to identify nonrecurrent drivers. First, fusions with strong support defined by fusion CPM > 0.5 were identified. Many of these were previously identified via CIS analyses in our larger reLM-PCR (Moriarity et al. 2015). This analysis also identified nonrecurrent oncogenes, such as Ksr1 (Müller et al. 2001), Ptpn13 (Dromard et al. 2007), Wisp1 (Xu et al. 2001), and Ptk2 (also known as FAK) (Mitra and Schlaepfer 2006).
Table 2.
Tumor-centric view of potential driver events
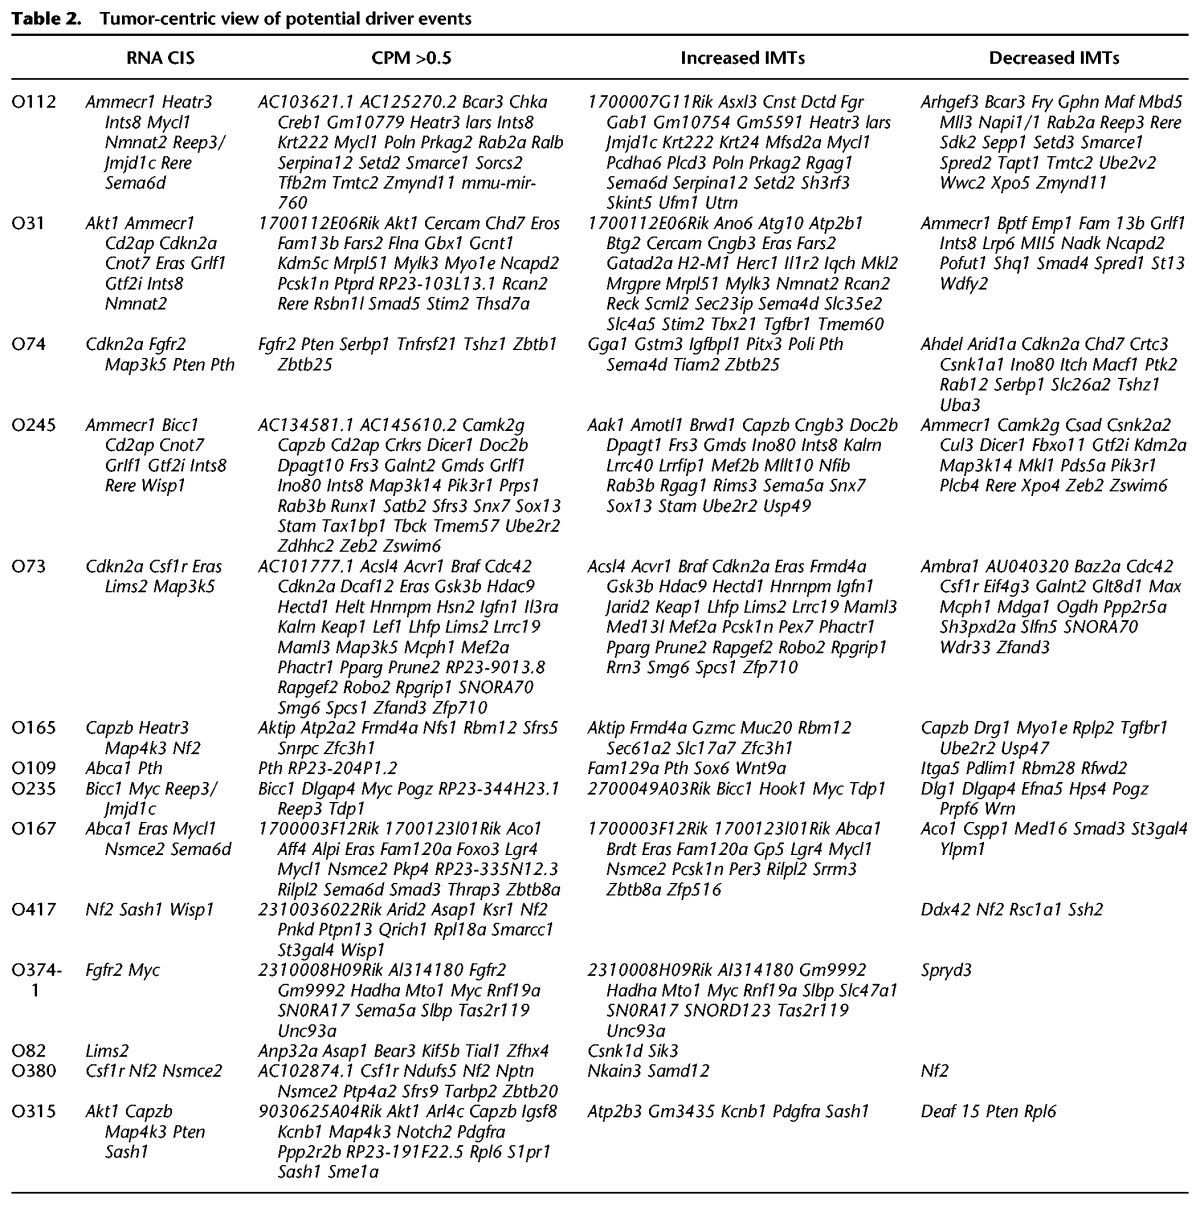
As a second approach, insertion-modified transcripts (IMTs), with outlier expression levels and RNA fusions, were identified. IMTs with increased expression included many genes identified as CISs, such as Eras, Myc, and Mycl1 (Table 2). For example, increases in 3′ exons were observed in Cngb3, Poln, and Braf, which were not previously seen as a DCIS or RCIS (Fig. 6A–C). IMTs with decreased levels included many genes described as CISs, such as Nf2, Pten, Cdkn2a, and Rere. In addition to truncation, transposon insertion also leads to opposite strand transcription as shown for Cdc42, Xpo4, and Max (Fig. 6D–F).
Figure 6.

Insertion-modified transcripts (IMTs) in osteosarcoma tumors. Examples of increased IMTs via transcriptional activation for (A) Cngb3, (B) Poln, and (C) Braf, and for decreased IMTs with apparent activation of opposite strand transcript (D) Cdc42, (E) Xpo4, and (F) Max. FPKM, locations of reLM-PCR junction fragments and fusion products are shown as described for Figure 1.
Discussion
Analyses of RNA-seq data identified changes in transcripts and RNA fusions consistent with LM-PCR-identified insertion sites. However, only 20% of the LM-PCR insertions had supporting fusions. Many fusions were observed in the absence of LM-PCR-defined insertion sites, which were validated by RT-PCR and direct Sanger sequencing. In addition to previously described DCIS, recurrent and nonrecurrent osteosarcoma-specific oncogenes and tumor suppressors were identified by RCIS, high CPM fusions, and IMTs from the RNA-seq data.
Functionally relevant insertion events may be more observable in RNA-seq-based analyses of transposon fusions than in reLM-PCR analyses of junction fragments because fusion events must make up a significant part of the transcript population. In reLM-PCR, no estimate is made of the “normal” population at a given insertion locus, while in RNA-seq this is implicit in the methodology. As a result, reLM-PCR techniques may identify false positive insertion sites that are not clonal. Shearing prior to LM-PCR can act as a semiquantitative assessment of clonality, but the removal of insertions that may appear to be nonclonal via shearing may come at the cost of generating false negatives where fusion support exists.
Statistical analyses of association between transposon insertion and overall transcript level clearly showed transcriptional activation was occurring as a result of transposon insertion near Myc, Mycl1, and Eras. However, tumors with T2/Onc fusions in Nf2 showed a trend toward decreased transcript levels (P < 0.06). Rationale for the lack of significance include (1) that Nf2 transcript levels vary for each sample, (2) that the presence of prematurely truncated polyadenylated product may increase the overall FPKM levels to a level near those observed in nontruncated products, and (3) that sequences leading to mRNA degradation may be removed in prematurely truncated transcripts masking decreases. RNA-seq fusion-based methods are better at identifying transcriptional activation events compared to LM-PCR, because the dynamic range of transcriptional activation signal is much greater than heterozygous premature transcript termination. LM-PCR will not show signal bias based on transcriptional activation since it is a DNA-based method.
Decreases in transcript observed near insertions activating opposite strand sequences may be driving RNA silencing interactions via the degradation of complementary mRNA as is commonly utilized to knock down genes in cells utilizing small interfering RNA. While unexpected, this functionality is not surprising due to the harnessing of evolutionary tumor selection in forward genetic screens.
Pth, Ptprd, and Tgfbr1 were identified only after RNA-seq-based analysis approaches described here, and each gene has clear roles in osteosarcoma biology. Parathyroid Hormone (Pth) has been proposed as a treatment for osteoporosis and has a shown clear effect in increasing bone density in humans (Neer et al. 2001). Rats showed dose-dependent increases in osteosarcoma tumors following daily treatment with Pth (Vahle et al. 2002), independently validating that Pth has a role in osteosarcoma development. PTPRD is a protein tyrosine phosphatase, and a frameshift mutation was described in a human osteosarcoma patient (Egas-Bejar et al. 2014). Finally, a TGFBR1 variant was associated with osteosarcoma susceptibility in a Chinese population (Hu et al. 2010).
Many papers have identified differentially expressed transcripts in tumors. What makes RNA-seq applied to SB-mutagenized tumors unique is that transcriptional changes in tumors in response to transposon insertion can be directly observed. Spontaneous tumor formation utilizes a multitude of overlapping mechanisms including mutation, copy number variation, epigenetic variation, and genetic background for which complete information is difficult to obtain and often highly noisy. As a result, it is often difficult to identify causal events. Using RNA-seq to study SB-mutagenized tumor model systems provides identification of causal events with reduced noise. Our data indicate that transposon insertion will have effects that are less predictable and more complex than previously imagined due to an interplay between the strength of the native promoter compared to the strength of the T2/Onc promoter, the presence of cryptic transcription and splicing elements, the availability and strength of native splice donors and acceptors, and the bifunctional capabilities of T2/Onc. Thus, direct visualization with RNA-seq is essential to understand the mechanistic effects of transposon insertion. Our analysis method will be of value beyond cancer applications as this methodology can be applied to any forward genetic screen that utilizes transcript-modifying transposon mutagenesis.
Methods
SB-mutagenized osteosarcomas
The generation and analysis of these tumors has been previously described (Moriarity et al. 2015). Briefly, mice undergoing transposon mutagenesis targeted to osteoblasts and their precursors, via Osterix1-Cre transgene, were generated on a WT or conditional LSL-Trp53R270H background (Olive et al. 2004) and aged for osteosarcoma development. Upon necropsy, tumors were snap-frozen in RNAlater (Sigma). reLM-PCR (Rahrmann et al. 2013) and shLM-PCR (Riordan et al. 2014) were performed as previously described. RNA was extracted using a RNA Midi extraction kit (Qiagen) and quality-tested using the Bioanalyzer 2100 (Agilent Technologies). The TruSeq RNA Sample Preparation kit (Illumina) was used to generate genomic sequences of ∼200 bp, which were sequenced using the HiSeq 2000 (Illumina).
RNA-seq mapping
TopHat (Trapnell et al. 2009) was used to map paired-end sequences to the mm9 genome modified to include 2153 bases of the T2/Onc transposon sequence (Collier et al. 2005) as Chromosome chrSB. The BEDTools (Quinlan et al. 2010) function maskfasta was used to remove the En2 gene, a portion of which was used to generate the T2/Onc transposon. The total numbers of mapped and unmapped sequences were obtained using the SAMtools (Li et al. 2009) function faidx. Fragments per kilobase of exon per million fragments mapped (FPKM) values for each gene were generated using Cuffdiff (Trapnell et al. 2010). IGV (Thorvaldsdóttir et al. 2013) and R (R Core Team 2012) were used to visualize mapped sequence data.
Identification of transposon fusions from RNA-seq data
Mapped, sorted, indexed BAM files were used to identify paired-end sequences where one end mapped to an endogenous genomic location and the other end mapped to the T2/Onc sequence using the SAMtools view command. A Perl script was used to summarize T2/Onc fusions based on (1) the total number of reads that support the fusion, (2) the number of unique fusions, and (3) the total number of reads mapping to that location (Fusion_Finder.pl). The CPM for each fusion was calculated by dividing the number of reads that support the fusion by the total number of reads sequenced and multiplying the number by 1,000,000.
Annotation, CIS, and IMTs
The nearest gene was identified using the BEDTools function closest with mm9 annotation. The TAPDANCE CIS calling algorithm (Sarver et al. 2012) was utilized to identify and annotate (1) DCISs from the list of all LM-PCR insertions with no chromosome exclusion, and (2) RCISs from the list of all RNA fusions. For each tumor, increased IMTs were defined as genes that had FPKM levels more than 1.5 times the interquartile range above the third quartile and had a fusion. Tumors with decreased IMTs were defined as genes that had FPKM levels below the first quartile where the first quartile had a value greater than 1 and had a fusion.
Fusion-spanning RT-PCR
RNA was extracted from tumors using the RNA Mini kit (Invitrogen) and reverse-transcribed into cDNA using the SuperScript III reverse-transcriptase kit (Life Technologies), following the manufacturer's instructions. PCR was performed using 2× GoTaq (Promega) with an initial denaturation step at 95°C for 2 min, 35 cycles of denaturing at 95°C for 25 sec, annealing at 55°C for 35 sec, extension at 72°C for 1.5 min, and a final extension step at 72°C for 5 min. PCR amplicons were resolved on 1% agarose gels. PCR products were subcloned into PCR-Blunt II-TOPO (Life Technologies) following the manufacturer's instructions and subsequently sequenced using standard Sanger sequencing. Primer sequences can be found in Supplemental Table S9.
Data access
The sequencing data from this study have been submitted to the NCBI Sequence Read Archive (SRA; http://www.ncbi.nlm.nih.gov/sra/) under accession number SRP047432. The Fusion Finder script is included in the Supplemental Material and can also be obtained from http://www.oncomir.umn.edu/fusion_finder.
Supplementary Material
Acknowledgments
This research was supported by the Sobiech Osteosarcoma Fund Award, Children’s Cancer Research Fund, American Cancer Center Research Professor Grant #123939 (to D.A.L.), National Cancer Institute, R01 CA113636 (to D.A.L.), and the comprehensive Masonic Cancer Center US National Institutes of Health grant P30 CA077598. We extend our thanks to the University of Minnesota resources involved in our project. The University of Minnesota Genomics Center provided services for RNA sequencing and the Minnesota Supercomputing Institute provided access to computational resources.
Footnotes
[Supplemental material is available for this article.]
Article published online before print. Article, supplemental material, and publication date are at http://www.genome.org/cgi/doi/10.1101/gr.188649.114.
References
- Collier LS, Carlson CM, Ravimohan S, Dupuy AJ, Largaespada DA. 2005. Cancer gene discovery in solid tumours using transposon-based somatic mutagenesis in the mouse. Nature 436: 272–276. [DOI] [PubMed] [Google Scholar]
- Dromard M, Bompard G, Glondu-Lassis M, Puech C, Chalbos D, Freiss G. 2007. The putative tumor suppressor gene PTPN13/PTPL1 induces apoptosis through insulin receptor substrate-1 dephosphorylation. Cancer Res 67: 6806–6813. [DOI] [PubMed] [Google Scholar]
- Egas-Bejar D, Anderson PM, Agarwal R, Corrales-Medina F, Devarajan E, Huh WW, Brown RE, Subbiah V. 2014. Theranostic profiling for actionable aberrations in advanced high risk osteosarcoma with aggressive biology reveals high molecular diversity: the human fingerprint hypothesis. Oncoscience 1: 167–179. [DOI] [PMC free article] [PubMed] [Google Scholar]
- Hu YS, Pan Y, Li WH, Zhang Y, Li J, Ma BA. 2010. Association between TGFBR1*6A and osteosarcoma: a Chinese case-control study. BMC Cancer 10: 169. [DOI] [PMC free article] [PubMed] [Google Scholar]
- Ivics Z, Hackett PB, Plasterk RH, Izsvák Z. 1997. Molecular reconstruction of Sleeping Beauty, a Tc1-like transposon from fish, and its transposition in human cells. Cell 91: 501–510. [DOI] [PubMed] [Google Scholar]
- Keng VW, Villanueva A, Chiang DY, Dupuy AJ, Ryan BJ, Matise I, Silverstein KA, Sarver A, Starr TK, Akagi K, et al. 2009. A conditional transposon-based insertional mutagenesis screen for genes associated with mouse hepatocellular carcinoma. Nat Biotechnol 27: 264–274. [DOI] [PMC free article] [PubMed] [Google Scholar]
- Koudijs MJ, Klijn C, van der Weyden L, Kool J, ten Hoeve J, Sie D, Prasetyanti PR, Schut E, Kas S, Whipp T, et al. 2011. High-throughput semiquantitative analysis of insertional mutations in heterogeneous tumors. Genome Res 21: 2181–2189. [DOI] [PMC free article] [PubMed] [Google Scholar]
- Li H, Handsaker B, Wysoker A, Fennell T, Ruan J, Homer N, Marth G, Abecasis G, Durbin R. 2009. The sequence alignment/map format and SAMtools. Bioinformatics 25: 2078–2079. [DOI] [PMC free article] [PubMed] [Google Scholar]
- Mitra SK, Schlaepfer DD. 2006. Integrin-regulated FAK–Src signaling in normal and cancer cells. Curr Opin Cell Biol 18: 516–523. [DOI] [PubMed] [Google Scholar]
- Moriarity BS, Otto GM, Rahrmann EP, Rathe SK, Wolf NK, Weg MT, Manlove LA, LaRue RS, Temiz NA, Molyneux SD, et al. 2015. A Sleeping Beauty forward genetic screen identifies new genes and pathways driving osteosarcoma development and metastasis. Nat Genet 47: 615–624. [DOI] [PMC free article] [PubMed] [Google Scholar]
- Morrison H, Sherman LS, Legg J, Banine F, Isacke C, Haipek CA, Gutmann DH, Ponta H, Herrlich P. 2001. The NF2 tumor suppressor gene product, merlin, mediates contact inhibition of growth through interactions with CD44. Genes Dev 15: 968–980. [DOI] [PMC free article] [PubMed] [Google Scholar]
- Müller J, Ory S, Copeland T, Piwnica-Worms H, Morrison DK. 2001. C-TAK1 regulates Ras signaling by phosphorylating the MAPK scaffold, KSR1. Mol Cell 8: 983–993. [DOI] [PubMed] [Google Scholar]
- Neer RM, Arnaud CD, Zanchetta JR, Prince R, Gaich GA, Reginster JY, Hodsman AB, Eriksen EF, Ish-Shalom S, Genant HK, et al. 2001. Effect of parathyroid hormone (1-34) on fractures and bone mineral density in postmenopausal women with osteoporosis. N Engl J Med 344: 1434–1441. [DOI] [PubMed] [Google Scholar]
- Olive KP, Tuveson DA, Ruhe ZC, Yin B, Willis NA, Bronson RT, Crowley D, Jacks T. 2004. Mutant p53 gain of function in two mouse models of Li-Fraumeni syndrome. Cell 119: 847–860. [DOI] [PubMed] [Google Scholar]
- Pérez-Mancera PA, Rust AG, van der Weyden L, Kristiansen G, Li A, Sarver AL, Silverstein KA, Grützmann R, Aust D, Rümmele P, et al. 2012. The deubiquitinase USP9X suppresses pancreatic ductal adenocarcinoma. Nature 486: 266–270. [DOI] [PMC free article] [PubMed] [Google Scholar]
- Quinlan AR, Hall IM. 2010. BEDTools: a flexible suite of utilities for comparing genomic features. Bioinformatics 26: 841–842. [DOI] [PMC free article] [PubMed] [Google Scholar]
- R Core Team. 2012. R: a language and environment for statistical computing. R Foundation for Statistical Computing, Vienna, Austria: http://www.R-project.org/. [Google Scholar]
- Rahrmann EP, Watson AL, Keng VW, Choi K, Moriarity BS, Beckmann DA, Wolf NK, Sarver A, Collins MH, Moertel CL, et al. 2013. Forward genetic screen for malignant peripheral nerve sheath tumor formation identifies new genes and pathways driving tumorigenesis. Nat Genet 45: 756–766. [DOI] [PMC free article] [PubMed] [Google Scholar]
- Riordan JD, Drury LJ, Smith RP, Brett BT, Rogers LM, Scheetz TE, Dupuy AJ. 2014. Sequencing methods and datasets to improve functional interpretation of sleeping beauty mutagenesis screens. BMC Genomics 15: 1150. [DOI] [PMC free article] [PubMed] [Google Scholar]
- Sarver AL, Erdman J, Starr T, Largaespada DA, Silverstein KAT. 2012. TAPDANCE: an automated tool to identify and annotate transposon insertion CISs and associations between CISs from next generation sequence data. BMC Bioinformatics 13: 154. [DOI] [PMC free article] [PubMed] [Google Scholar]
- St Johnston D. 2002. The art and design of genetic screens: Drosophila melanogaster. Nat Rev Genet 3: 176–188. [DOI] [PubMed] [Google Scholar]
- Starr TK, Allaei R, Silverstein KA, Staggs RA, Sarver AL, Bergemann TL, Gupta M, O'Sullivan MG, Matise I, Dupuy AJ, et al. 2009. A transposon-based genetic screen in mice identifies genes altered in colorectal cancer. Science 323: 1747–1750. [DOI] [PMC free article] [PubMed] [Google Scholar]
- Takahashi K, Mitsui K, Yamanaka S. 2003. Role of ERas in promoting tumour-like properties in mouse embryonic stem cells. Nature 423: 541–545. [DOI] [PubMed] [Google Scholar]
- Thorvaldsdóttir H, Robinson JT, Mesirov JP. 2013. Integrative Genomics Viewer (IGV): high-performance genomics data visualization and exploration. Brief Bioinform 14: 178–192. [DOI] [PMC free article] [PubMed] [Google Scholar]
- Trapnell C, Pachter L, Salzberg SL. 2009. TopHat: discovering splice junctions with RNA-Seq. Bioinformatics 25: 1105–1111. [DOI] [PMC free article] [PubMed] [Google Scholar]
- Trapnell C, Williams BA, Pertea G, Mortazavi A, Kwan G, van Baren MJ, Salzberg SL, Wold BJ, Pachter L. 2010. Transcript assembly and quantification by RNA-Seq reveals unannotated transcripts and isoform switching during cell differentiation. Nat Biotechnol 28: 511–515. [DOI] [PMC free article] [PubMed] [Google Scholar]
- Uren AG, Kool J, Berns A, Van Lohuizen M. 2005. Retroviral insertional mutagenesis: past, present and future. Oncogene 24: 7656–7672. [DOI] [PubMed] [Google Scholar]
- Vahle JL, Sato M, Long GG, Young JK, Francis PC, Engelhardt JA, Westmore MS, Linda Y, Nold JB. 2002. Skeletal changes in rats given daily subcutaneous injections of recombinant human parathyroid hormone (1-34) for 2 years and relevance to human safety. Toxicol Pathol 30: 312–321. [DOI] [PubMed] [Google Scholar]
- Xu L, Corcoran RB, Welsh JW, Pennica D, Levine AJ. 2001. WISP-1 is a Wnt-1- and β-catenin-responsive oncogene. Genes Dev 14: 585–595. [PMC free article] [PubMed] [Google Scholar]
Associated Data
This section collects any data citations, data availability statements, or supplementary materials included in this article.