

Abstract
How EF-G and RRF act together to split a post-termination ribosomal complex into its subunits has remained obscure. Here, using stopped-flow experiments with Rayleigh light scattering detection and quench-flow experiments with radio-detection of GTP hydrolysis, we have clarified the kinetic mechanism of ribosome recycling and obtained precise estimates of its kinetic parameters. Ribosome splitting requires that EF-G binds to an already RRF-containing ribosome. EF-G binding to RRF-free ribosomes induces futile rounds of GTP hydrolysis and inhibits ribosome splitting, implying that while RRF is purely an activator of recycling, EF-G acts as both activator and competitive inhibitor of RRF in recycling of the post-termination ribosome. The ribosome splitting rate and the number of GTPs consumed per splitting event depend strongly on the free concentrations of EF-G and RRF. The maximal recycling rate, here estimated as 25 sec−1, is approached at very high concentrations of EF-G and RRF with RRF in high excess over EF-G. The present in vitro results, suggesting an in vivo ribosome recycling rate of ∼5 sec−1, are discussed in the perspective of rapidly growing bacterial cells.
Keywords: bacterial ribosome recycling, elongation factor G, ribosome recycling factor, translation rate optimization, protein synthesis
INTRODUCTION
After ribosomal synthesis of a complete protein, the peptide chain is released from the P-site tRNA by a stop codon-recognizing class I release factor, RF1 or RF2 (Scolnick et al. 1968). Subsequently a GTPase, the class II release factor RF3, induces dissociation of the class I release factor, bringing the ribosome to the post-termination state containing an mRNA and a deacylated P-site tRNA (Freistroffer et al. 1997). To allow for a new round of initiation, the post-termination ribosome is split into its large and small subunits (50S and 30S, respectively) in a GTP hydrolysis-dependent manner (Karimi et al. 1999; Hirokawa et al. 2005; Peske et al. 2005; Zavialov et al. 2005) by another GTPase, elongation factor G (EF-G), and ribosome recycling factor (RRF) (Hirashima and Kaji 1973; Janosi et al. 1996). After the split, binding of initiation factor 3 (IF3) to the 30S subunit prevents premature re-formation of a 70S ribosome (Hirokawa et al. 2005; Peske et al. 2005). Whether the deacylated tRNA and the mRNA dissociate from the 70S ribosome or from the 30S subunit after splitting and what role IF3 plays in the recycling process have been controversial. According to one model (Hirokawa et al. 2005), the P-site tRNA is ejected from the 70S post-termination complex in response to an EF-G-induced, translocation-like movement of RRF through the ribosome (Selmer et al. 1999; Hirokawa et al. 2002). Then mRNA is released upon RRF- and EF-G-induced transient separation of the ribosomal subunits (Hirokawa et al. 2005, 2006). According to this model, the only role of IF3 is to bind to the free 30S subunit to prevent premature 70S reformation. In the other model the 50S subunit is first removed from the post-termination complex by RRF and EF-G. Then IF3-stimulated release of the deacylated tRNA from the 30S subunit enables the mRNA to dissociate from or slide along the 30S subunit (Karimi et al. 1999). The latter model is based on experiments showing that: (i) RRF together with EF-G can induce splitting of the post-termination complex; (ii) IF3 is required for recycling of the 30S subunit for formation of a new 70S initiation complex; (iii) IF3 can induce dissociation of tRNA from the mRNA-bound 30S subunit (Karimi et al. 1999). In line with these results, it was demonstrated that RRF and EF-G can induce exchange of mRNA-bound 30S subunits between 70S post-termination complexes also in the absence of IF3 (Zavialov et al. 2005). Furthermore, EF-G- and RRF-induced subunit dissociation in the absence of IF3 was observed in real time by stopped-flow techniques with Rayleigh light scattering detection (Pavlov et al. 2008). Major aspects of the second model (Karimi et al. 1999; Zavialov et al. 2005; Pavlov et al. 2008) have also been confirmed by experiments performed with fluorescence-based stopped-flow techniques (Peske et al. 2005). There is, in other words, a large and convincing data set in favor of the second (Karimi et al. 1999) in relation to the first (Hirokawa et al. 2005) model.
It was demonstrated by cryo-electron microscopy (cryo-EM) (Gao et al. 2005) and single molecule Förster resonance energy transfer (FRET) (Sternberg et al. 2009) that RRF binding to the post-termination 70S complex with a deacylated tRNA in the P site drives the ribosome into its ratcheted conformation. Notably, the interaction between RRF and a non-ratcheted post-translocation ribosome with peptidyl-tRNA in the P site is weak (Valle et al. 2003). The presence of mRNA and deacylated tRNA on the post-termination ribosome increases its rate of splitting into subunits by RRF and EF-G (Pavlov et al. 2008), but little is known about the interactions between the protein factors and the 70S ribosome that lead to rapid subunit separation. Only one structure of a post-termination ribosome in complex with both EF-G and RRF has so far been reported (Yokoyama et al. 2012). Cryo-EM was used to visualize a 70S ribosome from Escherichia coli in complex with EF-G from E. coli and RRF from Thermus thermophilus. This heterologous factor combination is inactive in ribosome recycling (Ito et al. 2002), making functional interpretation of this two-factor cryo-EM complex difficult. It has been shown with cryo-EM that when RRF is in complex with an EF-G-lacking 70S post-termination complex (Gao et al. 2005) RRF domain II is differently oriented in relation to RRF domain I than when the factor is in complex with the ribosomal 50S subunit and EF-G(GDPNP). RRF interacts with rRNA helices H69 and H71 of the 50S subunit that are part of prominent inter-subunit bridges (Gao et al. 2005; Dunkle et al. 2011). This suggests that binding of RRF and EF-G to the post-termination ribosome confers subunit separation by EF-G-induced rotation of domain II of RRF, leading to conformational changes in regions of the 50S subunit that are involved in inter-subunit bridging.
It is often assumed that RRF binds to the post-termination ribosome before EF-G (see, for example, Zavialov et al. 2005; Savelsbergh et al. 2009; Sternberg et al. 2009), but there is little experimental evidence for this assertion. Ribosomes with a deacylated tRNA in the P site induce a strong, idling GTPase reaction of EF-G (Zavialov and Ehrenberg 2003), but it is only in the presence of RRF that the ribosome-dependent GTPase activity of EF-G is coupled to ribosome splitting. In this work, we have used Rayleigh light scattering to directly monitor subunit dissociation during ribosome recycling (Antoun et al. 2004; Pavlov et al. 2008) over a wide range of EF-G and RRF concentrations. The light scattering experiments were complemented with measurements of GTP hydrolysis by EF-G under the same conditions. The experiments were performed in a polymix buffer-based in vitro translation system with high purity components from E. coli (Jelenc and Kurland 1979). We show that this system, previously shown to display fast and accurate protein elongation (Johansson et al. 2008, 2012; Borg and Ehrenberg 2015) and fast termination (Indrisiunaite et al. 2015), also displays rapid recycling. Using mean-time analysis of the light scattering and GTP hydrolysis data, we have obtained the complete kinetic mechanism for ribosome recycling along with high precision estimates of its rate constants at 37°C. We have characterized how the rate of recycling as well as the number of GTP molecules consumed per ribosome splitting event strongly depend on the concentrations of RRF and EF-G, and discuss optimal scenarios for ribosome recycling in the living bacterial cell.
RESULTS
Ribosome recycling time as function of EF-G and RRF concentrations
To clarify the complete kinetic mechanism of bacterial ribosome recycling, we used stopped-flow techniques and Rayleigh light scattering to monitor splitting of the 70S post-termination complex into ribosomal 50S and 30S subunits in a wide range of RRF and EF-G concentrations. The Rayleigh light scattering intensity decreases in response to ribosome splitting but does not respond to conformational changes of the 70S ribosome or its subunits, allowing for unambiguous and precise estimation of the average time from mixing of the 70S post-termination ribosome with RRF and EF-G to subunit separation (Materials and Methods; Antoun et al. 2004; Pavlov et al. 2008). Post-termination ribosomal complexes (0.25 µM), containing mRNA and a deacylated tRNAPhe in the P site, were rapidly mixed with EF-G (0.26–20.4 µM, active concentration, determined as described previously [Borg et al. 2015]), RRF (1–40 µM) and IF3 (1 µM) in a stopped-flow instrument. At each combination of RRF and EF-G concentrations multiple time traces were recorded and averaged. Then, a single exponential function was fitted to the averaged trace to estimate the recycling time (τrec) (Fig. 1A,B). All τrec-values are collected in Table 1. At constant EF-G concentration we observed a monotonically decreasing recycling time at increasing RRF concentration (Fig. 1C). In contrast, at constant RRF concentration, the recycling time first decreased and then increased with increasing EF-G concentration (Fig. 1D). The existence of a minimal recycling time was most distinct at the lowest RRF concentration. From these results we concluded that the recycling mechanism must be ordered, so that RRF has to bind before EF-G to achieve splitting of the post-termination complex. EF-G inhibition of the recycling reaction emerges by the competition between EF-G and RRF as first binder to the factor-free post-termination ribosome. With these conclusions as a lead, we formulated a tentative model of the complete ribosome recycling mechanism (Fig. 2) for careful testing and parameter estimation. According to this model, the recycling time, τrec, is given by (for derivation see Equations 5–10 in Materials and Methods).
| (1) |
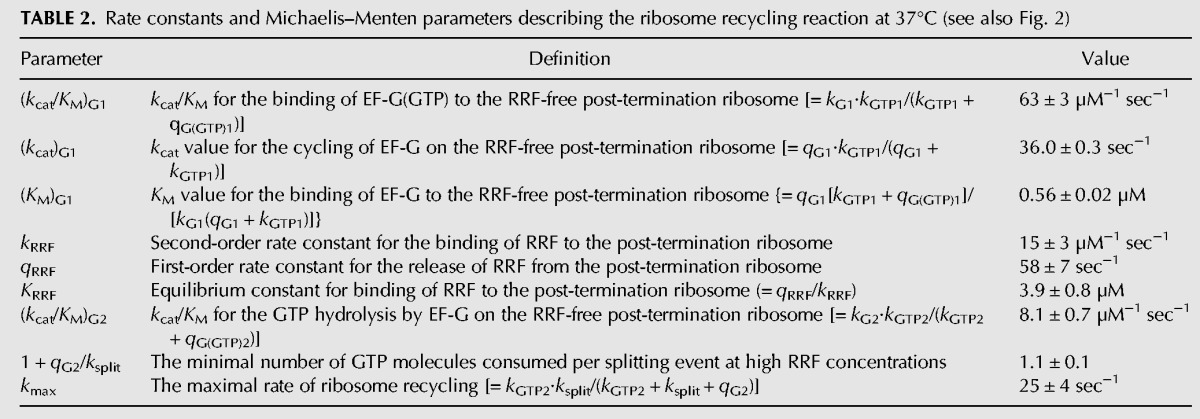
The Michaelis–Menten constants used in Equation 1 are related to the elemental rate constants, defined in Figure 2, as described in Table 2. The vertical branch of the scheme in Figure 2 describes the binding of EF-G in the GTP form to the factor-free post-termination ribosome, followed by GTP hydrolysis on EF-G and release of EF-G in the GDP form. In this idling reaction, with KM value (KM)G1, EF-G acts as a competitive inhibitor with inhibition constant (KM)G1 of the RRF and EF-G catalyzed splitting reaction. It is seen from the first term on the right side of Equation 1 how an increasing EF-G concentration increases the time {1/[kRRF(RRF)]} of RRF binding to the post-termination complex. In the middle term of Equation 1, the first factor accounts for the efficiency, (kcat/KM)G2, by which EF-G binds to the RRF-containing post-termination ribosome and forms a splitting-competent ribosome complex containing EF-G(GDP) and RRF. The second factor, 1 + qG2/ksplit, describes the average number of times a splitting competent ribosome complex must be formed to achieve a productive splitting event. The third factor in this term accounts for the partitioning of post-termination complex between factor-free, EF-G-bound, and RRF-bound ribosomal complexes. The last two terms in Equation 1 together constitute the minimal time, τmin, for the ribosome splitting reaction which defines a maximal splitting rate, kmax, through kmax = 1/τmin.
FIGURE 1.

Ribosome recycling time traces obtained at different EF-G and RRF concentrations and concentration dependencies of the recycling time. (A) Time traces for ribosome splitting obtained in the stopped-flow instrument at 5.1 µM EF-G and varying concentrations of RRF (1–40 µM). The fraction of post-termination complexes remaining in 70S form is plotted as a function of time. (B) Time traces for ribosome splitting obtained at 1 µM RRF and varying concentrations of EF-G, displaying the fraction of post-termination complexes remaining in 70S form as a function of time. (C) Recycling times obtained at 1.0, 5.1, or 10.2 µM EF-G plotted as a function of the RRF concentration. The fitted lines were calculated from Equation 2, with A-parameters determined from the full data set in Table 1 (see Equation 3) at the respective EF-G concentrations. The inset shows a Lineweaver–Burk plot (the inverse of the splitting rate, 1/krec = τrec, plotted versus the inverse of the RRF concentration, 1/[RRF]) of the same data set. (D) Recycling times obtained at 1, 3, or 20 µM RRF plotted as a function of the EF-G concentration for each RRF concentration. The fitted lines were calculated from Equation 2 at the respective RRF concentrations, as in C.
TABLE 1.
The recycling time, τrec (in seconds), estimated at different concentrations of EF-G and RRF
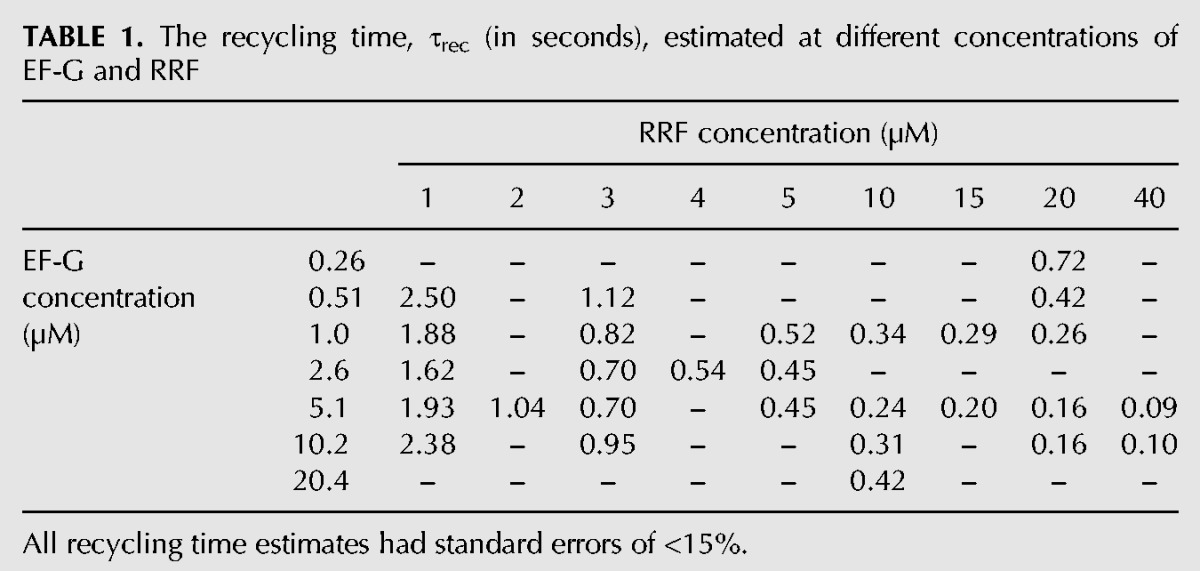
FIGURE 2.

The complete kinetic scheme for ribosome recycling. The definitions of the rate constants and their values are given in Table 2. RRF binds to the post-termination ribosomal complex with rate constant kRRF and is released with rate constant qRRF. EF-G binds to the RRF-free (X = 1) or the RRF-bound (X = 2) post-termination complex with rate constant kGX. EF-G(GTP) can then either be released with rate constant qG(GTP)X or hydrolyze GTP with rate constant kGTPX. After GTP hydrolysis, EF-G(GDP) is released with rate constant qGX. Once EF-G and RRF have bound to the ribosome it splits with rate constant ksplit.
TABLE 2.
Rate constants and Michaelis–Menten parameters describing the ribosome recycling reaction at 37°C (see also Fig. 2)
The expression for τrec can be written in a form (Equation 2) that contains terms (i) independent of the RRF and EF-G concentrations, reflecting the minimal splitting time τmin; (ii) proportional to 1/[RRF], reflecting the activating role of RRF in the splitting reaction; (iii) proportional to [EF-G]/[RRF], reflecting the tug-of-war of RRF as activator and EF-G as inhibitor of ribosome splitting; (iv) proportional to 1/[EF-G], reflecting the activating role of EF-G in the splitting reaction; (v) proportional to 1/([RRF][EF-G]), reflecting the essential roles of both RRF and EF-G for ribosome splitting. In this expression, five constants, A1, A2, A3, A4, and A5, were introduced:
| (2) |
Since the five A parameters in Equation 2 describe different dependencies on the RRF and EF-G concentrations they can all be estimated at high precision from light scattering experiments performed at different factor concentrations. Accordingly, we obtained A-parameter estimates by fitting Equation 2 to the recycling time estimates in Table 1. The A-parameters are functions of the Michaelis–Menten and elemental rate constants as follows from a comparison of Equations 1 and 2:
| (3) |
The minimal recycling time, τmin, given by the parameter A1 in Equations 2 and 3, was estimated as 0.041 sec. It is approximated by τrec when RRF is present in large excess over EF-G at very large concentrations of both factors. From the inverse of the parameter τmin the maximal splitting rate, kmax, was estimated as 25 sec−1. The equilibrium dissociation constant for RRF binding to the post-termination ribosome is, according to Equation 3, given by KRRF = qRRF/kRRF = A5/A4 and was estimated as 3.9 µM (Table 2).
Equation 2 demonstrates how an increasing RRF concentration results in faster ribosome splitting at all EF-G concentrations and that the inverse of the splitting rate (the recycling time) increases linearly with the inverse of the RRF concentration (Fig. 1C, inset). Indeed, at a fixed EF-G concentration Equation 2 is the Lineweaver–Burk form of the Michaelis–Menten equation with EF-G-dependent kcat- and KM-parameters (see Equations 15 and 16 in Materials and Methods). In contrast, the recycling time displays nonlinear dependence on the inverse of the EF-G concentration. EF-G titrations at a fixed RRF concentration do not show Michaelis–Menten behavior: increasing EF-G concentration at fixed RRF concentration first decreases and then increases the recycling time (Fig. 1D). The increase in recycling time is due to nonproductive EF-G binding to the RRF-free post-termination ribosome, which results in futile cycles of GTP hydrolysis by EF-G (see Fig. 2, the vertical branch of the reaction). There exists, in other words, an optimal EF-G concentration at which the recycling time is minimized at a given RRF concentration. By differentiating Equation 2 with respect to [G] and setting the derivative equal to zero one obtains
| (4) |
The optimal EF-G concentrations for 1, 3, and 20 µM RRF in Figure 1D as calculated from Equation 4 are 2.3, 2.7, and 5.1 µM, respectively. The EF-G-dependence of the recycling time near the optimal EF-G concentration becomes flatter with increasing RRF concentration (Equation 17 in Materials and Methods), explaining why the existence of a minimal recycling time becomes less apparent at increasing RRF concentration (see Fig. 1D).
The parameters (KM)G1, kRRF, and qRRF (Fig. 2; Table 2), can be estimated using Equation 3 as described in Materials and Methods (Equations 11–13). These constants are roots of quadratic equations and for the A-values in Equation 3 each one of these three parameters had two possible values. Since the three solutions are connected it is sufficient to determine the correct value for one of the parameters and the other two will follow. Equation 11 gave two possible values, 0.53 or 8.0 µM for the Michaelis–Menten constant (KM)G1 for the interaction of EF-G with the factor-free ribosome. To resolve the ambiguity, we directly determined (KM)G1 in steady-state GTP hydrolysis experiments performed with post-termination ribosomes, EF-G and [3H]-labeled GTP, as described in the next section.
EF-G-dependent GTP hydrolysis on the post-termination ribosome
For precise estimation of (KM)G1, experiments were performed in which the steady-state rate of hydrolysis of [3H]-GTP by EF-G, present at concentrations in the 0–41 µM interval, on post-termination ribosomal complexes (0.17 µM, active concentration) was measured (see Materials and Methods for details). The number of GTP molecules hydrolyzed by EF-G per active ribosome increased linearly with time for the different EF-G concentrations. The slopes of the straight lines estimated the rate of GTP hydrolysis per active ribosome (Fig. 3A). From the dependence of the rate on the EF-G concentration (Fig. 3B), we estimated the Michaelis–Menten parameters (kcat)G1 as 36.0 ± 0.3 sec−1 and (KM)G1 as 0.56 ± 0.02 µM. The estimate of (KM)G1 is virtually identical to the smaller value, (KM)G1 = 0.53, found from the stopped-flow experiments, which removes the ambiguities in the parameter estimates, so that (KM)G1 = 0.56 ± 0.02 µM, kRRF = 15 ± 3 µM−1 sec−1 and qRRF = 58 ± 7 sec−1 (see Equations 11–13 and Table 2).
FIGURE 3.

GTP hydrolysis by EF-G on the post-termination complex in the absence of RRF. (A) The number of GTP molecules hydrolyzed by EF-G per active post-termination complex (0.17 µM) at various EF-G concentrations (0–40.8 µM) plotted as a function of time. [3H]-GTP was present at 1 mM, giving a maximal number of GTP hydrolysis cycles of about 5900. Straight lines were fitted to the data points at each EF-G concentration and the rate of hydrolysis per active post-termination complex was obtained from the slopes. (B) The rate of GTP hydrolysis obtained in A was plotted as a function of the EF-G concentration and fitted to the Michaelis–Menten equation. The (kcat)G1 value was determined as 36 ± 0.3 sec−1 and (KM)G1 value as 0.56 ± 0.02 µM−1 sec−1.
Consumption of GTP molecules in ribosomal recycling
Binding of EF-G to RRF-free as well as to RRF-bound post-termination ribosomes will lead to GTP hydrolysis (Fig. 2). In the former case, there will be futile cycles of GTP hydrolysis. In the latter case there will be ribosome splitting, with putative excess hydrolysis of GTP. According to our model for the splitting reaction (Fig. 2), the number of GTPs hydrolyzed per splitting event, fs, increases linearly with increasing EF-G concentration (Equation 18 in Materials and Methods). In contrast, fs decreases with increasing RRF concentration toward a limiting value, 1 + qG2/ksplit, when the futile reaction cycles of EF-G on RRF-free ribosomes can be neglected. This limiting value reflects the number of GTPs hydrolyzed per splitting event when EF-G binds to an already RRF-containing post-termination ribosome. To determine fs at varying RRF concentrations, we performed ribosome splitting experiments in the stopped-flow instrument and, in parallel, under the same conditions in a quench-flow instrument. Post-termination ribosomes (1 µM) were rapidly mixed with EF-G (0.5 µM), [3H]-GTP (20 µM), RRF (2–60 µM) and IF3 at such high concentration (12 µM) that subunit reassociation after splitting was negligible. In the stopped-flow experiment, the light scattering intensity was monitored as a function of time after mixing, as described above. The absolute concentration of split ribosomes at different incubation times (Fig. 4A) was estimated from the known initial concentration of post-termination ribosomes using Equation 20 (see Materials and Methods and Antoun et al. 2004 for details). In the quench-flow experiment the reaction was quenched with formic acid after different incubation times and the extent of GTP hydrolysis was determined (Fig. 4B). The ratio between the concentration of hydrolyzed GTP and the concentration of split ribosomes was calculated at each time point (Fig. 4C). The ratio increased linearly with time due to, we suggest, EF-G-dependent GTP hydrolysis stimulated by the free 50S ribosomal subunit. Straight lines were fitted to the extents of GTP hydrolysis per splitting event at the different incubation times. The back-extrapolated intercepts with the y-axis, reflecting the number of GTP molecules hydrolyzed per splitting event, were plotted against the RRF concentration (Fig. 4D). At increasing RRF concentration, the curve asymptotically reached a minimal number of 1.1 ± 0.1 GTPs hydrolyzed per ribosome splitting event, corresponding to a value of 0.1 for qG2/ksplit in Equation 18. This means that ribosome splitting after GTP hydrolysis by EF-G on the RRF-bound post-termination ribosome proceeds with remarkably high efficiency. The elemental rate constant ratio qG2/ksplit was used in the expression for A4 in Equation 3 to calculate the binding efficiency of EF-G to the RRF-bound post-termination ribosome, (kcat/KM)G2, as 8.1 ± 0.7 µM−1 sec−1 (see Table 2).
FIGURE 4.

Determination of the number of GTP molecules consumed per ribosome splitting event. (A) Time curves of ribosome splitting obtained in the presence of 1 µM post-termination complexes, 0.5 µM EF-G, 20 µM [3H]-GTP, and different concentrations of RRF. At each RRF concentration, the concentration of split ribosomes, calculated from the fluorescence intensity as described in Materials and Methods, was plotted as a function of time. The points indicate the concentration of split ribosomes at different incubation times, calculated from fits of two-exponential functions to the splitting curves. The curve obtained at 2 µM RRF had lower amplitude because GTP was running out before complete splitting was achieved. (B) Time curves of GTP hydrolysis obtained under the same conditions as in A. At each RRF concentration, the concentration of hydrolyzed GTP was plotted as a function of time. The fitted lines are single exponentials followed by a straight line and are just indicative, as it was the extent of GTP hydrolysis measured at different times of incubation, indicated by the points, that was used for further analysis. (C) The ratio of the concentration of GTP hydrolized in B and the concentration of split ribosomes in A plotted as a function of time at the respective RRF concentrations. Straight lines were fitted to the data points of which the intercepts reflect the number of GTP molecules consumed per splitting event. The slopes reflect GTP hydrolysis by EF-G on 50S subunits formed during the reaction. (D) The number of GTP molecules per splitting event plotted as a function of the RRF concentration and fitted to Equation 18. The inset shows the same data, the number of GTPs consumed per splitting event, as a function of the inverse of the RRF concentration. The intercept of the straight line fitted to the data reflects the minimal number of GTP molecules consumed per splitting event at very high RRF concentrations and is 1.1 ± 0.1.
DISCUSSION
We have used the stopped-flow technique in conjunction with Rayleigh light scattering to study the GTP hydrolysis-dependent (Karimi et al. 1999) splitting of post-termination ribosomes into subunits by EF-G and RRF (Hirashima and Kaji 1973; Janosi et al. 1996). Scattering of visible light by the ribosome and its free subunits is proportional to the concentrations of these particles multiplied with the square of their molecular weights. Therefore, ribosome splitting caused a large relative decrease in the intensity of scattered light (Fig. 1), which was used to obtain precise estimates of average recycling times at greatly varying concentrations of RRF and EF-G. Parallel quench-flow experiments were performed to determine the stoichiometry of GTPs hydrolyzed per splitting event (Fig. 4). For this, the absolute number of split ribosomes was estimated from the light scattering intensity change for comparison with the number of GTPs hydrolyzed. This data set allowed us to formulate a complete kinetic model of ribosome recycling (Fig. 2) and to obtain high-precision estimates of the kinetic parameters that determine the average splitting time (Table 2) as well as the number of GTPs hydrolyzed per splitting event as functions of the concentrations of EF-G and RRF (Fig. 4).
When RRF was titrated at constant EF-G concentration, the splitting time displayed Michaelis–Menten dependence on the RRF concentration (Fig. 1C) with EF-G-dependent kcat- and KM values (Materials and Methods, Equations 15 and 16). At high EF-G concentration, both the kcat and the KM values were high, and very large concentrations of RRF were required for the reaction rate to approach its kcat value. At low EF-G concentration, in contrast, both the kcat and the KM values were low. This kinetic behavior follows as a direct consequence of the double roles of EF-G in ribosome recycling. EF-G is, on the one hand, essential for the splitting reaction and its concentration determines the maximal splitting rate, kcat that can be reached by RRF titration. More specifically, the kcat value obtained in RRF titration at a fixed EF-G concentration increases hyperbolically with the EF-G concentration. For example, at an EF-G concentration of 3.3 µM the splitting rate can be titrated up to 12.5 sec−1, which corresponds to half the maximal splitting rate, kmax, of 25 sec−1 (Equation 16). Very high concentrations of EF-G are required to reach splitting rates close to kmax. EF-G is, on the other hand, a competitive inhibitor of RRF binding to the post-termination ribosome, explaining the high KM-value for RRF at high concentration of EF-G. A consequence of this is that, in addition to a high EF-G concentration, the RRF-to-EF-G concentration ratio must also be high to achieve splitting rates close to kmax. The double roles of EF-G explain why titrations of EF-G at fixed RRF concentration displayed distinct minima for the splitting time, most pronounced at low RRF concentration (Fig. 1D). The presence of distinct minima in the EF-G titrations at constant RRF concentration is caused by the nonzero value of the A3 parameter in Equation 2. We estimated A3 as 0.126 ± 0.008 sec by global fitting of the model in Equation 2 to the set of ribosome splitting times in Table 1. If, in contrast, A3 had been zero, then also the EF-G titrations at fixed RRF concentration would have displayed Michaelis–Menten behavior with monotonic decrease of the splitting time with increasing EF-G concentration.
The features of the splitting reaction described above are illustrated graphically in Figure 5A, where the recycling rate, (1/τrec), calculated from the scheme in Figure 2 (Equation 2) with model parameters from Table 2, is displayed as a function of the RRF and EF-G concentrations in the 0–40 µM and 0–21 µM ranges, respectively. We note that the highest recycling rate obtained in our experiments is 11 sec−1 (Table 1). This value, far below the maximal splitting rate, kmax, of 25 sec−1, was obtained at 40 µM RRF and 5.1 µM EF-G concentrations. The recycling rate estimates of the present study are much larger than those in previous work by Wintermeyer and collaborators (Savelsbergh et al. 2009) as well as by us (Pavlov et al. 2008). The former measured a maximal rate of 0.2–0.3 sec−1 for the splitting reaction at what they referred to as saturating concentrations of EF-G (3 µM) and RRF (5 µM). At similar factor concentrations we obtained in the present work splitting rates of ∼2 sec−1. Previously, we estimated the overall splitting rate as 0.7 sec−1 at EF-G and RRF concentrations of 4 and 9 µM, respectively (Pavlov et al. 2008), fivefold smaller than the rate of 4 sec−1 obtained in the present work at comparable EF-G and RRF concentrations. The cause of these apparent discrepancies can be traced to different free Mg2+ concentrations in the different sets of experiments. For instance, in our previous study, a decrease in free Mg2+ concentration from 5 to 3 mM increased the recycling rate from 0.7 to 1.5 sec−1 (Pavlov et al. 2008). The recycling rate of 4 sec−1 in the present work was obtained at the even lower and physiologically relevant (Borg et al. 2015; Borg and Ehrenberg 2015) free Mg2+ concentration of 1.3 mM. The negative correlation between the Mg2+ concentration and the recycling rate is readily explained by the stabilizing effect of Mg2+ ions on the inter-subunit bridges of the ribosome (Selmer et al. 2006).
FIGURE 5.

The ribosome recycling rate and the number of GTP molecules consumed per splitting event as a function of the EF-G and RRF concentrations. (A) Simulation of the recycling rate according to Equation 1 at 0–21 µM EF-G and 0–40 µM RRF. The rate of recycling, plotted as a function of the RRF and EF-G concentrations, increases in a Michaelis–Menten-dependent manner with increasing RRF concentration at all EF-G concentrations. Note that in this concentration range rates are far below their maximum (25 sec−1). With respect to EF-G, there is an optimal concentration at each RRF concentration yielding a maximal recycling rate. (B) Simulation of the number of GTP molecules consumed per splitting event according to Equation 18 at 0–21 µM EF-G and 0–40 µM RRF. The number of GTPs consumed per ribosome splitting event is plotted as a function of the RRF and EF-G concentrations. At constant RRF concentration the GTP consumption increases linearly with the EF-G concentration, whereas at constant EF-G concentration the GTP consumption decreases hyperbolically with the RRF concentration.
Another comparison between the present work and our earlier study (Pavlov et al. 2008) is relevant here. Back then we assumed that ribosome splitting occurs by a mechanism in which RRF always binds before EF-G to the factor-free post-termination ribosome and neglected binding of EF-G to RRF-free ribosomes. According to this model, we interpreted observed variations in the splitting rate in experiments where RRF was titrated at constant EF-G concentration or where EF-G was titrated at a constant RRF concentration in terms of Michaelis–Menten kinetics (Pavlov et al. 2008). From the present work, we now know that this interpretation is correct in the RRF titration case but not in the EF-G titration case (Equations 15 and 16). It follows, however, from Figure 1D of the present work that the rate of ribosome splitting upon EF-G titration in the 0–6 µM interval at an RRF concentration of 5 µM would deviate but little from Michaelis–Menten behavior. Furthermore, close inspection of the EF-G titration data at 5 µM RRF concentration in Pavlov et al. (2008) shows them to be approximated by but distinct from a Michaelis–Menten model. This means, in summary, that there is consistency between the present results and the results of the previous study, focused on a comparison of ribosome splitting by EF-G and RRF and by IF1 and IF3 (Pavlov et al. 2008).
It is not only the rate of splitting that varies greatly with the EF-G and RRF concentrations, but also the GTP consumption per splitting event. This dependency, described by Equation 18 with parameter values from Table 2, is shown in Figure 5B. At comparably low RRF concentration there is large excess hydrolysis of GTP due to an idling reaction in which EF-Gs in the GTP form bind before RRF to post-termination ribosomes and dissociate in the GDP form after GTP hydrolysis. As the RRF concentration increases the idling reaction decreases due to increased probability of RRF binding before EF-G and the GTP consumption approaches its minimal value of 1.1 GTPs per splitting event. This means a very low intrinsic stoichiometry of GTP usage in subunit separation when EF-G binds to already RRF-containing post-termination ribosomes. However, at comparable concentrations of EF-G and RRF, the probability of nonproductive EF-G binding to RRF-free ribosomes is high due to a higher rate constant for EF-G [kG1 > (kcat/KM)G1 = 63 µM−1 sec−1] than for RRF (kRRF = 15 µM−1 sec−1) association to the post-termination ribosome. Based on these results, we can now explain previous observations by Savelsbergh et al. (2009) of significantly faster Pi-release than ribosome recycling: these observations are not due to a high intrinsic stoichiometry of GTP hydrolysis per splitting event but to a large GTP hydrolysis rate by EF-G-idling on RRF-free ribosomes. Indeed, at the factor concentrations they used, 5 µM RRF and 2 µM EF-G, our model predicts 10 GTP molecules hydrolyzed per splitting event (Equation 18), fully in line with their result.
What, then, could be optimal concentrations of EF-G and RRF for maximal growth rate and maximal fitness of living bacterial cells? An answer to this question must take into account that EF-G is an activator of recycling at low and an inhibitor of recycling at high concentration. This means that the free RRF concentration must be tuned to sufficiently high values in relation to the free EF-G concentration for fast ribosome recycling and little excess GTP hydrolysis. We note that the RRF concentration in the E. coli cell is ∼15 µM (Andersen et al. 1999; Ishihama et al. 2008). Taking this value to approximate the free concentration of RRF, our recycling model predicts the optimal free EF-G concentration to be 4.5 µM, which yields a maximal recycling rate of ∼5 sec−1. In vivo estimates of EF-G have shown that its concentration is ∼80% of the ribosome concentration (Pedersen et al. 1978; Howe and Hershey 1983; Lambert et al. 1983). The free concentration of the factor can be estimated from the fraction of time it stays ribosome-bound during each elongation cycle. We have previously estimated Michaelis–Menten parameters, kcat and KM, for EF-G in translocation as 22 sec−1 and 0.65 µM, respectively (Borg and Ehrenberg 2015). Assuming a peptide bond formation rate constant of ∼100 sec−1 (Johansson et al. 2008) and total ribosome and EF-G concentrations of 50 µM and 40 µM, respectively (Bremer and Dennis 1996), we estimated the concentration of free EF-G in the living cell as 4 µM. This estimate is remarkably close to the above-derived optimal concentration for rapid recycling at an RRF concentration of 15 µM in the living cell. This would suggest that the free concentrations of RRF and EF-G might have been selected during evolution to be in an interval where the rate of ribosome recycling is high and yet without excessive protein investment in the two factors. For a more complete analysis of the optimal choices of EF-G and RRF concentrations for a maximal growth rate the role of EF-G in ribosomal translocation must also be taken into account, which leads to a detailed global modeling of the bacterial cell beyond the scope of the present work.
In summary, we have formulated a complete kinetic model of ribosome recycling which accounts for the experimentally observed variations in ribosome recycling rate and GTP consumption per splitting event in response to varying concentrations of RRF and EF-G. The model predicts the existence of an optimal EF-G concentration for minimal recycling time at fixed RRF concentration, a GTP consumption per recycling reaction approaching one as the recycling rate approaches its highest value of 25 sec−1 and an in vivo recycling rate of ∼5 sec−1 accompanied by consumption of about five GTPs per recycling reaction. The observed recycling rate in our in vitro translation system is fully compatible with the requirement for fast recycling of ribosomes in E. coli bacteria. This suggests the present findings to be in vivo relevant and thus providing a reliable basis for systems biology approaches to bacterial physiology. This in vivo compatibility has been exploited in previous work (Borg et al. 2015) and is used in ongoing work to predict the effects of EF-G-targeting antibiotic drugs on intracellular peptide elongation and ribosomal recycling.
MATERIALS AND METHODS
Materials and reaction conditions
Ribosomes (E. coli MRE600) were prepared according to Johansson et al. (2008). His-tagged EF-G and RRF were overexpressed in E. coli and purified by nickel affinity chromatography. mRNA encoding the peptide fMet-Phe-Thr (sequence GGGAAUUCGGGCCCUUGUUAACAAUUAAGGAGGUAUUAAAUGUUUACGUAAUUGCAGAAAAAAAAAAAAAAAAAAAAA [ORF in bold]) was prepared as described previously (Borg et al. 2015). Purified tRNAPhe was from Chemical block or overexpressed in and purified from E. coli. [3H]-GTP was from Biotrend and unlabeled ATP and GTP were from GE Healthcare. All other chemicals were from Merck or Sigma Aldrich.
All experiments were performed at 37°C in polymix buffer containing 95 mM KCl, 5 mM NH4Cl, 0.5 mM CaCl2, 8 mM putrescine, 1 mM spermidine, 5 mM potassium phosphate, 1 mM dithiothreitol and 5 mM Mg(OAc)2.
RRF and EF-G titration in ribosome recycling
A post-termination complex mixture was prepared containing GTP (1 mM), ATP (1 mM), phosphoenolpyruvate (PEP, 10 mM), pyruvate kinase (PK, 50 µg/mL), myokinase (MK, 2 µg/mL), 70S ribosomes (0.5 µM), tRNAPhe (2 µM), and MFT mRNA (8 µM). A recycling mixture was prepared containing GTP (1 mM), ATP (1 mM), PEP (10 mM), PK (50 µg/mL), MK (2 µg/mL), IF3 (2 µM), RRF (2–80 µM), and EF-G (0.51–40.8 µM, active concentration). The two mixtures were incubated at 37°C for 15 min and then centrifuged at 20,800g for 3 min. They were rapidly mixed in a stopped-flow instrument (AppliedPhotophysics SX20) at 37°C and the real-time decrease in light scattering intensity was recorded at 436 nm.
GTP hydrolysis by EF-G on the post-termination complex
A post-termination complex mixture was prepared containing [3H]-GTP (1 mM), ATP (1 mM), PEP (10 mM), 70S ribosomes (0.4 µM), tRNAPhe (1.9 µM), and MFT mRNA (8 µM). An EF-G mixture was prepared containing cold GTP (1 mM), ATP (1 mM), PEP (10 mM), and EF-G (0–81.6 µM). The two mixtures were incubated at 37°C for 15 min. A zero-time point was taken by quenching 10 µL of each mixture in 150 µL of 20% formic acid. Equal volumes from the two mixtures were mixed and 20 µL aliquots were quenched in 150 µL 20% formic acid after different incubation times. Precipitates were removed by centrifuging twice at 20,800g for 15 min and the supernatant was analyzed by HPLC separation on a Mono-Q column with coupled scintillation detection as described in Johansson et al. (2012).
Stoichiometry of GTP hydrolysis in single round splitting
A post-termination complex mixture was prepared containing ATP (1.96 mM), PEP (10 mM), 70S ribosomes (2 µM), tRNAPhe (5 µM), MFT mRNA (10 µM), and [3H]-GTP (40 µM). A recycling mixture was prepared containing ATP (2 mM), PEP (10 mM), IF3 (24 µM), RRF (4–120 µM), and EF-G (1.0 µM, active concentration). The two mixtures were incubated at 37°C for 15 min. To monitor the GTP hydrolysis reaction equal volumes of the post-termination complex mixture and the recycling mixture were rapidly mixed in a quench-flow instrument and the reaction quenched after different incubation times by mixing with 50% formic acid. Precipitates were removed by centrifugation and the supernatant analyzed by HPLC as described in Johansson et al. (2012). To monitor the ribosome splitting equal volumes of the post-termination complex mixture and the recycling mixture were rapidly mixed in a stopped-flow instrument and the splitting reaction monitored by light scattering as described above.
Mean time calculations and determination of rate constants
The reaction in which EF-G binds to the RRF-free post-termination ribosome, hydrolyzes GTP, and then dissociates is described by the following Michaelis–Menten parameters:
| (5) |
| (6) |
| (7) |
For the binding of EF-G to the RRF-bound post-termination ribosome a corresponding effective association rate constant can be defined as
| (8) |
The time-dependent probabilities for the different ribosomal states in Figure 2 are solutions to a system of differential equations with appropriate initial conditions. Integration of this system from zero to infinite time leads to an algebraic system of equations. Its solution gives the average time the system spends in each ribosomal state:
| (9) |
Here, px(0) are the initial probabilities of being in the different ribosomal states at the start of the reaction. Setting p0(0) to one and all other initial probabilities to zero, meaning that the reaction starts from the factor-free post-termination complex, gives the following solution:
| (10) |
The total average time of ribosome recycling, τrec, is the sum of the average times in Equation 10. Summing and then inserting the definitions of the Michaelis–Menten parameters in Equations 5–8, gives the expression for τrec in Equation 1 of the main text. The recycling time is conveniently represented by five A-parameter terms with distinct dependencies on the RRF and EF-G concentrations (Equation 2). The A parameters are unique functions of the underlying rate constants and Michaelis–Menten parameters (Equation 3). From the A-parameter estimates (Equation 3), we could calculate several constants and, as described in the text, (KM)G1, kRRF and qRRF have physically possible quadratic solutions:
| (11) |
| (12) |
| (13) |
To identify the correct solutions, GTP hydrolysis experiments to determine (KM)G1 were performed (Fig. 3). The upper sign in each equation turned out to be the correct one. Sigma values for the calculated parameters were estimated using the error propagation formula and variances from the correlation matrix, for example for (KM)G1:
| (14) |
Validity of a Michaelis–Menten description of the recycling reaction
We note that Equation 2 can be written in the form of the Lineweaver–Burk equation of enzyme kinetics:
| (15) |
Here, the Michaelis–Menten parameters kcat([G]) and KM([G]) depend on the EF-G concentration as follows:
| (16) |
Equations 15 and 16 show that at a fixed EF-G concentration the recycling time varies linearly with the inverse of the RRF concentration, implying a Michaelis–Menten dependence of the recycling rate on the RRF concentration. The origins of the activating and inhibiting effects of EF-G on the recycling reaction are clearly seen in Equation 16. An increase in the EF-G concentration increases kcat([G]), but also increases the KM([G]) value for RRF binding. These apparent kcat([G]) and KM([G]) parameters can be determined from the y-intercept and the slope of Lineweaver–Burk plots of RRF titrations at fixed EF-G concentrations (see Fig. 1C, inset).
At fixed RRF concentration the recycling time in Equation 2 varies nonlinearly with the inverse of the EF-G concentration, meaning that the rate of ribosome splitting at constant RRF concentration does not show Michaelis–Menten dependence on varying EF-G concentration. Instead, for each RRF concentration the minimum recycling time is reached at an EF-G concentration, [G]opt, given by Equation 4. The flatness of the recycling time dependence on the EF-G concentration near [G]opt is determined by the value of the second derivative of the recycling time calculated at [G]opt:
| (17) |
Equation 17 shows that the higher the RRF concentration, the flatter the dependence becomes, explaining why the minimum of the recycling time in Figure 1D becomes less pronounced at higher RRF concentration.
Calculating the number of GTP molecules consumed per ribosome splitting event
The number of GTP molecules consumed per splitting event is given by the following expression:
| (18) |
To estimate the fs-ratios, GTP hydrolysis and ribosome recycling were monitored in parallel in quench-flow and stopped-flow experiments, respectively. The concentration of hydrolyzed GTP was determined for different incubation times. The ribosome splitting curves were fitted to two-exponential functions on the form The concentration of split ribosomes at different time points was calculated from the curves as described below, Equation 20. The fs ratio was calculated at each time point and plotted against time. Straight lines were fitted to these points with their y-axis intercepts defining the number of GTP molecules consumed per splitting event.
The amount of split ribosomes was calculated from the stopped-flow time traces as described by Antoun et al. (2004). The maximal change in light scattering intensity (which would be seen if all ribosomes were split) was calculated from the molecular weights of the ribosomal subunits (which are 0.85 and 1.5 MDa, respectively [Yonath 2002]):
| (19) |
Here, I(0) is the light scattering intensity at the start of the reaction, when all ribosomes are still in the 70S complex and I(bg) is the light scattering intensity obtained in the absence of ribosomes, but under otherwise equal conditions. The fraction, Popen, of opened ribosomes was calculated as the ratio of the intensity change at any time point [ΔI(t) = I(0)–I(t)] and the maximal intensity change:
| (20) |
Since the total concentration of ribosomes at the start of the reaction is known, this fraction can be converted into an absolute concentration of split ribosomes.
ACKNOWLEDGMENTS
We thank Magnus Johansson for valuable comments on the manuscript. This work was supported by the Swedish Research Council and the Knut and Alice Wallenberg Foundation, RiboCORE.
Footnotes
Article published online ahead of print. Article and publication date are at http://www.rnajournal.org/cgi/doi/10.1261/rna.053157.115.
Freely available online through the RNA Open Access option.
REFERENCES
- Andersen LD, Moreno JM, Clark BF, Mortensen KK, Sperling-Petersen HU. 1999. Immunochemical determination of cellular content of translation release factor RF4 in Escherichia coli. IUBMB Life 48: 283–286. [DOI] [PubMed] [Google Scholar]
- Antoun A, Pavlov MY, Tenson T, Ehrenberg M. 2004. Ribosome formation from subunits studied by stopped-flow and Rayleigh light scattering. Biol Proc Online 6: 35–54. [DOI] [PMC free article] [PubMed] [Google Scholar]
- Borg A, Ehrenberg M. 2015. Determinants of the rate of mRNA translocation in bacterial protein synthesis. J Mol Biol 427: 1835–1847. [DOI] [PubMed] [Google Scholar]
- Borg A, Holm M, Shiroyama I, Hauryliuk V, Pavlov M, Sanyal S, Ehrenberg M. 2015. Fusidic acid targets elongation factor G in several stages of translocation on the bacterial ribosome. J Biol Chem 290: 3440–3454. [DOI] [PMC free article] [PubMed] [Google Scholar]
- Bremer H, Dennis P. 1996. Modulation of chemical composition and other parameters of the cell by growth rate. In Escherichia coli and Salmonella: cellular and molecular biology (ed. Neidhardt FC, et al. ), pp. 1553–1569. ASM Press, Washington, DC. [Google Scholar]
- Dunkle JA, Wang L, Feldman MB, Pulk A, Chen VB, Kapral GJ, Noeske J, Richardson JS, Blanchard SC, Cate JH. 2011. Structures of the bacterial ribosome in classical and hybrid states of tRNA binding. Science 332: 981–984. [DOI] [PMC free article] [PubMed] [Google Scholar]
- Freistroffer DV, Pavlov MY, MacDougall J, Buckingham RH, Ehrenberg M. 1997. Release factor RF3 in E. coli accelerates the dissociation of release factors RF1 and RF2 from the ribosome in a GTP-dependent manner. EMBO J 16: 4126–4133. [DOI] [PMC free article] [PubMed] [Google Scholar]
- Gao N, Zavialov AV, Li W, Sengupta J, Valle M, Gursky RP, Ehrenberg M, Frank J. 2005. Mechanism for the disassembly of the posttermination complex inferred from cryo-EM studies. Mol Cell 18: 663–674. [DOI] [PubMed] [Google Scholar]
- Hirashima A, Kaji A. 1973. Role of elongation factor G and a protein factor on the release of ribosomes from messenger ribonucleic acid. J Biol Chem 248: 7580–7587. [PubMed] [Google Scholar]
- Hirokawa G, Kiel MC, Muto A, Selmer M, Raj VS, Liljas A, Igarashi K, Kaji H, Kaji A. 2002. Post-termination complex disassembly by ribosome recycling factor, a functional tRNA mimic. EMBO J 21: 2272–2281. [DOI] [PMC free article] [PubMed] [Google Scholar]
- Hirokawa G, Nijman RM, Raj VS, Kaji H, Igarashi K, Kaji A. 2005. The role of ribosome recycling factor in dissociation of 70S ribosomes into subunits. RNA 11: 1317–1328. [DOI] [PMC free article] [PubMed] [Google Scholar]
- Hirokawa G, Demeshkina N, Iwakura N, Kaji H, Kaji A. 2006. The ribosome-recycling step: consensus or controversy? Trends Biochem Sci 31: 143–149. [DOI] [PubMed] [Google Scholar]
- Howe JG, Hershey JW. 1983. Initiation factor and ribosome levels are coordinately controlled in Escherichia coli growing at different rates. J Biol Chem 258: 1954–1959. [PubMed] [Google Scholar]
- Indrisiunaite G, Pavlov MY, Heurgué-Hamard V, Ehrenberg M. 2015. On the pH dependence of class-1 RF-dependent termination of mRNA translation. J Mol Biol 427: 1848–1860. [DOI] [PubMed] [Google Scholar]
- Ishihama Y, Schmidt T, Rappsilber J, Mann M, Hartl FU, Kerner MJ, Frishman D. 2008. Protein abundance profiling of the Escherichia coli cytosol. BMC Genomics 9: 102. [DOI] [PMC free article] [PubMed] [Google Scholar]
- Ito K, Fujiwara T, Toyoda T, Nakamura Y. 2002. Elongation factor G participates in ribosome disassembly by interacting with ribosome recycling factor at their tRNA-mimicry domains. Mol Cell 9: 1263–1272. [DOI] [PubMed] [Google Scholar]
- Janosi L, Hara H, Zhang S, Kaji A. 1996. Ribosome recycling by ribosome recycling factor (RRF)—an important but overlooked step of protein biosynthesis. Adv Biophys 32: 121–201. [DOI] [PubMed] [Google Scholar]
- Jelenc PC, Kurland CG. 1979. Nucleoside triphosphate regeneration decreases the frequency of translation errors. Proc Natl Acad Sci 76: 3174–3178. [DOI] [PMC free article] [PubMed] [Google Scholar]
- Johansson M, Bouakaz E, Lovmar M, Ehrenberg M. 2008. The kinetics of ribosomal peptidyl transfer revisited. Mol Cell 30: 589–598. [DOI] [PubMed] [Google Scholar]
- Johansson M, Zhang J, Ehrenberg M. 2012. Genetic code translation displays a linear trade-off between efficiency and accuracy of tRNA selection. Proc Natl Acad Sci 109: 131–136. [DOI] [PMC free article] [PubMed] [Google Scholar]
- Karimi R, Pavlov MY, Buckingham RH, Ehrenberg M. 1999. Novel roles for classical factors at the interface between translation termination and initiation. Mol Cell 3: 601–609. [DOI] [PubMed] [Google Scholar]
- Lambert JM, Boileau G, Howe JG, Traut RR. 1983. Levels of ribosomal protein S1 and elongation factor G in the growth cycle of Escherichia coli. J Bacteriol 154: 1323–1328. [DOI] [PMC free article] [PubMed] [Google Scholar]
- Pavlov MY, Antoun A, Lovmar M, Ehrenberg M. 2008. Complementary roles of initiation factor 1 and ribosome recycling factor in 70S ribosome splitting. EMBO J 27: 1706–1717. [DOI] [PMC free article] [PubMed] [Google Scholar]
- Pedersen S, Bloch PL, Reeh S, Neidhardt FC. 1978. Patterns of protein synthesis in E. coli: a catalog of the amount of 140 individual proteins at different growth rates. Cell 14: 179–190. [DOI] [PubMed] [Google Scholar]
- Peske F, Rodnina MV, Wintermeyer W. 2005. Sequence of steps in ribosome recycling as defined by kinetic analysis. Mol Cell 18: 403–412. [DOI] [PubMed] [Google Scholar]
- Savelsbergh A, Rodnina MV, Wintermeyer W. 2009. Distinct functions of elongation factor G in ribosome recycling and translocation. RNA 15: 772–780. [DOI] [PMC free article] [PubMed] [Google Scholar]
- Scolnick E, Tompkins R, Caskey T, Nirenberg M. 1968. Release factors differing in specificity for terminator codons. Proc Natl Acad Sci 61: 768–774. [DOI] [PMC free article] [PubMed] [Google Scholar]
- Selmer M, Al-Karadaghi S, Hirokawa G, Kaji A, Liljas A. 1999. Crystallization and preliminary X-ray analysis of Thermotoga maritima ribosome recycling factor. Acta Crystallogr D Biol Crystallogr 55: 2049–2050. [DOI] [PubMed] [Google Scholar]
- Selmer M, Dunham CM, Murphy FV IV, Weixlbaumer A, Petry S, Kelley AC, Weir JR, Ramakrishnan V. 2006. Structure of the 70S ribosome complexed with mRNA and tRNA. Science 313: 1935–1942. [DOI] [PubMed] [Google Scholar]
- Sternberg SH, Fei J, Prywes N, McGrath KA, Gonzalez RL Jr. 2009. Translation factors direct intrinsic ribosome dynamics during translation termination and ribosome recycling. Nat Struct Mol Biol 16: 861–868. [DOI] [PMC free article] [PubMed] [Google Scholar]
- Valle M, Zavialov A, Sengupta J, Rawat U, Ehrenberg M, Frank J. 2003. Locking and unlocking of ribosomal motions. Cell 114: 123–134. [DOI] [PubMed] [Google Scholar]
- Yokoyama T, Shaikh TR, Iwakura N, Kaji H, Kaji A, Agrawal RK. 2012. Structural insights into initial and intermediate steps of the ribosome-recycling process. EMBO J 31: 1836–1846. [DOI] [PMC free article] [PubMed] [Google Scholar]
- Yonath A. 2002. The search and its outcome: high-resolution structures of ribosomal particles from mesophilic, thermophilic, and halophilic bacteria at various functional states. Annu Rev Biophys Biomol Struct 31: 257–273. [DOI] [PubMed] [Google Scholar]
- Zavialov AV, Ehrenberg M. 2003. Peptidyl-tRNA regulates the GTPase activity of translation factors. Cell 114: 113–122. [DOI] [PubMed] [Google Scholar]
- Zavialov AV, Hauryliuk VV, Ehrenberg M. 2005. Splitting of the posttermination ribosome into subunits by the concerted action of RRF and EF-G. Mol Cell 18: 675–686. [DOI] [PubMed] [Google Scholar]