

Ravanelli and Appel found that motor neurons and oligodendrocytes are produced sequentially by distinct progenitors that have distinct origins. The motor neuron-to-oligodendrocyte switch results from Hedgehog-mediated recruitment of glial-fated progenitors to the pMN domain subsequent to neurogenesis.
Keywords: oligodendrocytes, neural progenitors, motor neurons, zebrafish, Sonic hedgehog, pMN domain
Abstract
During spinal cord development, ventral neural progenitor cells that express the transcription factors Olig1 and Olig2, called pMN progenitors, produce motor neurons and then oligodendrocytes. Whether motor neurons and oligodendrocytes arise from common or distinct progenitors in vivo is not known. Using zebrafish, we found that motor neurons and oligodendrocytes are produced sequentially by distinct progenitors that have distinct origins. When olig2+ cells were tracked during the peak period of motor neuron formation, most differentiated as motor neurons without further cell division. Using time-lapse imaging, we found that, as motor neurons differentiated, more dorsally positioned neuroepithelial progenitors descended to the pMN domain and initiated olig2 expression. Inhibition of Hedgehog signaling during motor neuron differentiation blocked the ventral movement of progenitors, the progressive initiation of olig2 expression, and oligodendrocyte formation. We therefore propose that the motor neuron-to-oligodendrocyte switch results from Hedgehog-mediated recruitment of glial-fated progenitors to the pMN domain subsequent to neurogenesis.
During vertebrate development, neural progenitor cells divide to expand the progenitor population and enlarge the neural tube and then differentiate as distinct types of neurons and glial cells. One striking feature of neural development is that neurons differentiate before glial cells. For example, pMN progenitors of the ventral spinal cord, defined by expression of the transcription factor Olig2, produce first motor neurons and then oligodendrocytes, the myelinating glial cell type of the central nervous system (Fig. 1A). The mechanisms that maintain neural progenitors and guide the transition from neuron to glial cell production are key determinants of brain size and complexity.
Figure 1.
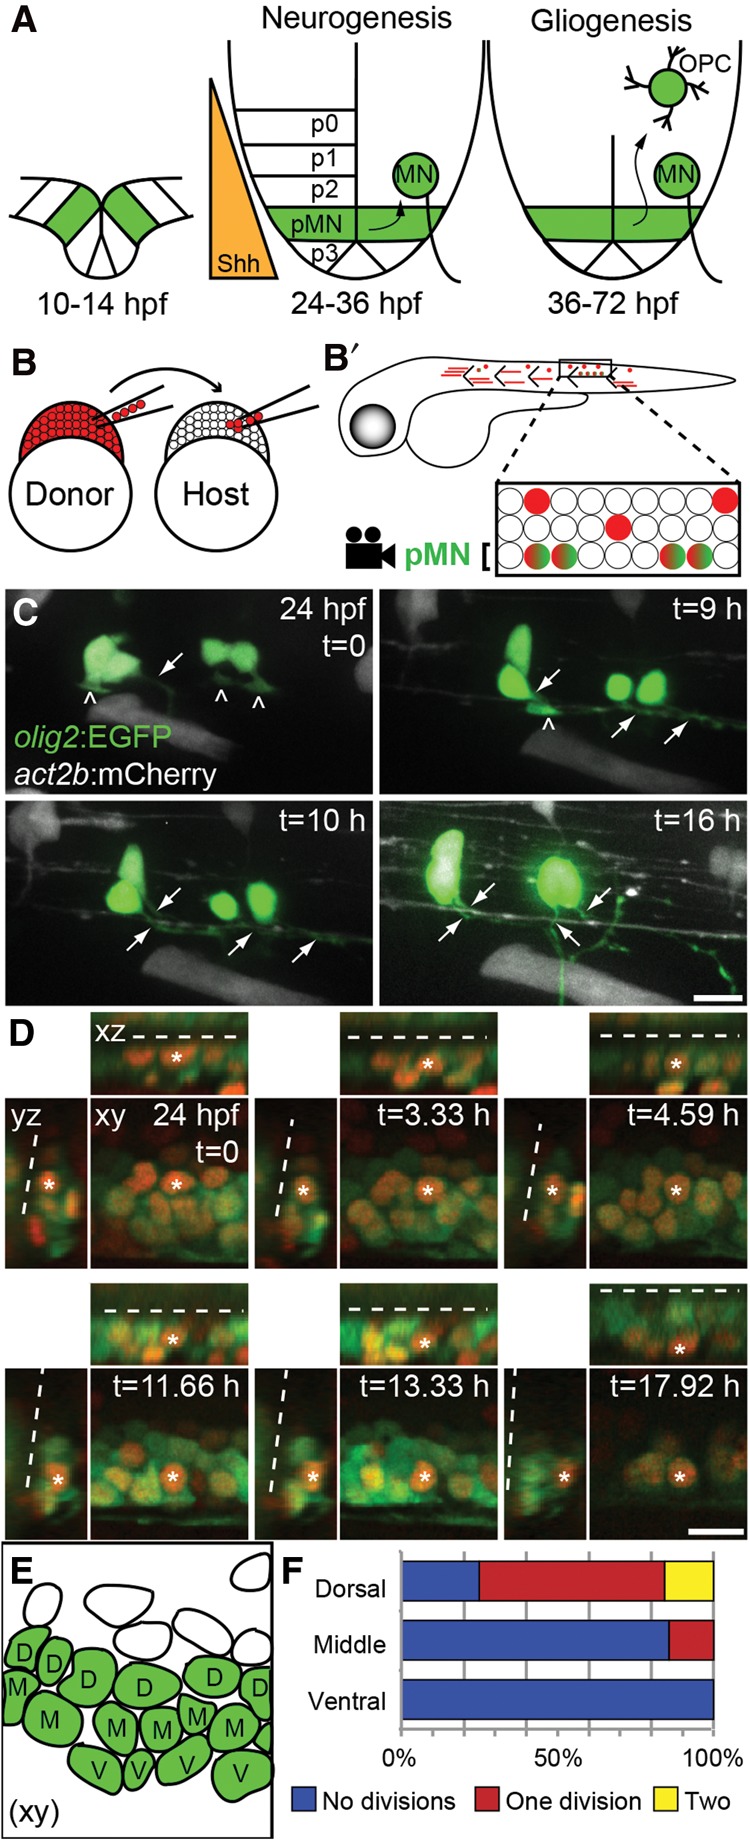
Differentiation and division of pMN progenitors are biased by dorsoventral position. (A) Schematic diagram of the zebrafish neural tube in transverse section depicting the ventral domains (p0–p3) patterned along the Sonic hedgehog (Shh) signaling gradient. The pMN domain (green) is defined by expression of olig2 and gives rise to motor neurons (MN) and then oligodendrocyte precursor cells (OPC) and oligodendrocytes (OL). (B) Schematic diagram of cell transplantation strategy. Cells were transplanted between 1000-cell stage embryos. All transplanted cells express act2b:mCherry (red cells). Transplant-derived pMN domain cells additionally express olig2:EGFP (green + red cells). Lateral views of chimeric embryos were imaged at 24 h post-fertilization (hpf) at the level of the anus. (C) Maximum intensity projection of confocal z-stack images of transplanted olig2:EGFP+ actb2:mCherry+ pMN progenitors. Panels show frames selected from a time-lapse movie (Supplemental Movie S1). The images show a lateral view of the trunk spinal cord, with dorsal to the top. Carets and arrows denote basal processes and axons, respectively. Over time, a basal process transforms into an axon that extends posteriorly and ventrally. (D) Panels show frames selected from a time-lapse movie (Supplemental Movie S2). xy represents a single focal plane of a lateral view of the trunk spinal cord, with dorsal to the top. Orthogonal projections of confocal z-stacks are denoted as xy and yz. xz represents a horizontal projection, and yz represents a transverse projection. Green cells reveal olig2:EGFP expression, and red nuclei result from H2B-RFP expression. Dashed lines mark the central canal. An asterisk denotes an example of a single tracked cell. (E) Schematic representation of D xy t = 0. pMN domain cells appear green and are labeled based on their dorsoventral position within the pMN domain: dorsal (D), middle (M), or ventral (V). (F) Quantification of olig2:EGFP+ pMN cell divisions from 24 to 42 hpf. n = 84 tracked nuclei from six embryos. (t) Time in minutes from the start of the movie. Bars, 10 µm.
Several lines of evidence indicate that the switch from neuronal to glial cell production results from down-regulation of proneuronal factors and activation of proglial factors. For example, spinal cord cells cease to express the proneuronal basic helix–loop–helix (bHLH) transcription factors Ngn1 and Ngn2 prior to oligodendrocyte formation (Zhou et al. 2001). This roughly coincides with the onset of Sox9 and NFIA/B expression, transcription factors that promote gliogenesis (Stolt 2003; Deneen et al. 2006; Kang et al. 2012). Within pMN progenitors, reversible phosphorylation of Olig2 promotes the transition from motor neuron to oligodendrocyte production, perhaps by regulating Olig2 interaction with Ngn2 (Li et al. 2011). Signaling between neural cells, mediated by Notch receptors, might also contribute to the neuron-to-glia switch because elevated Notch activity can block neurogenesis and promote gliogenesis (Gaiano et al. 2000; Chambers et al. 2001; Park and Appel 2003). How these various functions are integrated with the cell lineages that give rise to neurons and glia remains poorly understood.
In principle, individual progenitors could divide repeatedly to sequentially generate neurons and glia. In this scenario, which we refer to as the common progenitor model, the developmental potential of progenitors must change with time to drive successive production of neurons and glia. Consistent with this possibility, lineage tracing techniques revealed that some neuroblasts of the fly nervous system function as common progenitors of neurons and glial cells (Bossing et al. 1997; Schmid et al. 1999), and individual cells isolated from rodent embryonic neural tissue and grown in culture also can produce both neurons and glia (Temple 1989; Reynolds et al. 1992; Davis and Temple 1994; Kalyani et al. 1997). Furthermore, time-lapse imaging revealed that neurons and glia are produced in sequence in rodent cell culture (Qian et al. 2000), suggesting that mechanisms that trigger the neuron–glial switch are intrinsic to individual cell lineages. Additional support for the common progenitor model comes from analysis of the clonal progeny of single labeled neural progenitors in vivo. In particular, the progeny of some clones marked by recombinant retroviral infection in chick and fluorescent dye injection in zebrafish included both motor neurons and cells with the morphological characteristics of oligodendrocyte lineage cells (Leber et al. 1990; Leber and Sanes 1995; Park et al. 2004).
An alternative possibility is that neurons and glial cells arise from distinct progenitors. In this case, which we refer to as a heterogeneous progenitor model, distinct subsets of progenitors are restricted to either neuronal or glial fates. Consistent with this possibility, many clones arising from single cultured neural cells isolated from embryonic day 10.5–14 (E10.5–E14) mouse embryos included only neurons or only glia (Qian et al. 1998). Similarly, the majority of clonally related cell lineages in several rodent in vivo studies exclusively consisted of neurons or glial cells. For example, clones marked by retroviral infection of ventricular zone cells in E12–E14 mouse embryos and E15–E16 rat embryos were almost entirely composed of only neurons or only glia (Luskin et al. 1988, 1993; Grove et al. 1993). Likewise, a significant proportion of mouse telencephalon clones marked by retroviral infection at E9.5 consisted of only glia (McCarthy et al. 2001). The mechanisms that might specify fate-restricted progenitors and control the time at which they differentiate as neurons or glia are not known.
Both common and distinct motor neuron and oligodendrocyte progenitors have been proposed based on gene expression, gene function, and cell ablation data (Lu et al. 2002; Zhou et al. 2002; Liu and Rao 2003; Rowitch 2004; Mukouyama et al. 2006; Wu et al. 2006). In this study, we aimed to resolve the uncertain lineage relationship of motor neurons and oligodendrocyte precursor cells (OPCs) and identify the potential basis of neuronal and glial fate specification. To do so, we performed a series of in vivo, time-lapse imaging experiments using zebrafish embryos, which allow direct visualization of neural progenitor behavior. Our data provide strong evidence that at least the majority of motor neurons and OPCs arise from distinct progenitors. Importantly, progenitors that produce OPCs acquire pMN identity after those that produce motor neurons instead of at the same time. By tracking cell movements and gene expression, we learned that neuroepithelial cells that originate dorsal to the pMN domain move ventrally and initiate olig2 expression, characteristic of pMN identity, concomitant with motor neuron differentiation. Inhibition of Hedgehog (Hh) signaling during motor neuron differentiation stalled ventral movement of neuroepithelial cells and eliminated OPC development. We propose that ventral sliding of the neuroepithelium brings new cells in range of Hh signals to replenish pMN progenitors that differentiate as motor neurons. This process, which we call progenitor recruitment, provides a mechanistic basis for the sequential production of motor neurons and OPCs from distinct progenitors.
Results
pMN progenitor fate is biased by dorsoventral position
To test the fate of individual pMN progenitors, we first performed blastula stage transplantation followed by in vivo confocal time-lapse microscopy. To do so, we transplanted cells from olig2:EGFP;actb2:mCherry transgenic donor embryos into stage-matched wild-type hosts (Fig. 1B). In this experiment, all transplanted cells expressed mCherry from the actb2 (β-actin) reporter, which drives ubiquitous expression, and pMN progenitors and their descendents additionally expressed EGFP under control of olig2 regulatory DNA (Shin et al. 2003). At 22–24 h post-fertilization (hpf), we sorted host embryos that had transplanted EGFP+ pMN cells. Progenitors were readily evident as cells having neuroepithelial morphologies with apical membranes lining the ventricle and basal projections connecting to the pial surface (Fig. 1C). We then imaged individual EGFP+ mCherry+ pMN cells continuously until 42 hpf. Of 108 individual olig2:EGFP+ progenitors, 90 differentiated into motor neurons without dividing (Fig. 1C; Supplemental Movie S1). Five cells remained as pMN progenitors without dividing, 11 cells divided to produce two new progenitors, and two cells divided once to produce two neurons. Notably, no cells divided asymmetrically to produce a neuron and a new progenitor. These data lead us to three conclusions. First, many progenitors in the pMN domain at 24 hpf differentiate as motor neurons without dividing immediately beforehand. Second, pMN progenitor divisions that occur within this developmental period are symmetric, producing either two new progenitors or two neurons. Third, the pMN progenitor pool does not appear to be maintained by asymmetric, self-renewing divisions.
In zebrafish, the pMN domain at 24 hpf is approximately three cells deep on the dorsoventral axis. Is the probability that a pMN progenitor differentiates as a neuron or divides influenced by the dorsoventral position of a cell within the pMN domain? To gain insight into this question, we used time-lapse imaging to assess the behaviors of individual progenitors within the pMN domain. To track individual cells, we injected cleavage stage olig2:EGFP embryos with mRNA encoding either DsRed2 fluorescent protein containing a nuclear localization motif (dsRed2nuc) or the human histone protein HIST2H2BE fused to RFP (H2B-RFP). We collected confocal z-stack images at the level of the trunk spinal cord from 24 to 41 hpf. For this experiment, we defined pMN progenitors as olig2:EGFP+ cells with nuclei positioned adjacent to the spinal cord lumen (Fig. 1D). As expected, pMN progenitors moved radially from the spinal cord lumen and differentiated as motor neurons (Fig. 1D; Supplemental Movie S2); however, we found a clear bias based on starting position. Whereas all ventral pMN progenitors produced motor neurons (n = 38), only 71% (n = 14) and 22% (n = 32) of middle and dorsal pMN progenitors, respectively, generated motor neurons.
By tracking mitoses, we found that progenitor position (Fig. 1E) also correlated with cell division. All ventral (n = 38) and 12 of 14 middle pMN progenitors differentiated as motor neurons without dividing (Fig. 1F). In contrast, the majority of dorsal pMN progenitors divided one to two times (n = 32) (Fig. 1F). Most divisions produced two new pMN progenitor progeny that remained associated with the lumen and did not differentiate during the imaging period. These data indicate that ventral pMN progenitors divide rarely and differentiate as motor neurons, whereas more dorsal pMN progenitors tend to remain proliferative and undifferentiated. Thus, whether a pMN progenitor differentiates as a neuron or divides correlates with its position on the dorsoventral axis, raising the possibility that spatial cues operate within the pMN domain to specify progenitor fate.
Motor neurons and OPCs arise from distinct cell lineages that initiate olig2 expression at different times
Our data indicate that, at 24 hpf, most olig2:EGFP+ pMN progenitors that differentiate as motor neurons do so without dividing. This observation is inconsistent with a common lineage model in which motor neurons and OPCs develop from a common progenitor and instead suggests that they arise from different cell lineages (Fig. 2A). What, then, is the origin of progenitors that produce OPCs? One possibility, which we refer to as a heterogenous progenitor model, is that olig2:EGFP+ pMN progenitors are mixed and fate-restricted, whereby some produce only motor neurons and others, perhaps those in dorsal pMN, produce only OPCs. A second possibility, which we call a progenitor recruitment model, is that pMN progenitors that develop as OPCs initiate olig2:EGFP expression after those that develop as neurons. To begin to distinguish between these possibilities, we used photoconvertible Kaede fluorescent protein expressed by an olig2 transgene (Zannino and Appel 2009) to determine whether cells that develop as neurons and OPCs initiate olig2 expression at the same or different times. When exposed to ultraviolet (UV) light, green Kaede (olig2:Kaedegreen) is converted to red (olig2:Kaedered). Thus, at the time of photoconversion, all olig2:Kaedegreen-expressing progenitors turn red, and their progeny inherit the red Kaede protein. Motor neurons down-regulate olig2 expression; therefore, most motor neurons derived from photoconverted progenitors remain red because they no longer express new olig2:Kaedegreen. pMN cells and OPCs derived from photoconverted progenitors continue to express olig2:Kaedegreen and appear yellow (Kaedeyellow) from a combination of photoconverted and newly synthesized unconverted Kaede. Thus, from both the common and heterogeneous progenitor models, we predict that photoconversion during the period of motor neuron differentiation would result in red motor neurons and yellow OPCs (Fig. 2B). In contrast, the progenitor recruitment model leads to the prediction that photoconversion during motor neuron differentiation would result in red motor neurons and green OPCs, if progenitors that produce OPCs initiate olig2:Kaede expression after those that produce motor neurons (Fig. 2B).
Figure 2.

Motor neurons and oligodendrocytes arise from distinct cell lineages that progressively initiate olig2 expression. (A) Two contrasting models of pMN lineages. Under the common progenitor model, an individual pMN progenitor can produce both motor neurons (MN) and oligodendrocytes (OL). Under the heterogeneous progenitor model, motor neurons and oligodendrocytes arise from distinct, lineage-restricted pMN progenitors. (B) Schematic of olig2:Kaede photoconversion strategy and experimental predictions. Red cells represent photoconverted Kaede (Kaedered). Green cells represent those that initiate Kaedegreen expression after photoconversion. Yellow cells represent those that contain Kaedegreen and Kaedered (Kaedeyellow). White cells (olig2−) represent those that do not express olig2:Kaede at the time of photoconversion. The purple bolt indicates the time of UV light illumination for photoconversion. (C) Lateral view of a 72-hpf olig2:Kaede embryo in which Kaede was photoconverted at 24 hpf. Asterisks mark Kaedered motor neurons, and arrows indicate Kaedegreen OPCs. Kaedeyellow cells may appear orange due to the variable fluorescence intensity of Kaedered to Kaedegreen. (D) Transverse (yz) view, dorsal to the top, of a confocal z-projection of a 72-hpf olig2:Kaede embryo photoconverted at 24 hpf. The arrow denotes a Kaedegreen OPC. (E) Schematic representation of the image shown in D. Asterisks mark putative pMN progenitor cells. The dashed line denotes the central canal. (F) Lateral view of 72-hpf olig2:Kaede embryo photoconverted at 36 hpf. Asterisks mark Kaedered motor neurons, the arrow indicates a Kaedegreen OPC, and arrowheads mark OPCs with both Kaedegreen and Kaedered. (G) Transverse (yz) view from confocal z-projection of 72-hpf olig2:Kaede embryo photoconverted at 36 hpf. (H) Schematic representation of the image shown in G. (I) Graph showing the percentage of total dorsally migrated OPCs that were Kaedeyellow or Kaedegreen (n = 3136 OPCs from 114 embryos) in olig2:Kaede embryos photoconverted at the indicated time points. Error bars indicate SEM. Bars 10 µm.
To test these predictions, we photoconverted embryos at 24 hpf and analyzed them at 72 hpf. Motor neurons that migrated dorsolaterally were red as a consequence of the photoconverted Kaede (Fig. 2C–E). In contrast, dorsally migrated OPCs as well as numerous cells within the pMN domain were green, indicating that they initiated olig2 expression after photoconversion at 24 hpf (Fig. 2C–E). To determine when oligodendrocyte lineage cells initiated olig2:Kaedegreen expression, we photoconverted Kaede in different groups of embryos at 2-h intervals. This revealed a progressive decrease in the number of OPCs that were only green and a concomitant increase in the number of yellow OPCs (Fig. 2F–I). Similarly, there appeared to be more olig2:Kaedeyellow cells and fewer olig2:Kaedegreen cells within the pMN domain with progressively later photoconversions (Fig. 2F–I). These data support two main conclusions. First, because cells that produce motor neurons and OPCs initiate olig2 expression at different times, motor neurons and OPCs must arise from distinct pMN progenitors. Second, the sequential expression of olig2 by OPCs and some pMN cells following motor neuron formation indicates that ventral spinal cord cells acquire pMN identity progressively, consistent with the progenitor recruitment model.
Ventral movement of neuroepithelial cells contributes to pMN progenitor recruitment
One possible explanation of our data is that fate-restricted progenitors within the pMN domain initiate olig2 expression at different times. However, as in mice (Mukouyama et al. 2006), all cells within the pMN domain appear to express olig2. An alternative explanation is that new cells move into the pMN domain and initiate olig2 expression concomitant with motor neuron formation. If so, the appearance of olig2:Kaedegreen following photoconversion might reveal the source of new progenitors recruited to the pMN domain. We therefore photoconverted olig2:Kaede at 24 hpf and performed time-lapse imaging to assess nascent olig2:Kaedegreen expression. During the next 13 h, numerous olig2:Kaedegreen cells appeared almost exclusively at the dorsal edge of the previously photoconverted olig2:Kaedered cells (Fig. 3A; Supplemental Movie S3). Thus, cells dorsal to the original olig2+ pMN domain adopt pMN identity during the period of motor neuron differentiation.
Figure 3.

The pMN domain is maintained by recruitment of new progenitors that move ventrally within the spinal cord. (A) Panels show frames selected from a time-lapse movie (Supplemental Movie S3). (t) Time in minutes from the start of the movie. Images show lateral views of the trunk spinal cord with dorsal to the top. (Top panels) At 24 hpf, olig2:Kaede was fully photoconverted from green to red and imaged continuously. Dashed lines mark the most dorsal olig2:Kaedered ventricular cells. (Middle panels) By 7.5 h post-conversion (29.5 hpf), faint olig2:Kaedegreen is evident in some cells (green arrows) dorsal to the pMN boundary. (Bottom panels) By 11 h post-conversion (35 hpf), numerous cells at the dorsal edge of the original pMN boundary are Kaedegreen. Red arrows mark Kaedered motor neurons that have migrated dorsolaterally. Yellow arrows mark Kaedeyellow pMN cells that continue to express olig2:Kaede. Asterisks denote dorsolaterally migrated olig2:Kaedered neurons out of the plane of focus. (B) Panels show frames selected from a time-lapse movie (Supplemental Movies S4, S5) of an olig2:EGFP embryo injected with mRNA encoding dsRed2nuc. Images are focused on the trunk spinal cord from lateral orientation, and dorsal is to the top. Nuclei of EGFP− (o) and EGFP+ (+) cells were tracked continuously, beginning at 24 hpf. The dashed line represents the dorsal border of the EGFP+ pMN domain. By 39 hpf, numerous cells that originated dorsal to the pMN domain occupied positions within the pMN domain and expressed olig2:EGFP. The top panels show merged images, and the bottom panels show only EGFP expression. (C) Graph showing the percentage of tracked EGFP− cells at various distances from the dorsal border of the pMN domain that initiated expression of olig2:EGFP. n = 218 cells from 15 embryos. (D) Transverse section of a 72-hpf dbx1b:GFP zebrafish trunk spinal cord. White arrowheads denote a dbx1b:GFP+ p0 progenitor. Brackets denote p2–p3 domains marked by Nkx6.1 expression. (E) Schematic representation of Nkx6.1+ progenitors (red) and GFP+ cells (green). (F) Transverse section of a 72-hpf zebrafish trunk spinal cord. dbx1b:Cre-converted ubi:Zebrabow cells were stained with anti-GFP antibody (green). p2–p3 domain progenitors were stained with anti-Nkx6.1 antibody (red). The arrow indicates an Nkx6.1+ p2 cell that expressed dbx1b:Cre. (G) Schematic representation of Nkx6.1+ progenitors (red) and Cre-converted cells (green). The double-positive cell in p2 domain appears red/green. Bars, 10 µm.
One potential reason for why cells close to the dorsal boundary of the pMN domain initiate olig2 expression is that the pMN domain expands dorsally to include more cells. Alternatively, more dorsally positioned cells might move ventrally to enter the pMN domain. To distinguish between these possibilities, we expanded our initial analysis of the tracking data described in Figure 1 to follow cells outside the pMN domain. This analysis showed that cells located within one to two cell diameters of the dorsal edge of the pMN domain descended ventrally and initiated olig2:EGFP expression (Fig. 3B,C; Supplemental Movie S4). At the same time, cells already within the pMN domain shifted ventrally and differentiated as they reached more ventral positions (Fig. 3B; Supplemental Movie S5). These data indicate that, as motor neurons differentiate, new pMN progenitors are recruited from more dorsally positioned cells that move ventrally to enter the domain.
To help map the origin of cells that descend to the pMN domain and investigate whether ventral movement of progenitors is a general feature of spinal cord development, we determined the distribution of cells that arise from p0 domain progenitors. To do so, we used the transgenes dbx1b:GFP (Satou et al. 2012) to transiently mark p0 domain cells and dbx1b:Cre (Satou et al. 2012) to mediate recombination of a ubi:Zebrabow reporter (Pan et al. 2013), thereby providing a permanent marker of p0 domain progeny. At 72 hpf, dbx1b:GFP expression was limited to cells dorsal to those that expressed Nkx6.1, which marks cells of the p2–p3 domains (Fig. 3D,E; Briscoe and Ericson 1999). In contrast, some Nkx6.1+ cells were marked by ubi:Zebrabow expression (Fig. 3F,G). We interpret these results to mean that some cells that originated in p0 moved ventrally to the p2 domain, terminated dbx1b expression as they exited the p0 domain, and initiated nkx6.1 expression as they entered the p2 domain. These observations support several conclusions. First, ventral movement of progenitors is not limited to those that descend into the pMN domain but also includes more dorsal cells, raising the possibility that similar progenitor movements occur throughout the spinal cord. Second, p0 domain progenitors do not enter the pMN domain, indicating that the likely origin of newly recruited pMN progenitors is the p1–p2 domains. Third, movement of progenitors between domains and concomitant changes in the gene expression profiles characteristic of those domains indicate that progenitors retain fate plasticity.
Ventrally moving cells retain neuroepithelial features
Do spinal cord progenitors delaminate from the neuroepithelium and move as individuals or retain their neuroepithelial characteristics during ventral movement between progenitor domains? To distinguish between these possibilities, we injected cleavage stage olig2:Kaede embryos with mRNA encoding a functional fusion of the apical Par polarity protein Pard3 to GFP (Tawk et al. 2007). These embryos were repeatedly exposed to 405-nm light to maintain Kaedered photoconversion, allowing visualization of Pard3-GFP. At 24 hpf, we identified Kaede− Pard3-GFP+ neuroepithelial cells positioned dorsally to the pMN domain and tracked their movements using time-lapse confocal microscopy. Tracked cells that moved ventrally and subsequently initiated olig2:Kaede expression retained apical localization of Pard3-GFP, indicating that they remained as neuropethelial cells (Fig. 4A; Supplemental Movie S6). Cells retained apical localization of Pard3-GFP even during cell division and only down-regulated Pard3-GFP concomitant with lateral movement of the soma during differentiation (Fig. 4B; Supplemental Movie S7). These data indicate that progenitors recruited to the pMN domain preserve neuroepithelial characteristics, indicating that the neuroepithelium shifts ventrally as ventral pMN progenitors delaminate, move radially, and differentiate as neurons.
Figure 4.
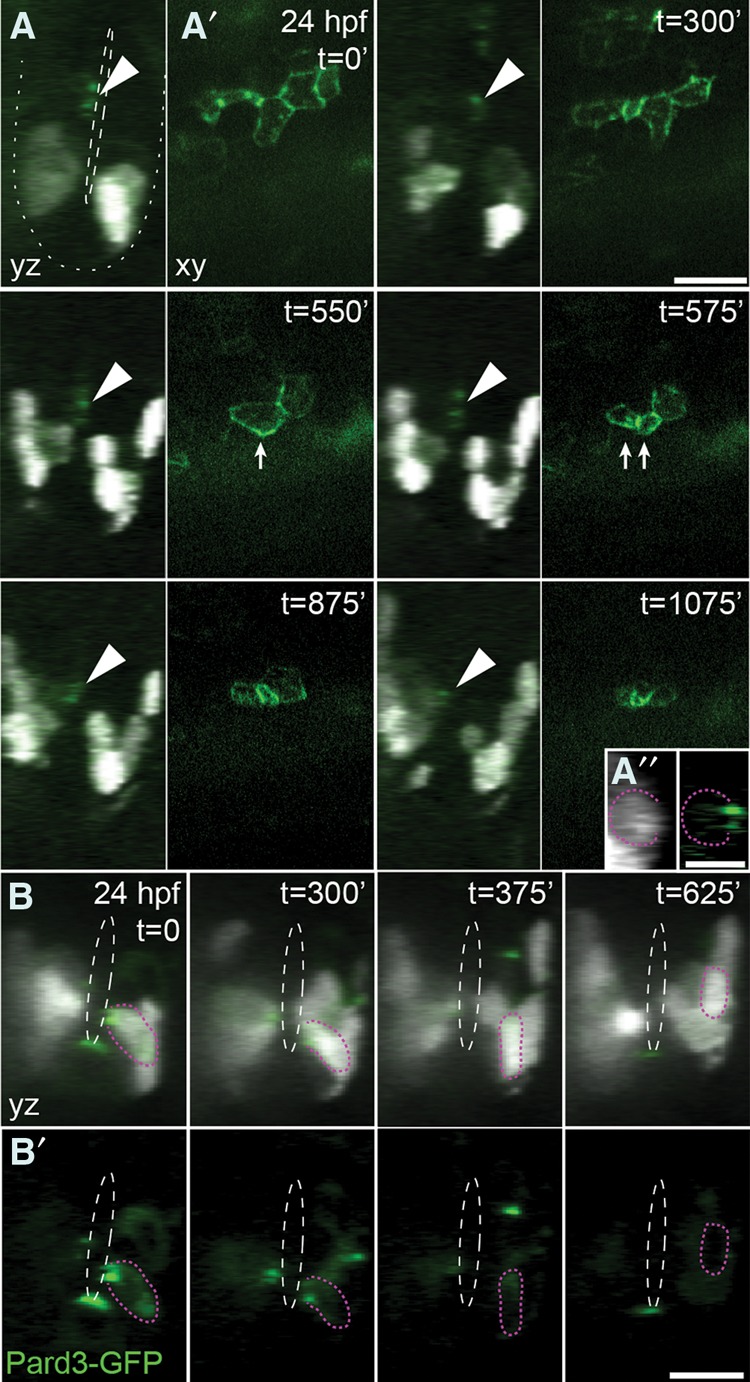
Progenitor cells retain neuroepithelial characteristics while they move ventrally to the pMN domain. Panels show frames selected from time-lapse movies. (t) Time in minutes from the start of the movie. olig2:Kaede embryos were injected with CMV:pard3-GFP DNA and photoconverted repeatedly during imaging to allow visualization of Pard3-GFP (green). Kaedered cells appear white. Orthogonal (yz [A,B] and xy [A′,B′]) projections of confocal z-stacks of a trunk spinal cord imaged from 24 hpf. Dashed white lines denote the central canal. The dotted white line outlines the ventral neural tube. (A) Arrowheads denote Pard3-GFP apical localization in olig2:Kaedered-negative cells at 24 hpf that move ventrally over time to become olig2:Kaedered-positive (Supplemental Movie S6). (A′′) Insets from the t = 1075-min transverse (yz) image are contrast-enhanced to show coexpression of olig2:Kaedered and Pard3-GFP. The tracked cell is outlined by a dotted magenta line. Arrows denote cell division within the neuroepithelium in successive time points. (B) Pard3-GFP apical localization in olig2:Kaedered-positive progenitors is lost upon differentiation and dorsolateral migration away from the central canal (denoted by dashed white lines) (Supplemental Movie S7). The top panels show merged images (olig2:Kaedered with Pard3-GFP), and the bottom panels show only Pard3-GFP. The tracked cell is outlined by a dotted magenta line. Bars: A,B, 10 µm; A″, 5 µm.
pMN progenitor recruitment requires Hh signaling
Experiments using explanted neural tube tissue showed that similar concentrations of Shh induced formation of both motor neurons and oligodendrocytes (Pringle et al. 1996; Orentas et al. 1999). How these distinct cell types are specified by the same level of Shh signaling is not known. Our observation that some dorsally positioned progenitors acquire pMN identity led us to hypothesize that ventral cell movement repositions progenitors within the Shh morphogen gradient, causing them to initiate olig2. If so, blocking Shh signaling at the time of motor neuron formation should interfere with pMN progenitor recruitment, resulting in fewer olig2+ cells and a deficit of OPCs. To test this prediction, we treated olig2:EGFP embryos injected at cleavage stage with mRNA encoding dsRed2nuc with cyclopamine, which effectively reduces Hh signal transduction, at 24 hpf. Cell tracking revealed that cells within one to two cell diameters of the dorsal edge of the pMN domain did not move ventrally and did not express olig2:EGFP (Fig. 5A; Supplemental Movie S8). Additionally, there were fewer EGFP+ cells at the end of the imaging period in cyclopamine-treated embryos (average of 31.7 ± 1.9 EGFP+ cells per hemisegment; n = 4 embryos) than in control embryos (average of 38.2 ± 0.3 EGFP+ cells per hemisegment; n = 4 embryos; P < 0.01). Finally, and consistent with our previous data showing that continuous Hh signaling is required for OPC formation (Park et al. 2004), embryos treated at 24 hpf with cyclopamine had fewer OPCs at 72 hpf than controls, in a dose-dependent manner (Fig. 5B–D). We interpret these data to mean that ventral movement maintains the pMN domain by bringing progenitors within range of Hh signals that specify pMN identity and that progenitor recruitment by continuous Hh signaling is necessary for OPC development.
Figure 5.
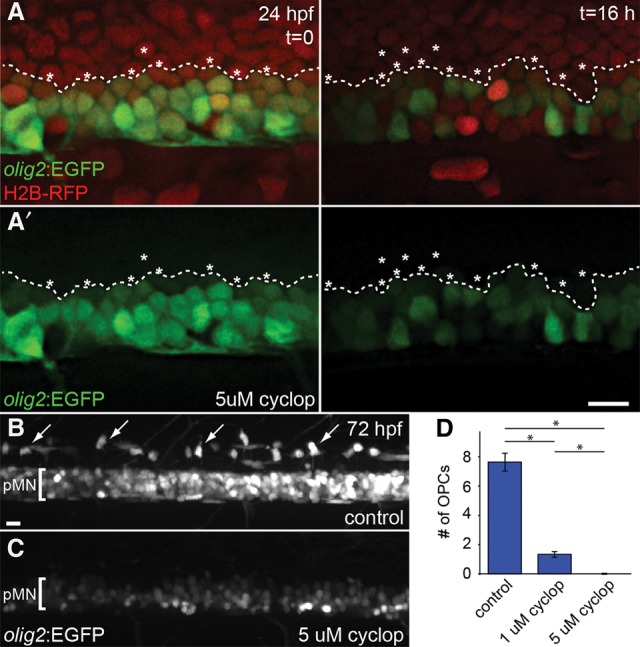
Progenitor recruitment and OPC specification require Hh signaling. (A) Panels show frames selected from a time-lapse movie (Supplemental Movie S8) of an olig2:EGFP embryo injected with mRNA encoding H2B-RFP. Images are focused on the trunk spinal cord from lateral orientation, and dorsal is to the top. Embryos were treated with 5 µM cyclopamine at 24 hpf to inhibit Hh signaling and were imaged continuously. Nuclei of EGFP− (*) cells were tracked, beginning at 24 hpf. The dashed line represents the dorsal border of the EGFP+ pMN domain. By 40 hpf, cells that originated dorsal to the pMN domain remained at their original dorsoventral position and did not initiate expression of olig2:EGFP. The top panels show merged images, and the bottom panels show only EGFP expression. (B,C) Maximum intensity projection of confocal z-stack images of olig2:EGFP embryos treated with vehicle control or 5 µM cyclopamine at 24 hpf and imaged at 72 hpf. Images are focused on the trunk spinal cord with dorsal to the top. Dorsally migrated OPCs are marked with white arrows. The pMN domain is marked with brackets. (D) Graph showing the number of dorsally migrated OPCs per bilateral hemisegment in control (n = 10 embryos), 1 µM cyclopamine-treated (n = 10 embryos), or 5 µM cyclopamine-treated(n = 11 embryos) embryos . (*) P < 0.001. Error bars indicate SEM. Bars, 10 µm.
Discussion
In vertebrate embryos, neural cell fate is determined in part by positional information. For example, the dorsoventral axis of the neural tube is patterned by graded distribution of the morphogens Shh and Bmp, resulting in distinct progenitor populations that produce different kinds of neurons. Importantly, spatial patterning is integrated with temporal patterning to diversify neural cell fate. In particular, after producing neurons, progenitors switch to glial cell production. These features of neural development raise a fundamental question: How do progenitors that are exposed to a particular combination of spatial cues give rise to different cells over time? Here we provide evidence that, as motor neurons differentiate, developmentally plastic progenitors are repositioned within the Hh signaling gradient to be specified for oligodendrocyte fate.
One mechanism by which neural progenitors could produce different cells at different times is by progressing through a series of asymmetric, self-renewing divisions. A good example of this is provided by Drosophila neuroblasts, which, as they divide, express a sequence of transcription factors that specify progeny cells for distinct neuronal fates (Isshiki et al. 2001; Cleary 2006; Kao et al. 2012; Bayraktar and Doe 2013). Whether a similar type of mechanism specifies the progeny of self-renewing pMN progenitors for motor neuron and oligodendrocyte fates has not been clear. Neural explant and gene expression studies suggested that many oligodendrocytes develop from the ventral spinal cord, close to motor neurons (Warf et al. 1991; Noll and Miller 1993; Pringle and Richardson 1993; Yu et al. 1994; Timsit et al. 1995), and are therefore consistent with the possibility of a common progenitor origin. Also consistent with a common progenitor hypothesis are observations that both motor neuron and oligodendrocyte progenitors express the Olig1 and Olig2 transcription factors and that both cell types fail to develop in mouse and zebrafish embryos that lack Olig functions (Lu et al. 2002; Park et al. 2002; Takebayashi et al. 2002; Zhou et al. 2002). Furthermore, analysis of the clonal progeny of neural cells marked by viral or fluorescent tracers in chicks and zebrafish indicated that motor neurons and oligodendrocytes can arise from common lineages (Leber et al. 1990; Leber and Sanes 1995; Park et al. 2004). However, most of the reported clones contained only neurons, suggesting that a shared lineage is not obligatory for motor neuron and oligodendrocyte development. Indeed, more recent studies revealed that dorsal progenitors that are far removed from motor neurons also produce oligodendrocytes (Cai et al. 2005; Fogarty et al. 2005; Vallstedt et al. 2005), showing that motor neuron and oligodendrocyte specification can be uncoupled. In this study, we present two new lines of evidence that at least the majority of motor neurons and oligodendrocytes arise from distinct pMN progenitor cell lineages. First, our time-lapse imaging showed that most motor neurons differentiated from pMN progenitors without undergoing a division to produce an oligodendrocyte-fated progenitor. Second, our Kaede photoconversion experiments showed that motor neuron and oligodendrocyte progenitors initiated olig2 expression at different times, which is most compatible with the idea that they belong to different lineages. We therefore conclude that most motor neuron and oligodendrocytes do not arise from shared lineages but instead from distinct progenitors.
If distinct pMN progenitor cells produce motor neurons and oligodendrocytes, how are they specified? One possibility is that pMN progenitors have equivalent potential for motor neuron and oligodendrocyte fates but are stochastically selected to develop as one or the other cell type. Consistent with this possibility are observations that Notch signaling, which stochastically selects ectodermal cells for neuroblast fate in Drosophila (Simpson 1997), limits motor neuron formation and promotes OPC development in zebrafish (Park and Appel 2003). However, neural cell lineages were not observed directly in embryos having deficient or hyperactive Notch signaling, leaving the relationship of distinct pMN progenitors to one another and the basis of Notch-mediated fate specification unclear. Recent data showing that Notch activity increases the sensitivity of neural cells to Shh (Huang et al. 2012; Kong et al. 2015; Stasiulewicz et al. 2015) raise the possibility that Notch regulation of motor neuron and oligodendrocyte fates results from modulation of Hh signaling instead of by mediating binary fate decisions among equivalent progenitors. Our time-lapse imaging studies now reveal how distinct progenitors might respond to discrete levels of Notch and Hh signaling activity over time to form motor neurons and oligodendrocytes. By tracking cell division and fate, we uncovered evidence of a differentiation gradient within the pMN domain in which the ventral-most pMN progenitors differentiate as motor neurons without dividing, while more dorsal pMN cells continue to divide. Surprisingly, in a process that we call progenitor recruitment (Fig. 6), we also found that neuroepithelial progenitors that originated dorsal to the pMN domain moved ventrally and initiated olig2 expression at the same time that ventral pMN progenitors moved radially and differentiated as motor neurons. Cells added to the pMN domain likely include oligodendrocyte-fated progenitors because they initiate olig2 expression after motor neuron-fated progenitors. Addition of new progenitors to the pMN domain requires Hh signaling because blocking Hh eliminated ventral cell movement, reduced the number of pMN cells, and abolished OPC formation. We therefore propose that progenitor recruitment repositions cells within the Hh signaling gradient, leading to the sequential production of motor neurons and oligodendrocytes (Fig. 6). Importantly, our model provides the basis for a new interpretation of the subset of clones in our previous work that contained both motor neurons and oligodendrocytes (Park et al. 2004). We now speculate that mixed clones arose from more dorsal, highly proliferative progenitors that produced progeny cells that moved ventrally and initiated olig2 expression at different times to become motor neurons and OPCs.
Figure 6.
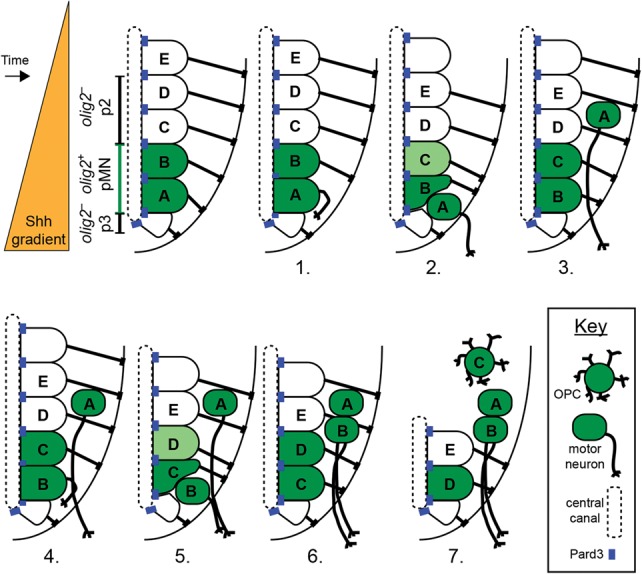
Progenitor recruitment model. Individual panels portray changes in the ventral spinal cord during motor neuron and OPC specification. Initially, a Shh morphogen gradient patterns the ventral neural tube to form the ventral progenitor domains. olig2+ pMN (green) and olig2− p2 and p3 domains (white) are depicted. (Panels 1–5) Next, the most ventral pMN progenitors, schematically represented by cell A followed by cell B, differentiate as motor neurons without dividing. (Panels 2–6) As motor neurons evacuate the ventral spinal cord, more dorsally positioned neuroepithelial progenitors, represented by cell C followed by cell D, move ventrally within the Shh gradient and initiate olig2 expression. (Panel 7) Recruited progenitors give rise to OPCs.
In mouse and chick embryos, different spinal cord progenitor domains grow to distinct sizes because the cells within them differentiate at dissimilar rates (Kicheva et al. 2014). In particular, the differentiation rate of pMN progenitors peaks at the time of motor neuron development, preceding the differentiation peak of more dorsal progenitor domains (Kicheva et al. 2014). Could progenitor recruitment from more dorsal populations maintain the pMN domains of rodents and birds past the peak of differentiation? Individual neural cells and neural explants can change domain identity if culture conditions are altered (Gabay et al. 2003; Dessaud et al. 2010), consistent with a requirement that recruited progenitors change domain identity as they move ventrally. In mice, some progeny of Dbx1-expressing progenitors occupied the pMN domain and expressed Olig2 (Dessaud et al. 2010). This result was interpreted to mean that ventral spinal cord progenitors transiently express Dbx1. Our results now raise the possibility that, instead, progenitors that originate within the Dbx1+ p0 domain of mice move ventrally to contribute to the pMN domain. In mice programmed to express a cell-lethal toxin in Olig1:Cre+ pMN progenitors, Olig2+ progenitors were maintained despite loss of most motor neurons and all OPCs (Wu et al. 2006). The investigators of this study speculated that Olig2+ progenitors were regenerated by a resident Olig2− pMN progenitor and proposed a sequential specification model similar to models proposed for Drosophila neuroblasts (Isshiki et al. 2001) and retinal progenitors (Cepko et al. 1996). However, few, if any, Olig2− cells occupy the pMN domain (Mukouyama et al. 2006). Our data now raise the possibility that Olig2+ progenitors are replaced following pMN cell ablation by recruitment of more dorsal progenitors that initiate Olig2 expression following ventral movement.
A basic requirement of progenitor cell populations is that progenitors both are maintained to prevent premature depletion and differentiate as distinct cell types on schedule. This requirement can be filled by mechanisms that guide progenitors through asymmetric, self-renewing divisions. Our results now indicate that not all progenitor populations are self-sustaining. Instead, populations that undergo peak differentiation early in neural development can be maintained by recruiting nearby progenitors. Progenitor recruitment exposes progenitors to similar instructive signals at different times, thereby providing a mechanistic basis for the neuron-to-glia fate switch characteristic of vertebrate neural development.
Materials and methods
Zebrafish strains and husbandry
The University of Colorado Anschutz Medical Campus Institutional Animal Care and Use Committee approved all zebrafish studies. Embryos were raised at 28.5°C in E3 medium (5 mM NaCl, 0.17 mM KCl, 0.33 mM CaCl, 0.33 mM MgSO4 at pH 7.4, with sodium bicarbonate) and staged according to hours post-fertilization and morphological criteria (Kimmel et al. 1995). Transgenic alleles included Tg(olig2:eGFP)vu12 (Shin et al. 2003), Tg(olig2:Kaede)vu85 (Zannino and Appel 2009), Tg(dbx1b:Cre)nns13a (Satou et al. 2012), Tg(ubi:Zebrabow)a132Tg (Pan et al. 2013), and Tg(dbx1b:GFP)nns11Tg (Satou et al. 2012).
mRNA synthesis and microinjection
mRNAs for dsRed2nuc (Clontech) and H2B-RFP (gift from Alex Schier) were synthesized with the mMessage mMachine kit (Ambion) using the manufacturer's protocol and using linearized plasmids as templates. mRNAs were injected at 250 ng/µL in a final solution of 0.2 M KCl with phenol red at the one-cell stage, at 1- to 3-nL volumes.
Time-lapse imaging and cell tracking
Confocal time-lapse imaging was carried out by embedding embryos in 0.6% low-melting-point agarose (IBI Scientific) with 6% tricaine (Sigma) and viewing the spinal cord in the transverse planes using a 20× (NA 0.8), 40× oil immersion (NA 1.3), or 40× long-working-distance water immersion (NA 1.1) objective. Embryos were maintained at 28.5°C in a heated stage chamber, and z-stacks were collected at variable intervals, usually starting at 24 hpf and continuing through to 48 hpf. Images were taken using a Zeiss Axiovert 200 microscope equipped with a spinning disk confocal system (PerkinElmer Improvision). Image brightness and contrast were adjusted in Volocity (PerkinElmer) or ImageJ (National Institutes of Health). For comparison purposes, the same adjustment was applied to all images. Time-lapse videos were exported from Volocity as extended z-projection TIFF images. We used ImageJ to rotate, crop, and translate in order to correct for x–y drift. Image stacks were then exported in QuickTime (.MOV) format. Individual cells were tracked by following nuclei labeled with either H2B-RFP or dsRed2nuc at each time point after image acquisition. Transgene expression, dorsoventral position, and cell morphology were noted for each cell at the beginning and end of each image series.
Immunohistochemistry
Embryos were manually dechorionated and fixed overnight in 4% paraformaldehyde in PBST (0.1% Tween-20). Twenty-micrometer cryosections were used for immunohistochemistry with rabbit anti-GFP (1:100; Invitrogen, A11122), mouse anti-Nkx6.1 (1:500; Developmental Studies Hybridoma Bank, F55A12), goat anti-rabbit Alexa fluor488 (1:200; Invitrogen), or goat anti-mouse Alexa fluor568 (1:200; Invitrogen). ubi:Zebrabow embryos were processed for immunohistochemistry following antigen retrieval (20 min at 98°C in citrate buffer [10 mM sodium citrate, 0.05% tween-20 at pH 6.0]) to eliminate broad-spectrum fluorescence produced by the transgenic prior to antibody labeling.
Kaede photoconversion
olig2:Kaede transgenic embryos were illuminated with UV light from a mercury bulb source for 30–120 sec following manual dechorionation or for 10 sec with a 405-nm laser (20% power) on a spinning disk confocal microscope. Immediately afterward, photoconversion was confirmed by observation of the presence of red fluorescence and an absence of green fluorescence. Photoconverted embryos were then kept at 28.5°C in the dark until imaging.
Quantitative and statistical methods
Quantifications were performed by collecting confocal z-stacks of entire embryos and counting cells from maximally projected images. Z images were examined to distinguish between individual cells. We plotted all data and performed all statistical analyses in Microsoft Excel. All data are expressed as mean ± SEM. For statistical analysis, we used Student's two-tailed t-test for all data with normal distributions. Unless otherwise noted, statistical significance is indicated as follows: P < 0.05 (*), P < 0.01 (**), and P < 0.001 (***).
Drug treatments
For Smoothened inhibitor assays, cyclopamine (Cayman Chemical, 11321) was reconstituted in ethanol to make a 10 mM stock and stored at −20°C. Embryos were treated at 24 hpf with 1 or 5 µM cyclopamine or an equal volume of ethanol alone for a vehicle control in E3 medium.
Supplementary Material
Acknowledgments
We thank members of the Appel laboratory for valuable discussions, Santos Franco for comments on the manuscript, and Christina Kearns for help with sectioning and antibody staining. We are grateful for the gifts of the H2B-RFP plasmid and the Tg(ubi:Zebrabow)a132Tg line from Alex Schier, the CMV:Pard3-GFP plasmid from Jon Clarke, and the actb2:mCherry construct from Ken Poss. The mouse anti-Nkx6.1 (1:500; Developmental Studies Hybridoma Bank F55A12), developed by Ole D. Madsen, was obtained from the Developmental Studies Hybridoma Bank, created by the National Institute of Child Health and Human Development of the National Institutes of Health and maintained at The University of Iowa Department of Biology. This work was supported by National Institutes of Health grant R01 NS40660 and a gift to B.A. from the Gates Frontiers Fund. A.M.R. was supported by the National Institutes of Health (National Cancer Institute) T32 5T32CA08208613 Fellowship. The University of Colorado Anschutz Medical Campus Zebrafish Core Facility was supported by National Institutes of Health grant P30 NS048154. A.M.R. performed all experiments and conducted analyses of the data. A.M.R. and B.A. conceived the project and wrote the manuscript.
Footnotes
Supplemental material is available for this article.
Article published online ahead of print. Article and publication date are online at http://www.genesdev.org/cgi/doi/10.1101/gad.271312.115.
References
- Bayraktar OA, Doe CQ. 2013. Combinatorial temporal patterning in progenitors expands neural diversity. Nature 498: 449–55. [DOI] [PMC free article] [PubMed] [Google Scholar]
- Bossing T, Udolph G, Doe CQ, Technau GM, Schmidt H, Rickert C, Bossing T, Vef O, Urban J, Technau GM. 1997. The embryonic central nervous system lineages of Drosophila melanogaster. II. Neuroblast lineages derived from the dorsal part of the neuroectoderm. Dev Biol 189: 186–204. [DOI] [PubMed] [Google Scholar]
- Briscoe J, Ericson J. 1999. The specification of neuronal identity by graded Sonic hedgehog signalling. Semin Cell Dev Biol 10: 353–362. [DOI] [PubMed] [Google Scholar]
- Cai J, Qi Y, Hu X, Tan M, Liu Z, Zhang J, Li Q, Sander M, Qiu M. 2005. Generation of oligodendrocyte precursor cells from mouse dorsal spinal cord independent of Nkx6 regulation and Shh signaling. Neuron 45: 41–53. [DOI] [PubMed] [Google Scholar]
- Cepko CL, Austin CP, Yang X, Alexiades M, Ezzeddine D. 1996. Cell fate determination in the vertebrate retina. Proc Natl Acad Sci 93: 589–595. [DOI] [PMC free article] [PubMed] [Google Scholar]
- Chambers CB, Peng Y, Nguyen H, Gaiano N, Fishell G, Nye JS. 2001. Spatiotemporal selectivity of response to Notch1 signals in mammalian forebrain precursors. Development 128: 689–702. [DOI] [PubMed] [Google Scholar]
- Cleary MD. 2006. Regulation of neuroblast competence: multiple temporal identity factors specify distinct neuronal fates within a single early competence window. Genes Dev 20: 429–434. [DOI] [PMC free article] [PubMed] [Google Scholar]
- Davis A, Temple S. 1994. A self-renewing multipotential stem cell in embryonic rat cerebral cortex. Nature 372: 263–266. [DOI] [PubMed] [Google Scholar]
- Deneen B, Ho R, Lukaszewicz A, Hochstim CJ, Gronostajski RM, Anderson DJ. 2006. The transcription factor NFIA controls the onset of gliogenesis in the developing spinal cord. Neuron 52: 953–968. [DOI] [PubMed] [Google Scholar]
- Dessaud E, Ribes V, Balaskas N, Yang LL, Pierani A, Kicheva A, Novitch BG, Briscoe J, Sasai N. 2010. Dynamic assignment and maintenance of positional identity in the ventral neural tube by the morphogen Sonic hedgehog. PLoS Biol 8: e1000382. [DOI] [PMC free article] [PubMed] [Google Scholar]
- Fogarty M, Richardson WD, Kessaris N. 2005. A subset of oligodendrocytes generated from radial glia in the dorsal spinal cord. Development 132: 1951–1959. [DOI] [PubMed] [Google Scholar]
- Gabay L, Lowell S, Rubin LL, Anderson DJ. 2003. Deregulation of dorsoventral patterning by FGF confers trilineage differentiation capacity on CNS stem cells in vitro. Neuron 40: 485–499. [DOI] [PubMed] [Google Scholar]
- Gaiano N, Nye JS, Fishell G. 2000. Radial glial identity is promoted by Notch1 signaling in the murine forebrain. Neuron 26: 395–404. [DOI] [PubMed] [Google Scholar]
- Grove EA, Williams BP, Li DQ, Hajihosseini M, Friedrich A, Price J. 1993. Multiple restricted lineages in the embryonic rat cerebral cortex. Development 117: 553–561. [DOI] [PubMed] [Google Scholar]
- Huang P, Xiong F, Megason SG, Schier AF. 2012. Attenuation of Notch and hedgehog signaling is required for fate specification in the spinal cord. PLoS Genet 8: e1002762. [DOI] [PMC free article] [PubMed] [Google Scholar]
- Isshiki T, Pearson B, Holbrook S, Doe CQ. 2001. Drosophila neuroblasts sequentially express transcription factors which specify the temporal identity of their neuronal progeny. Cell 106: 511–521. [DOI] [PubMed] [Google Scholar]
- Kalyani A, Hobson K, Rao MS. 1997. Neuroepithelial stem cells from the embryonic spinal cord: isolation, characterization, and clonal analysis. Dev Biol 186: 202–223. [DOI] [PubMed] [Google Scholar]
- Kang P, Lee HK, Glasgow SM, Finley M, Donti T, Gaber ZB, Graham BH, Foster AE, Novitch BG, Gronostajski RM, et al. 2012. Sox9 and NFIA coordinate a transcriptional regulatory cascade during the initiation of gliogenesis. Neuron 74: 79–94. [DOI] [PMC free article] [PubMed] [Google Scholar]
- Kao C-F, Yu H-H, He Y, Kao J-C, Lee T. 2012. Hierarchical deployment of factors regulating temporal fate in a diverse neuronal lineage of the Drosophila central brain. Neuron 73: 677–684. [DOI] [PMC free article] [PubMed] [Google Scholar]
- Kicheva A, Bollenbach T, Ribeiro A, Valle HP, Lovell-Badge R, Episkopou V, Briscoe J. 2014. Coordination of progenitor specification and growth in mouse and chick spinal cord. Science 24: 1411. [DOI] [PMC free article] [PubMed] [Google Scholar]
- Kimmel CB, Ballard WW, Kimmel SR, Ullmann B, Schilling TF. 1995. Stages of embryonic development of the zebrafish. Dev Dyn 203: 253–310. [DOI] [PubMed] [Google Scholar]
- Kong JH, Yang L, Dessaud E, Chuang K, Moore DM, Rohatgi R, Briscoe J, Novitch BG. 2015. Notch activity modulates the responsiveness of neural progenitors to Sonic hedgehog signaling. Dev Cell 33: 373–387. [DOI] [PMC free article] [PubMed] [Google Scholar]
- Leber SM, Sanes JR. 1995. Migratory paths of neurons and glia in the embryonic chick spinal cord. J Neurosci 15: 1236–1248. [DOI] [PMC free article] [PubMed] [Google Scholar]
- Leber M, Breedlove SM, Sanes J. 1990. Lineage, arrangement, and death of clonally related motoneurons in chick spinal cord. J Neurosci 10: 2451–2462. [DOI] [PMC free article] [PubMed] [Google Scholar]
- Li H, Paes de Faria J, Andrew P, Nitarska J, Richardson WD. 2011. Phosphorylation regulates OLIG2 cofactor choice and the motor neuron-oligodendrocyte fate switch. Neuron 69: 918–929. [DOI] [PMC free article] [PubMed] [Google Scholar]
- Liu Y, Rao M. 2003. Oligodendrocytes, GRPs and MNOPs. Trends Neurosci 26: 410–412. [DOI] [PubMed] [Google Scholar]
- Lu QR, Sun T, Zhu Z, Ma N, Garcia M, Stiles CD, Rowitch DH. 2002. Common developmental requirement for Olig function indicates a motor neuron/oligodendrocyte connection. Cell 109: 75–86. [DOI] [PubMed] [Google Scholar]
- Luskin MB, Pearlman AL, Sanes JR. 1988. Cell lineage in the cerebral cortex of the mouse studied in vivo and in vitro with a recombinant retrovirus. Neuron 1: 635–647. [DOI] [PubMed] [Google Scholar]
- Luskin MB, Parnavelas JG, Barfield JA. 1993. Neurons, astrocytes, and oligodendrocytes of the rat cerebral cortex originate from separate progenitor cells: an ultrastructural analysis of clonally related cells. J Neurosci 13: 1730–1750. [DOI] [PMC free article] [PubMed] [Google Scholar]
- McCarthy M, Turnbull DH, Walsh CA, Fishell G. 2001. Telencephalic neural progenitors appear to be restricted to regional and glial fates before the onset of neurogenesis. J Neurosci 21: 6772–6781. [DOI] [PMC free article] [PubMed] [Google Scholar]
- Mukouyama Y, Deneen B, Lukaszewicz A, Novitch BG, Wichterle H, Jessell TM, Anderson DJ. 2006. Olig2+ neuroepithelial motoneuron progenitors are not multipotent stem cells in vivo. Proc Natl Acad Sci 103: 1551–1556. [DOI] [PMC free article] [PubMed] [Google Scholar]
- Noll E, Miller RH. 1993. Oligodendrocyte precursors originate at the ventral ventricular zone dorsal to the ventral midline region in the embryonic rat spinal cord. Development 118: 563–573. [DOI] [PubMed] [Google Scholar]
- Orentas DM, Hayes JE, Dyer KL, Miller RH. 1999. Sonic hedgehog signaling is required during the appearance of spinal cord oligodendrocyte precursors. Development 126: 2419–2429. [DOI] [PubMed] [Google Scholar]
- Pan YA, Freundlich T, Weissman TA, Schoppik D, Wang XC, Zimmerman S, Ciruna B, Sanes JR, Lichtman JW, Schier AF. 2013. Zebrabow: multispectral cell labeling for cell tracing and lineage analysis in zebrafish. Development 140: 2835–2846. [DOI] [PMC free article] [PubMed] [Google Scholar]
- Park H-C, Appel B. 2003. Delta–Notch signaling regulates oligodendrocyte specification. Development 130: 3747–3755. [DOI] [PubMed] [Google Scholar]
- Park H-C, Mehta A, Richardson JS, Appel B. 2002. Olig2 is required for zebrafish primary motor neuron and oligodendrocyte development. Dev Biol 248: 356–368. [DOI] [PubMed] [Google Scholar]
- Park H-C, Shin J, Appel B. 2004. Spatial and temporal regulation of ventral spinal cord precursor specification by Hedgehog signaling. Development 131: 5959–5969. [DOI] [PubMed] [Google Scholar]
- Pringle NP, Richardson WD. 1993. A singularity of PDGF α-receptor expression in the dorsoventral axis of the neural tube may define the origin of the oligodendrocyte lineage. Development 117: 525–533. [DOI] [PubMed] [Google Scholar]
- Pringle NP, Yu WP, Guthrie S, Roelink H, Lumsden A, Peterson AC, Richardson WD. 1996. Determination of neuroepithelial cell fate: induction of the oligodendrocyte lineage by ventral midline cells and sonic hedgehog. Dev Biol 177: 30–42. [DOI] [PubMed] [Google Scholar]
- Qian X, Goderie SK, Shen Q, Stern JH, Temple S. 1998. Intrinsic programs of patterned cell lineages in isolated vertebrate CNS ventricular zone cells. Development 125: 3143–3152. [DOI] [PubMed] [Google Scholar]
- Qian X, Shen Q, Goderie SK, He W, Capela A, Davis AA, Temple S. 2000. Timing of CNS cell generation: a programmed sequence of neuron and glial cell production from isolated murine cortical stem cells. Neuron 28: 69–80. [DOI] [PubMed] [Google Scholar]
- Reynolds BA, Tetzlaff W, Weiss S. 1992. A multipotent EGF-responsive striatal embryonic progenitor cell produces neurons and astrocytes. J Neurosci 12: 4565–4574. [DOI] [PMC free article] [PubMed] [Google Scholar]
- Rowitch DH. 2004. Glial specification in the vertebrate neural tube. Nat Rev Neurosci 5: 409–419. [DOI] [PubMed] [Google Scholar]
- Satou C, Kimura Y, Higashijima S-i. 2012. Generation of multiple classes of V0 neurons in zebrafish spinal cord: progenitor heterogeneity and temporal control of neuronal diversity. J Neurosci 32: 1771–1783. [DOI] [PMC free article] [PubMed] [Google Scholar]
- Schmid A, Chiba A, Doe CQ. 1999. Clonal analysis of Drosophila embryonic neuroblasts: neural cell types, axon projections and muscle targets. Development 126: 4653–4689. [DOI] [PubMed] [Google Scholar]
- Shin J, Park HC, Topczewska JM, Madwsley DJ, Appel B. 2003. Neural cell fate analysis in zebrafish using olig2 BAC transgenics. Methods Cell Sci 25: 7–14. [DOI] [PubMed] [Google Scholar]
- Simpson P. 1997. Notch signalling in development: on equivalence groups and asymmetric developmental potential. Curr Opin Genet Dev 7: 537–542. [DOI] [PubMed] [Google Scholar]
- Stasiulewicz M, Gray S, Mastromina I, Silva JC, Bjorklund M, Seymour PA, Booth D, Thompson C, Green R, Hall EA, et al. 2015. A conserved role for Notch in priming the cellular response to Shh through ciliary localisation of the key Shh transducer, Smo. Development 142: 2291–2303. [DOI] [PMC free article] [PubMed] [Google Scholar]
- Stolt CC. 2003. The Sox9 transcription factor determines glial fate choice in the developing spinal cord. Genes Dev 17: 1677–1689. [DOI] [PMC free article] [PubMed] [Google Scholar]
- Takebayashi H, Nabeshima YI, Yoshida S, Chisaka O, Ikenaka K, Nabeshima YI. 2002. The basic helix–loop–helix factor Olig2 is essential for the development of motoneuron and oligodendrocyte lineages. Curr Biol 12: 1157–1163. [DOI] [PubMed] [Google Scholar]
- Tawk M, Araya C, Lyons DA, Reugels AM, Girdler GC, Bayley PR, Hyde DR, Tada M, Clarke JDW. 2007. A mirror-symmetric cell division that orchestrates neuroepithelial morphogenesis. Nature 446: 797–800. [DOI] [PubMed] [Google Scholar]
- Temple S. 1989. Division and differentiation of isolated CNS blast cells in microculture. Nature 340: 471–473. [DOI] [PubMed] [Google Scholar]
- Timsit S, Martinez S, Allinquant B, Peyron F, Puelles L, Zalc B. 1995. Oligodendrocytes originate in a restricted zone of the embryonic ventral neural tube defined by DM-20 mRNA expression. J Neurosci 15: 1012–1024. [DOI] [PMC free article] [PubMed] [Google Scholar]
- Vallstedt A, Klos JM, Ericson J. 2005. Multiple dorsoventral origins of oligodendrocyte generation in the spinal cord and hindbrain. Neuron 45: 55–67. [DOI] [PubMed] [Google Scholar]
- Warf BC, Fok-Seang J, Miller RH. 1991. Evidence for the ventral origin of oligodendrocyte precursors in the rat spinal cord. J Neurosci 11: 2477–2488. [DOI] [PMC free article] [PubMed] [Google Scholar]
- Wu S, Wu Y, Capecchi MR. 2006. Motoneurons and oligodendrocytes are sequentially generated from neural stem cells but do not appear to share common lineage-restricted progenitors in vivo. Development 133: 581–590. [DOI] [PubMed] [Google Scholar]
- Yu WP, Collarini EJ, Pringle NP, Richardson WD. 1994. Embryonic expression of myelin genes: evidence for a focal source of oligodendrocyte precursors in the ventricular zone of the neurol tube. Neuron 12: 1353–1362. [DOI] [PubMed] [Google Scholar]
- Zannino DA, Appel B. 2009. Olig2+ precursors produce abducens motor neurons and oligodendrocytes in the zebrafish hindbrain. J Neurosci 29: 2322–2333. [DOI] [PMC free article] [PubMed] [Google Scholar]
- Zhou Q, Choi G, Anderson DJ. 2001. The bHLH transcription factor Olig2 promotes oligodendrocyte differentiation in collaboration with Nkx2.2. Neuron 31: 791–807. [DOI] [PubMed] [Google Scholar]
- Zhou Q, Anderson DJ, Choi G, Anderson DJ. 2002. The bHLH transcription factors OLIG2 and OLIG1 couple neuronal and glial subtype specification cell fate transformations in Olig1/2 mutant mice results double-mutant mice results in loss of motoneurons. Neuron 109: 61–73. [DOI] [PubMed] [Google Scholar]
Associated Data
This section collects any data citations, data availability statements, or supplementary materials included in this article.