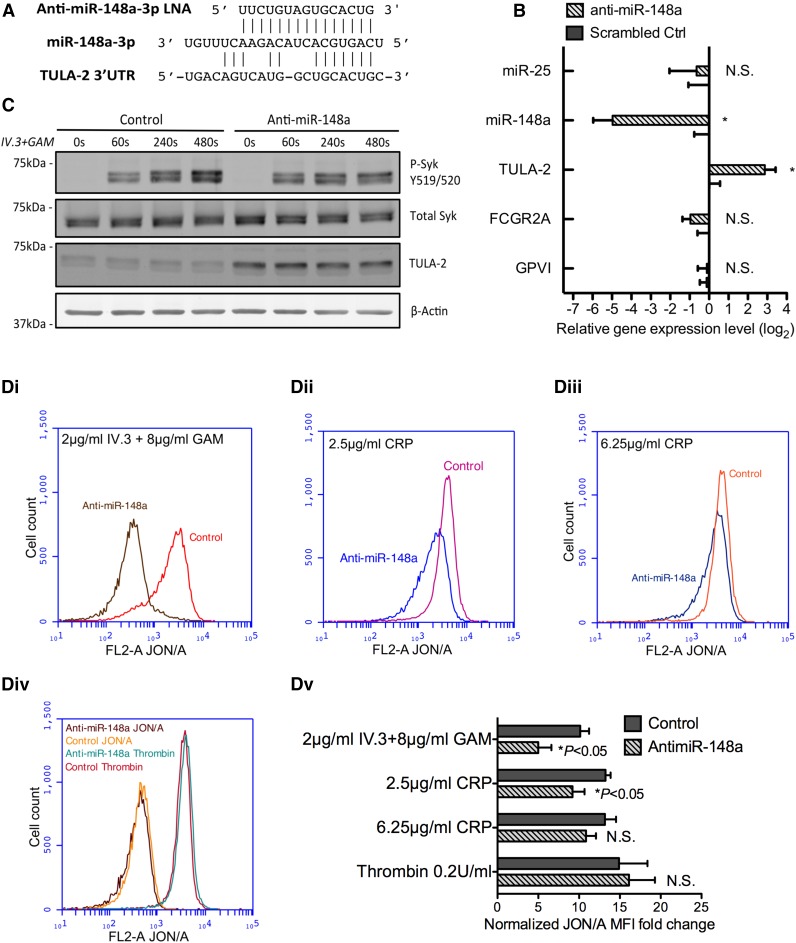
Figure 4.
Anti–miR-148a LNA de-represses TULA-2 expression and inhibits ITAM-Syk signaling in vivo. (A) Sequence of the 15-nucleotide anti–miR-148a-3p LNA used to inhibit mmu-miR-148a-3p in vivo. (B) RNA expression analysis of bone marrow from B6.IIA mice treated with anti–miR-148a LNA or scrambled LNA control by quantitative RT-PCR. Plots represent 4 anti–miR-148a–treated mice and 4 scrambled LNA-treated mice. Fold change on the y-axis is plotted as log2 value. miRNA expression was normalized to mouse let-7 miRNA, and TULA-2, FcγRIIA, and GPVI mRNA was normalized to mouse β-actin. miR-148a was significantly decreased by LNA, whereas TULA-2 mRNA expression was upregulated significantly (n = 4, *P < .05 for TULA-2, **P < .005 for miR-148a). (C) P-Syk Y519/520, TULA-2, and mouse β-actin protein expression in murine platelet lysates was detected by immunoblotting (representative of 3 experiments). Mice were treated with control or anti–miR-148a. (D) Washed anti–miR-148a or control-treated platelets were incubated with JON/A alone or indicated concentration of agonists for 10 minutes followed by measurement of JON/A binding (integrin activation) by flow cytometry. All traces are representative of ≥3 independent experiments. Varying concentration of agonists include the following: (Di) 2 µg/mL IV.3 + 8 µg/mL GAM; (Dii) 2.5 µg/mL CRP; (Diii) 6.25 µg/mL CRP; (Div) JON/A only or JON/A plus 0.1 U/mL thrombin; and (Dv) quantification of mean fluorescent intensity fold change (Student t test, n = 5). Mean fluorescent intensity of JON/A-PE and agonists were normalized to background signal of platelets with JON/A-PE alone.

