Abstract
A microstructure model has been applied to simulate near-surface degradation of portland cement paste in contact with a sodium sulfate solution. This new model uses thermodynamic equilibrium calculations to guide both compositional and microstructure changes. It predicts localized deformation and the onset of damage by coupling the confined growth of new solids with linear thermoelastic finite element calculations of stress and strain fields. Constrained ettringite growth happens primarily at the expense of calcium monosulfoaluminate, carboaluminate and aluminum-rich hydrotalcite, if any, respectively. Expansion and damage can be mitigated chemically by increasing carbonate and magnesium concentrations or microstructurally by inducing a finer dispersion of monosulfate.
Keywords: cement paste, sulfate attack, microstructure, computer modeling, expansion, degradation
1. Introduction
The degradation of cementitious materials by external sulfate attack is one of the most frequently cited causes of service life reduction of concrete structures. The importance of sulfate attack is attested by the multitude of experimental and theoretical studies on its origin and manifestations that have been published just in the last decade [1–22]. Such investigations have consistently indicated that sulfate attack is a complicated, multiscale and multiphysics process involving the coupling of physical, chemical, and mechanical interactions.
The formation of ettringite [23–25] and sometimes gypsum [26] are usually thought to be responsible for significant volumetric expansion and structural damage during sulfate attack. Several of the proposed mechanisms of ettringite-related expansion (e.g., solid state conversion [27, 28], volume increase [29], colloidal swelling [30]) often do not match experimental observations and measurements [15, 21]. More recently, crystallization pressure theory has shown that stress exerted on pore walls by impingement of growing crystals is significant only in confined spaces and when the surrounding solution is highly supersaturated with respect to those crystals [31–33]. Accordingly, macroscopic stress during sulfate attack is determined more by the locations of active ettringite growth in the microstructure rather than the total volume of ettringite formed [18, 21]. That is, the origin and extent of sulfate-induced expansion is the transformation to ettringite of AFm phases that are dispersed within the fine porosity of C–S–H gel [15].
Various approaches have been used to simulate the effects of sulfate attack. A multiionic transport model [34] has been used to simulate the evo- lution of mineral phases in cement-based materials exposed to aggressive environments such as sulfate solution [35, 36]. Infilling of capillary porosity by precipitated solids and the resulting displacement of liquid from the material has been simulated by a finite-difference approach for nonsteady-state diffusion and reaction of ions in cementitious composites [10, 37]. Other reaction-diffusion models have been applied to the corrosion of building materials subjected to sulfate attack [38], although models of this kind require knowledge of the transport properties and porosity within the material. Expansion and damage have been simulated using continuum damage mechanics at the millimeter length scale [4, 5, 9, 16, 17]. In particular, the finite element model developed by Idiart [17] simulates the millimeter-scale distribution of ettringite and development of expansion cracks around aggregates embedded within an homogenized cementitious binder.
Modeling of sulfate attack at the scale of the cementitious binder microstructure has not been reported, but nevertheless could be valuable for deepening our understanding of the origin and mechanisms of sulfate-induced degradation. In this paper, we report a first step in this direction. A thermodynamic-microstructural model of hydration [39] is coupled to a linear thermoelastic finite element model [40] to simulate microstructural evolution by external sulfate attack and to track the microscopic stress field that develops by constrained ettringite growth in the binder porosity. The model is applied here to simulate near-surface sulfate attack of Type I ordinary portland cement binder in a sodium sulfate solution. We also investigate the sensitivity of the model predictions to the spatial distribution of aluminate-bearing phases in the microstructure. Finally, the model is used to simulate and compare the differences in the progress of sulfate attack among three types of cement having different aluminate contents.
2. Model Description and Technique
2.1. Simulating hydration
The model used here is an extension of the Thermodynamic Hydration and Microstructure Evolution (THAMES) model recently developed at the National Institute of Standards and Technology (NIST) [39]. THAMES has three main components: (1) a kinetic model of cement clinker phase dissolution, which determines the time dependence of elemental concentrations in the pore solution [41]; (2) thermodynamic speciation calculations to determine the equilibrium composition and abundance of phases other than clinker minerals, including the pore solution [42–44]; and (3) a 3D digital image model for spatially distributing these various phases to represent the microstructure of the binder. Full details about how these three components work together is provided elsewhere [39, 45]. Briefly, each a 1 μm3 of space is represented by a voxel in the microstructure having an integer identifier unique to the phase occupying that volume. Each voxel sharing one or more faces with a different phase is identified as an “interface” voxel and stored in lists of sites eligible for dissolution or growth of that phase. The list members are evaluated for their potential to dissolve or grow, respectively, by assigning an “affinity” at each interface voxel that characterizes the relative tendency of a given phase to grow in the environment at that site. A negative affinity between two phases means that increases in the interface between them is unfavorable, while a positive affinity between to phases tends to promote the increase of that interface. This concept of affinity does not have any well-defined thermodynamic significance in terms of crystal growth theory, but is used merely as a convenience to generate different growth morphologies. In the future, it may be possible to establish a stronger link between the affinities and physical parameters such as interfacial energy and growth mobility of interfaces as a function of orientation. Consistent with the observations of Schmidt and coworkers [15], we assume that the transformation to ettringite of aluminate-bearing phases that are finely dispersed within C–S–H give rise to stress fields that are responsible for expansion. Therefore, we adopt affinity values that promote the fine intergrowth with C–S–H of calcium monosulfoaluminate (hereafter called monosulfate), calcium mono- and hemicarboaluminate (hereafter called monocarbonate and hemicarbonate, respectively), and hydrotalcite.
2.2. Simulating interaction with Na2SO4
Hydration was stopped at 100 d of hydration and the simulation of sulfate attack was started. 100 d of hydration was chosen arbitrarily, but we note that the degree of hydration at this time is 0.90, based on mass of clinker consumed, so further hydration happens quite slowly. Therefore, ignoring further hydration from that point is likely a good approximation. The simulation begins by flushing the capillary pore volume with a 0.1 mol kg−1 Na2SO4 solution, using an algorithm reported recently [45]. The total mass of water in the aqueous solution phase is first retrieved from the current equilibrium state, together with the molal concentrations of the primary solute species and [Na+]. From these data, calculations are made of the number of moles of each of these ions that must be added to, or re- moved from, the solution to increase or decrease, respectively, their molal concentration to prescribed initial values prior to each cycle's equilibration step. [K+] and [Ca2+] were also set in the same manner to 0.5 mmol kg−1 and 0.1 μmol kg−1, respectively, prior to equilibration, a minimum value chosen to avoid numerical instabilities in the thermodynamic calculations while still enabling the process of calcium leaching which is observed in sulfate attack experiments [47, 48].
The thermodynamic system is re-equilibrated with the newly flushed sulfate solution. Phase transformations are assumed to be dictated by thermodynamic equilibrium between the solid phases and solution, altering both the solution speciation and the volumes of different solid phases. The microstructure is updated according to the aforementioned rules, adding or subtracting voxels of each phase corresponding to that phase's net volume fraction change. The model repeats the process of flushing, re-equilibration, and microstructure updates. The physical time associated with each of these flushing cycles would be determined by (1) the time required to exchange the pore solution with fresh solution, and (2) the time required for the fresh solution to reach equilibrium with the remaining solids. Either of these processes could, in principle, control the time scale of a given flushing cycle. In typical experiments on sulfate attack, the specimen is submerged in a sulfate solution of fixed composition, so solute diffusion from the interior capillary pore space probably controls the rate of degradation everywhere except very near the exterior surface, where the rate is likely controlled by mineral dissolution or growth. The present study does not attempt to capture the complexities of diffusion-controlled solute migration to the interior of the specimen. Instead, our purpose is to explore the overall course of early degradation at the specimen surface (i.e., the first 100 μm layer) in terms of microstructure development, expansion, and the onset of damage. With this microstructure modeling capability established, a subsequent study will explore microstructure development and expansion as a function of depth by coupling the thermodynamic-microstructure model to a reaction-diffusion framework similar to that employed by others for modeling at the macroscopic scale [17].
2.3. Elastic strain and stress calculations
Ettringite has a greater molar volume than the aluminate-bearing phases from which it forms, and we assume it to be the only product that causes expansion during sulfate attack. This assumption agrees with previous studies even though no direct relation has been established between the abundance of ettringite and expansion of the sample.
Crystallization pressure theory [32] predicts that stress is exerted on pore walls by crystals formed within confined solutions that are supersaturated with respect to continued growth in bulk solution. Crystallization is therefore thermodynamically favored to happen in larger pores where this pressure is reduced. However, the diffusion of ions can limit the rate at which crystallization happens in larger pores, and significant transient pressure can therefore be generated within fine pores during ettringite growth [33]. Considering the low mobility of aluminate ions, ettringite is assumed in this model to form at the places where aluminum sources dissolve during sulfate attack. However, we are unable to directly model crystallization pressure because (1) the equilibrium bulk thermodynamic assumption of our approach guarantees that the solution is never supersaturated with respect to any solid phase in the microstructure, and (2) the 1 μm spatial resolution of our microstructure model is too coarse to explicitly include the finest pore dimensions within the hydration product where crystallization pressures would be the greatest.
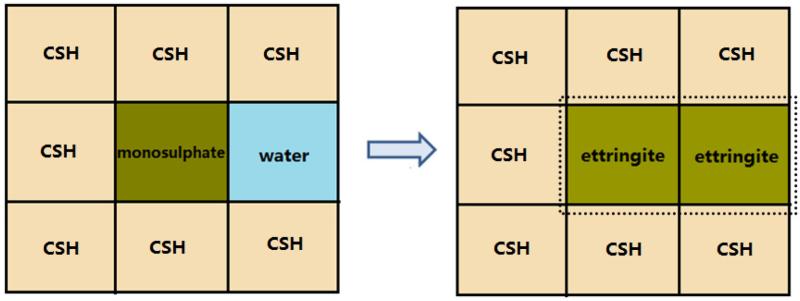
Without explicitly modeling crystallization pressure distribution throughout the microstructure, we approximate the microstress development as resulting from local misfit strains that occur when the stress-free volume change of ettringite is greater than the local volume available for it. For example, consider the local microstructure configuration illustrated in Fig. 1. One voxel of monosulfate is embedded within C–S–H hydration product with only one neighbor of capillary porosity. The reaction of this monosulfate voxel with sulfate solution precipitates ettringite at the same site. The molar volume of ettringite is 1.28 times larger than the molar volume of monosulfate [49], so the reaction of one monosulfate voxel should correspond to the growth of 2.28 voxels of stress-free ettringite. Therefore, if at least two voxels of capillary porosity are adjacent to the reacted monosulfate voxel, we (1) replace the monosulfate voxel with one of ettringite, (2) replace one of the adjacent capillary pore voxels with ettringite, and (3) replace one more adjacent capillary pore voxel with ettringite with a probability of 0.28. However, if fewer than two capillary pore voxels are adjacent to the reacted monosulfate voxel, as depicted in the figure, then the ettringite cannot grow in a stress-free state; instead, a local volumetric strain of ε = −0.28 or ε = −1.28 is assigned to the newly formed ettringite depending on whether there are one or zero adjacent pore voxels, respectively. The negative values mean that ettringite is under a compressive strain. Misfitting ettringite thus expe- riences a compressive (negative) stress exerted on it by its surroundings, and simultaneously exerts a tensile (positive) stress on those surroundings. That is, a heterogeneous stress field exists throughout the microstructure during any given time step.
Figure 1.
Illustration of a local microstructure configuration where monosulfate could transform to ettringite.
This stress field is calculated after the misfit strains have been assigned by coupling the microstructure to a 3D linear thermoelastic finite element (FE) model. The FE calculation is optimized for computing elastic properties of random composite media [40], and uses the full 3D microstructure as input by representing each voxel as a trilinear cubic mesh element. Each element is assigned values for its average isotropic bulk and shear moduli based on Voigt-Reuss-Hill bounds for the phase in that element; values for most cement phases have been generally accepted in the literature and are tabulated in Ref. [50].
The elastic energy, U, of the microstructure with a given microstrain distribution is
| (1) |
where ε is the local strain tensor, C is the stiffness tensor, and e is the local misfit strain tensor. The condition of elastic equilibrium is that U be minimized with respect to the displacement field, which is met if ∂U/∂u = 0 for the displacement vector u evaluated at each node of the finite element mesh. The finite element calculation uses a conjugate gradient method to determine the energy-minimizing displacement field that satisfies the boundary conditions, as detailed in Ref. [40]. The equilibrium displacement field determines the equilibrium strain field according to ε ≡ ∂u/∂x, where x is the position vector. In turn, the equilibrium strain at a point determines the stress tensor at that point according to σ ≡ C : (ε – e). This FE implementation model has been verified by comparison to theoretical results of composite theory [51] and used extensively for random composite media in general [52–54] and for portland cement paste microstructures in particular [50, 55, 56].
The average stress in each voxel is calculated by diagonalizing the stress tensor averaged over the eight FE nodes at the voxel corners. Damage is assumed to occur locally within the microstructure at any voxel where the tensile (positive) stress exceeds a critical value σc(p) that depends on the phase p at the voxel. Clinker phases are assumed to be the most resistant to tensile failure by assigning each a critical tensile strength of σc = 10 MPa. Hydration product phases are each assigned a critical tensile strength based on their elastic moduli. For simplicity, C–S–H, ettringite and hydrotalcite are each tentatively assigned σc = 1 MPa, considering their relatively lower Young's modulus. All other hydrates are assigned σc = 5 MPa, which is close to the typical measured tensile strength of ordinary portland cement paste [57, 58]. If the tensile stress for any voxel exceeds σc, that voxel is designated as “damaged”. This approach provides an indication of regions in the microstructure that are most susceptible to loss of mechanical integrity due to sulfate attack, but it does not capture the development and coalescence of microcrack networks into larger cracks. Any such modeling of fracture would require either a finer and adaptive mesh that could conform to crack walls as they propagate, or an extended finite element method on a regular mesh [59].
Note that this method of coupling FE calculations to microstructure development automatically accounts for the changing effective elastic stiffness of the binder, which influences the amount of expansion obtained for a given induced stress. As a result, this approach has the advantage of simultaneously predicting not only the influence of binder chemistry on the phase evolution during external sulfate attack, but also the influence of chemistry and microstructure on the evolving resistance of the binder to expansion.
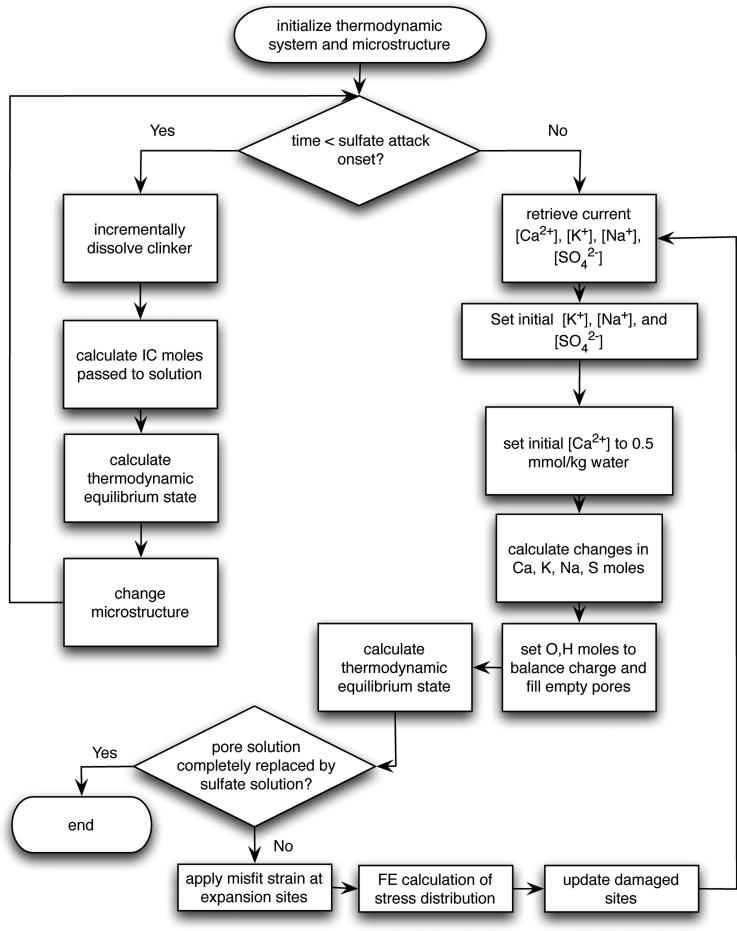
As a summary of the model description given in these sections, Fig. 2 shows an overview of the general algorithm.
Figure 2.
Flowchart of sulfate attack model.
3. Results and discussion
3.1. Evolution of pore solution and solids
A Type I ordinary portland cement (proficiency sample cement 168 from the Cement and Concrete Reference Laboratory and hereafter designated as CCRL 168) is used first. The cement has a fineness of 408 m2/kg ± 10 m2/kg as measured by ASTM C 204 [60], with a median particle size of 13.7 μm as measured by laser scattering from a dilute powder suspension in isopropanol following AASHTO T 353-14 [61]. The mineralogical composition of the cement is shown in Table 1, and is based on average mass fractions obtained using X-ray powder diffraction with Rietveld refinement [39].
Table 1.
Mineralogical composition of the cements used in this study, expressed as mass percent.
| Phase | CCRL 168 | CCRL 140 | White Cement |
|---|---|---|---|
| C3S | 54.5 | 64.7 | 78.3 |
| β-C2S | 15.7 | 16.5 | 10.7 |
| C3A | 8.0 | 5.4 | 2.4 |
| C4AF | 7.0 | 7.7 | 0.9 |
| Bassanite | 2.3 | 2.2 | 3.5 |
| Anhydrite | 0.2 | 1.6 | 0.5 |
| Gypsum | 0.4 | 0.6 | |
| Arcanite | 1.1 | 0.3 | 0.5 |
| Langbeinite | 0.5 | ||
| Aphthitalite | 1.3 | ||
| Periclase | 3.2 | 0.2 | |
| Calcite | 1.1 | 1.3 | |
| Total Al2O3 | 2.1 | 1.7 | 0.5 |
| Present as solid solution in clinker phases | |||
| K2O | 0.325 | 0.320 | 0.217 |
| MgO | 0.775 | 0.855 | 0.762 |
| SO3 | 0.598 | 0.687 | 0.734 |
A 3D digital-image representation of the cement paste microstructure, based on CCRL 168 and with w/c = 0.45, was constructed using the Virtual Cement and Concrete Testing Laboratory (VCCTL) software [62]. Saturated hydration of each paste for 100 d at a fixed temperature of 25 °C was simulated using the methods described in the previous section. The hydrated microstructure was then subjected to the iterative sulfate attack algorithm. The microstructure, solid phase composition, and solution composition were tracked continuously during the simulation.
Before analyzing the predicted evolution of solid phases in the microstructure, note that a number of those phases are not stoichiometric but rather are solid solutions with variable composition. For example, the crystal structure of ettringite can have a fraction of its Al3+ sites substituted by Fe3+ because of their identical charge and similar ionic radii. To account for this, the thermodynamic database models the ettringite phase as a solid solution of two stoichimetric end members, one with 0 % Fe substitution and the other with 100 % Fe substitution. This general interchangeability of Al and Fe is also found in monosulfate, the carboaluminate phases, and in hydrotalcite. Table 2 shows the end member compositions and molar volumes of the aluminum- and iron-bearing hydrates in the thermodynamic database. The partial substitution of iron in these phases can change their relative thermodynamic stabilities in different environments. Therefore, although we do not explicitly plot the time-dependent chemical compositions of these hydrates, we note occasions where dissolved iron has a significant influence on the course of sulfate attack.
Table 2.
Composition and molar volumes of main aluminate and iron components [43]
| Phase | Formula | Vm (10–4 m3) |
|---|---|---|
| Ettringite | Ca6Al2(SO4)3(OH)12 · 26 H2O | 7.070 |
| Fe-ettringite | Ca6Fe2(SO4)3(OH)12 · 26 H2O | 7.176 |
| Monosulfate | Ca4Al2(SO4)(OH)12 · 6 H2O | 3.090 |
| Fe-monosulfate | Ca4Fe2(SO4)(OH)12 · 6 H2O | 3.211 |
| Hemicarbonate | Ca4Al2(CO3)0.5(OH)13 · 5.5 H2O | 2.845 |
| Fe-hemicarbonate | Ca4Fe2(CO3)0.5(OH)13 · 5.5 H2O | 2.965 |
| Monocarbonate | Ca4Al2(CO3)(OH)12 · 5 H2O | 2.620 |
| Fe-monocarbonate | Ca4Fe2(CO3)(OH)12 · 5 H2O | 2.902 |
| Hydrotalcite | Mg4Al2(OH)14 · 3 H2O | 2.202 |
| Fe-hydrotalcite | Mg4Fe2(OH)14 · 3 H2O | 2.324 |
| CO3-hydrotalcite | Mg4Al2(CO3)(OH)12 · 2 H2O | 2.204 |
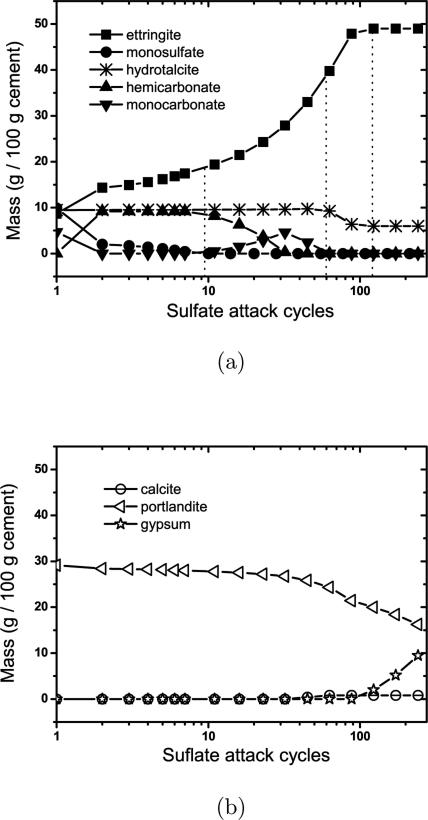
Fig. 3 shows the predicted mass change of solid hydrate phases with progressive sulfate attack of the paste. Ettringite increases significantly from the first introduction of sodium sulfate solution. Closer inspection of Fig. 3(a) indicates that, from the perspective of phase stability, sulfate attack can be roughly divided into four stages:
Stage 1: Growth of ettringite at the expense of monosulfate;
Stage 2: Growth of ettringite at the expense of carboaluminate phases;
Stage 3: Growth of ettringite at the expense of a portion of hydrotalcite; and
Stage 4: Growth of gypsum at the expense of portlandite.
Figure 3.
Predicted mass change with increased flushing cycles for solid phases (a) containing aluminum and (b) without aluminum.
First stage: transformation of monosulfate
Monosulfate dissolves continuously in this stage, being replaced by a greater volume of ettringite. The first stage ends when monosulfate has dissolved completely from the system.
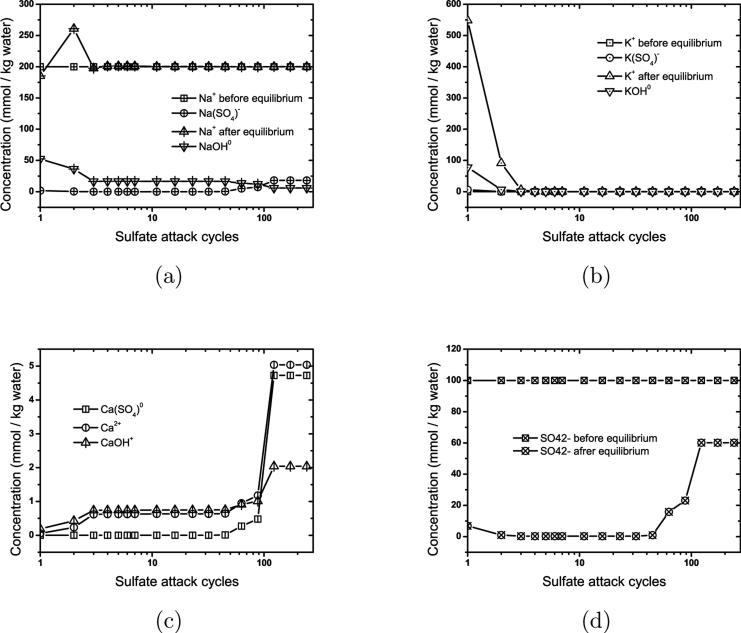
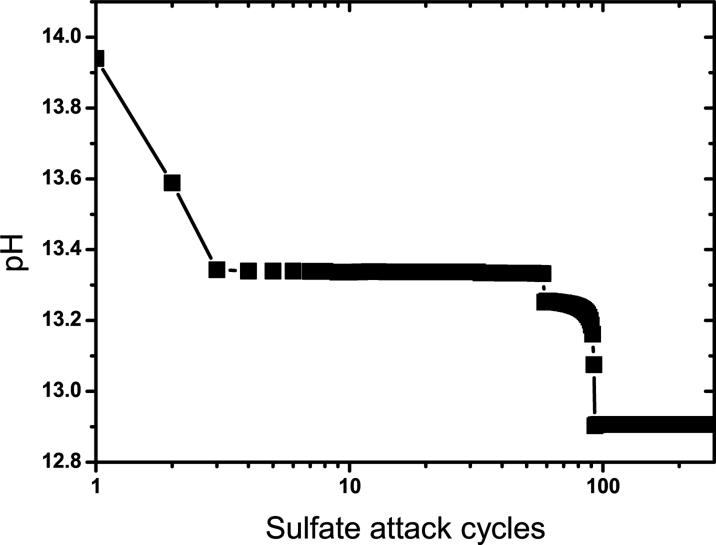
The pore solution at the end of hydration has a lower [Na+] than the external sulfate solution, so exposure to the sulfate solution causes a slight increase in [Na+] in the pore solution, as shown in Fig. 4(a). Conversely, both K+ and OH− are extracted from the pore solution during each solution flushing cycle (Fig. 4(b)), so the pore solution pH decreases mildly with time, especially during the first and second stage, as shown in Fig. 5. Final dissolution of monosulfate is attended by a rapid increase in both ettringite and hemicarbonate, which causes a minor perturbation in both [Na+] and [K+] (Fig. 4). These perturbations occur because the sudden increase in the growth rate of ettringite, each mole of which requires 26 moles of water, significantly reduces the liquid water content in the system.
Figure 4.
Ionic concentrations in the capillary pore solution before and after equilibration with the solids, plotted against the number of flushing cycles.
Figure 5.
Simulated evolution of pore solution pH over the course of prolonged exposure to 0.1 mol kg−1 sodium sulfate solution.
Second stage: transformation of carboaluminates
The second stage begins after monosulfate has been consumed. Transformation of hemicarbonate, partly to ettringite and partly to monocarbonate, characterizes the second stage shown in Fig. 3(a). Monocarbonate is destabilized and begins dissolving when hemicarbonate is consumed, enabling ettringite growth to continue. The second stage ends with the complete dissolution of monocarbonate, at which point small jumps in [Ca2+] and are observed, as shown in Fig. 4(c) and (d).
The relative importance and duration of the second stage depends on the concentration of carbonates in the system, and therefore is expected to increase in importance with service life in environments favoring carbonation. Conversely, binders with little or no limestone content that have been placed in low-CO2 environments may not exhibit this stage at all.
Third stage: transformation of hydrotalcite
Hydrotalcite gradually dissolves in the first two stages, but in the third stage is the only remaining solid that can contribute aluminates to the solution. Therefore, its dissolution is accelerated in the third stage as ettringite continues to grow. In this stage, ettringite grows at a slightly slower rate, leading to the increase of until all the aluminum-bearing hydrotalcite is consumed, after which ettringite growth ceases. Note that some iron-rich hydrotalcite remains in the system because the iron-rich hydrotalcite end member is thermodynamically stable relative to ettringite. Therefore, in CCRL 168, which has a high enough magnesium concentration to form significant quantities of hydrotalcite, the fate of iron is divided between hydrotalcite and ettringite even after prolonged exposure to sulfate solution.
The relative importance of this third stage depends on the concentrations of magnesium available to form hydrotalcite. Systems with dolomitic limestone filler or periclase may therefore exhibit a more prominent third stage than those in which magnesium sources are absent.
Fourth stage: leaching of portlandite
The fourth stage begins when all aluminate and iron sources already described have been transformed to ettringite. Without an aluminate source, ettringite stops growing even as more sulfate enters the system. A sharp increase occurs of both [Ca2+] and . Increasing at this stage is consistent with published experiments [21] and implies that ettringite is able to buffer sulfates only as long as aluminates are available to enable its growth. The increase of [Ca2+], on the other hand, is caused by ongoing dissolution of portlandite (see Fig. 3(b)) as the solution pH continues to decrease by influx of sulfate solution. Both and [Ca2+] increase until the solution becomes saturated with respect to gypsum, and thereafter the growth of gypsum shown in Fig. 3(b) buffers the solution with respect to both ions and their concentrations remain essentially constant until the end of the simulation (Fig. 4)(c) and (d)).
3.2. Gypsum formation
Gypsum is often observed to form on the surface of samples exposed to sodium sulfate solutions, and to progress inward with time as severe cracking and spalling create paths for rapid influx of sulfate solution to the interior [15, 63]. Formation of gypsum on sample surfaces is due to rapid leaching of near-surface portlandite in the low-pH environment of the sulfate bath, which provides calcium to react with free sulfate in solution. Even so, the current near-surface modeling study predicts the formation of gypsum only much later in the simulations, and only after ettringite growth has stopped because all aluminate sources have been consumed (see Fig. 3). One reason for this may be that the simulations do not consider the free solution adjacent to the solid surface, where growth conditions for gypsum may be especially favorable relative to ettringite. Within the solid microstructure, however, ettringite is more thermodynamically favored than gypsum while both aluminates and sulfates are available in the pore solution. In other words, the free energy is lower when all the incoming sulfate can incorporated to grow more ettringite, rather than being divided between ettringite and gypsum. Another way of viewing this is that the existing AFm and AFt phases in the system buffer both calcium and sulfate at quite low concentrations during the first 100 flushing cycles (see Fig. 4), so that the activity product for gypsum is held well below its solubility product. However, we emphasize that this is a thermodynamic prediction. Gypsum could form near the surface, either in the adjacent solution or on the surface itself, if its growth mechanism was fast enough to rapidly consume both leached calcium and incoming sulfates before they could be incorporated within ettringite. Such a scenario seems plausible because the crystal structure of gypsum is considerably simpler than that of ettringite, and fewer dissolved components must be coordinated to form a unit cell of gypsum than one of ettringite.
3.3. Microstructure development
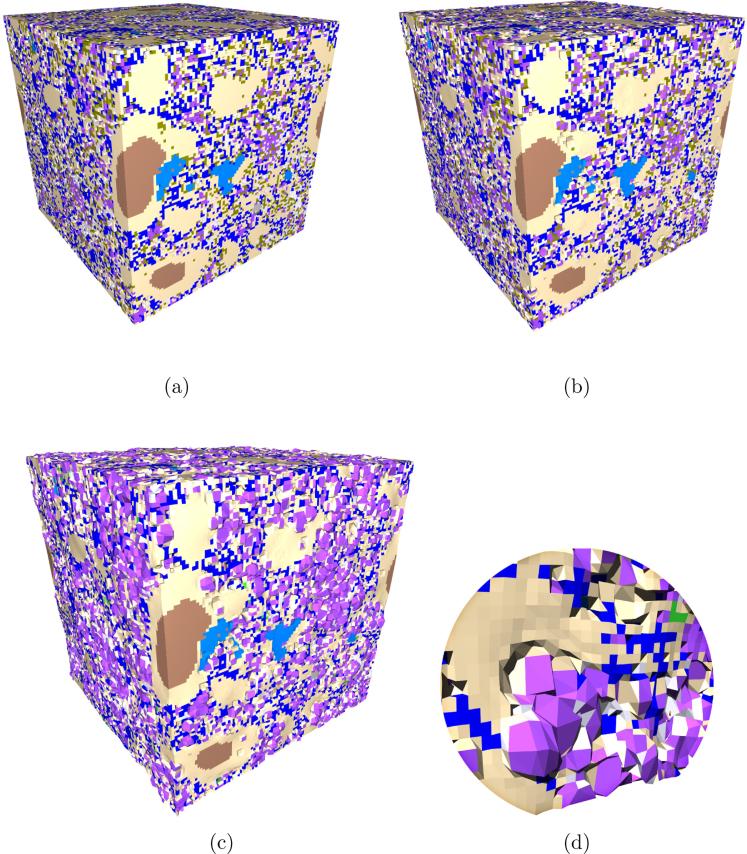
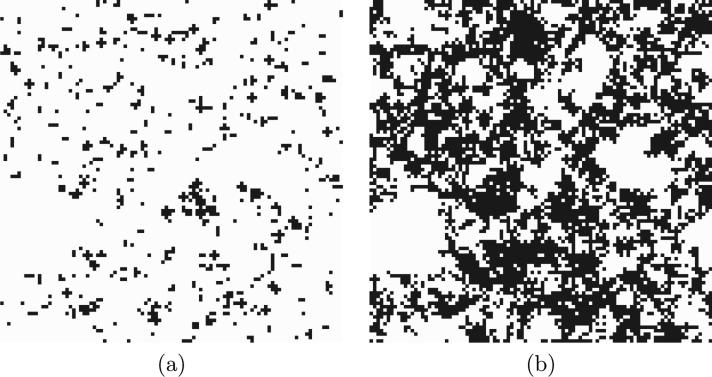
Fig. 6 shows the microstructure of the unhydrated paste, the paste hydrated to a degree of hydration of 0.90, and the phase assemblage and localized deformation at the end of Stage 1 and Stage 2. Areas of likely damage initiation, caused by the local stress exceeding the tensile strength, are shown at the end of Stages 1 and 2 as black voxels in Fig. 7.
Figure 6.
Evolution of CCRL 168 cement paste microstructure: (a) hydrated to 0.90 degree of hydration; (b) end of Stage 1, when monosulfatehas been converted to ettringite; (c) end of Stage 2, when all carboaluminates have been converted to ettringite; (d) magnified view of a portion of the microstructure in (c) showing the deformation around secondary ettringite. The displacement field is magnified by 5× to more clearly show deformation. Phase colors are C3S = brown, C2S = light blue, C3A = grey, C4AF = white, CSH = beige, CH = dark blue, calcite = green, ettringite = violet, monosulfate = olive, hydrotalcite = light green, capillary porosity = black.
Figure 7.
Microstructural damage field (black) after (a) end of Stage 1 and (b) end of Stage 2.
If expansion is caused by confined growth of ettringite in the available porosity adjacent to dissolving AFm phases, at least two microstructural properties should be important in determining the initiation of damage: (1) the volume of porosity adjacent to aluminate-bearing solid domains into which excess ettringite can grow without constraint; and (2) the dispersion of these phases throughout the microstructure at the beginning of sulfate attack, which in turn controls the extent of dispersion of transformed ettringite throughout the microstructure. With regard to the latter, we hypothesize that a higher surface-to-volume ratio of monosulfate, in the form of smaller phase domains, leads to a greater fraction of the microstructure's capillary porosity being in close proximity to a monosulfate surface. The availability of nearby capillary porosity can provide a “safety valve” that can accept the excess ettringite volume without increasing the local stress. Therefore, a finer distribution of monosulfate may lead to a smaller degree of expansion and damage for a given amount of monosulfate conversion.
This hypothesis can be tested by tracking the radial distribution of capillary porosity near monosulfate surfaces for different dispersions of monosulfate. We define the radial distribution function of porosity relative to monosulfate, g(r), as the volume of capillary pores at a distance r from any monosulfate surface, Vp(r), normalized by the total capillary pore volume, Vp,tot, so that
| (2) |
Applied to digitized microstructure images, g(r) characterizes the probability of finding a capillary pore voxel at a distance r from a monosulfate voxel, relative to the probability of finding a pore voxel at a random location in the microstructure. That is, for example, g(r) > 1 indicates that pore voxels are relatively more plentiful at a distance r from a monosulfate surface than they are throughout the whole microstructure. We quantify the relative availability of local capillary porosity near monosulfate surfaces by first computing g(r) on a given microstructure and then finding its average value for r ≤ 2 μm,
| (3) |
For a digital image microstructure, g(r) can be computed only at discrete distances, that is, the center-to-center distance of voxels that are nearest neighbors (r = 1 μm), second-nearest neighbors , and so on. Therefore, the integral reduces to a sum over the discrete distances .
Three unhyhdrated microstructures of a CCRL 168 paste were created with w/c = 0.45, each having dimensions 100 μm on a side. The absolute variation in volume fraction of any phase among the three microstructures was < 0.001. For each unhydrated microstructure, a series of ten different hydration simulations were conducted in which the affinity parameters for both monosulfate and C–S–H were systematically varied to produce hydrated microstructures that differed only in the coarseness of the monosulfate dispersion throughout the hydration product. This procedure resulted in a collection of 30 different microstructures in which the volume fractions of solid phases were statistically identical but contained monosulfate domain number densities (i.e., number of domains per unit volume) that varied between 1.5 × 107 mm−3 and 4.5 × 107 mm−3. Higher number densities correspond to smaller average domain volumes because the total volume of monosulfate is the same in each microstructure at the end of hydration.
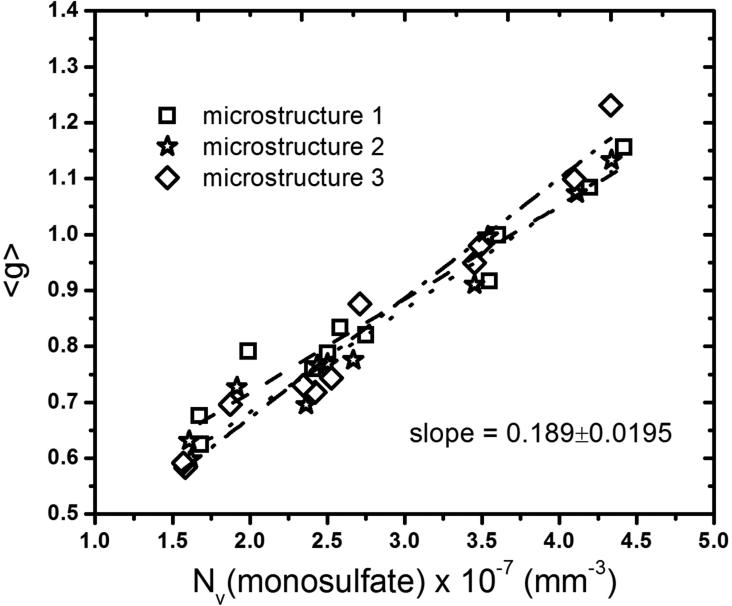
Each of the 30 hydrated microstructures was then subjected to a series of sulfate attack simulations to determine the influence of monosulfate distribution on the evolution of strain and damage. Fig. 8 plots 〈g〉 as a function of the number of monosulfate domains per unit volume at the beginning of Stage 1 sulfate attack. Different symbols are used to represent each of the three beginning microstructures, so that the influence of intrinsic variabilities in different microstructure realizations of the same paste can be quantified. The plot shows that finer dispersions of monosulfate have relatively more accessible porosity near monosulfate surfaces. In particular, 〈g〉 increases approximately linearly with the monosulfate fineness. For each unhydrated microstructure, the slope of the relation was obtained by least-squares linear regression. The mean of the three slopes is 0.189 with a relative standard uncertainty of about 10 %, measured as one standard deviation (1-σ). Thefore, the relation between monosulfate fineness and water accessibility near the surface is unlikely to be an accidental result of one particular microstructural realization.
Figure 8.
Relation between number of monosulfate domains and 〈g〉 for water adjacent to monosulfate surfaces. Different symbols represent results from different microstructure realizations of the same starting cement paste. Least-squares linear regressions associated with each starting microstructure are shown as dashed lines. Standard uncertainty in the mean slope of 0.189 is reported in terms of one standard deviation.
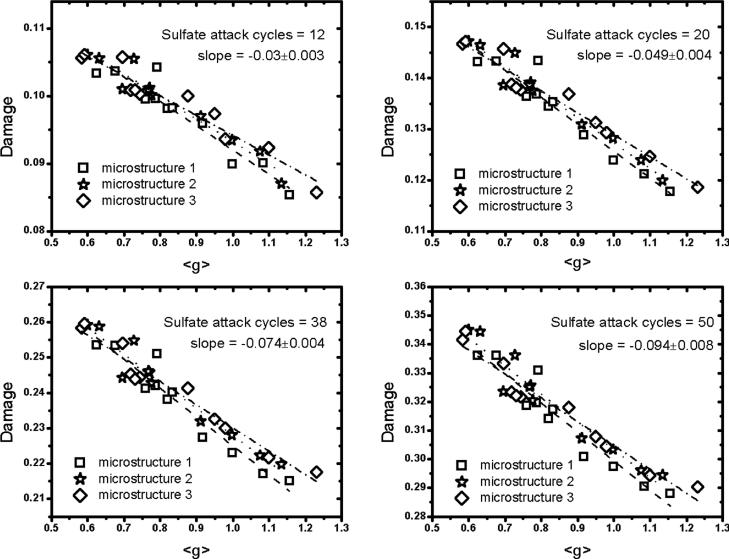
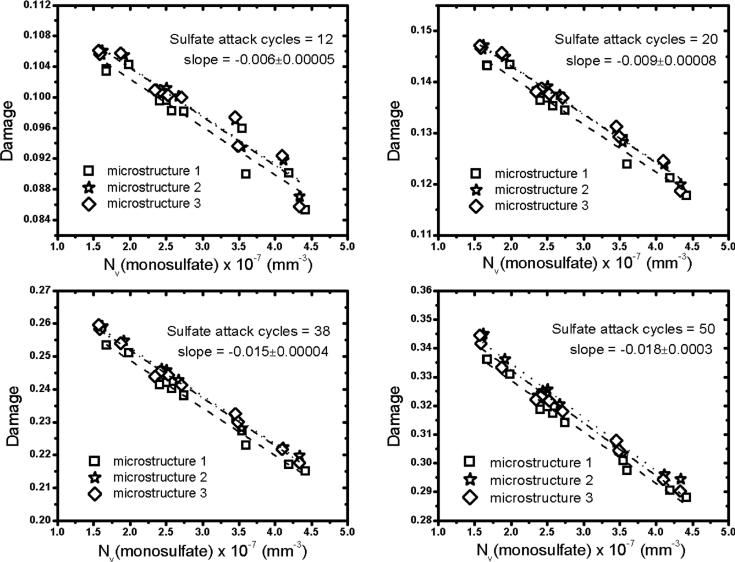
Recall that a voxel is considered damaged if the local tensile stress exceeds the maximum tensile stress assumed for the phase occupying that voxel. The severity of sulfate attack is now characterized by the number per unit volume of damaged voxels in the microstructure, a quantity to which we hereafter refer as simply “damage”. Fig. 9 plots the damage as a function of 〈g〉 at different ages of sulfate attack to investigate how monosulfate dispersion at the beginning of sulfate attack influences the damage thereafter. The plots show that, for any simulated exposure duration, expansion damage decreases with increasing 〈g〉. In other words, damage is lessened by an increased availability of capillary porosity near the monosulfate domains. In turn, this is accomplished in part by having a finer dispersion of monosulfate throughout the microstructure as opposed to fewer and larger occlusions. Fig. 10 confirms that the predicted damage decreases approximately linearly with the initial monosulfate domain number density, NV. Again, separate linear regressions were obtained for each microstructure realization at each exposure time, and the relative standard uncertainty in the slope is always less than 10 %. Note that monosulfate is completely consumed in these simulations by the end of Stage 1, which is the first nine flushing cycles. Fig. 9 indicates that the monosulfate distribution effect propagates for a significant time even after it has disappeared from the system. This imprinted “memory” of the monosulfate distribution is linked to the nature of the remaining capillary porosity after monosulfate has been consumed. For example, a finer monosulfate distribution, with relatively more accessible porosity nearby, enables ettringite to fill that porosity with lower stress. Ettringite therefore fills the adjacent capillary porosity more fully around finer monosulfate domains, leaving a smaller capillary pore volume after monosulfate is consumed. This smaller pore volume in turn implies (a) greater resistance to subsequent diffusion of sulfate solution and (b) smaller amounts of sodium sulfate per unit volume of microstructure that can cause further ettringite growth.
Figure 9.
Damage after different sulfate flushing cycles as a function of 〈g〉 for water near monosulfate domains. In each plot, different symbols are associated with different realizations of the same starting microstructure. Least-squares linear regression was used to obtain the slope (dashed lines) for each microstructure realization, and the mean slope and standard uncertainty (1-σ) are displayed.
Figure 10.
Dependence of predicted damage on the number density, NV, of monosulfate domains in the microstructure at the beginning of sulfate attack. Each plot uses different symbols for each of three realizations of the same starting microstructure. Least-squares linear regression was used to obtain the slope (dashed lines) for each microstructure realization, and the mean slope and standard uncertainty (1-σ) are displayed.
Such purely microstructural effects on sulfate attack, which are here predicted to be responsible for up to a 26 % variation in damage, are nevertheless of secondary importance compared to the influence of bulk cement composition, as we investigate in the following section. However, these microstructural influences have not received much attention previously and, to our knowledge, have not been tested experimentally. These simulations should therefore provide motivation for experimental tests of monsulfate distribution and its effects on sulfate attack progress. Such experiments are likely to be challenging because they require (a) the ability to clearly differentiate monosulfate from other AFm and AFt phases, (b) the ability to map out the 3D distribution of monosulfate in a microstructure, and (c) the ability to manipulate, to some extent, the monosulfate distribution as an experimental variable. In principle, such experiments might be undertaken using a combination of scanning electron microscopy (SEM) in backscattered mode, combined with energy dispersive X-ray spectroscopy to identify elemental concentrations. Stereological principles could be used to statistically reconstruct 3D distributions from 2D SEM/EDS images.
3.4. Influence of cement composition
Resistance to sulfate attack is directly linked to the aluminate content of the cement. The CCRL 168 cement already discussed has a total equivalent Al2O3 content of 2.1 % by mass. In this section, we investigate sulfate attack in two other cements: (1) a second Type I portland cement from the CCRL proficiency program, designated here as CCRL 140, with a total equivalent Al2O3 content of 1.7 %, and (2) a white cement (Al2O3 = 0.5 %). The mineral composition and total aluminum content of all three cements are shown in Table 1.
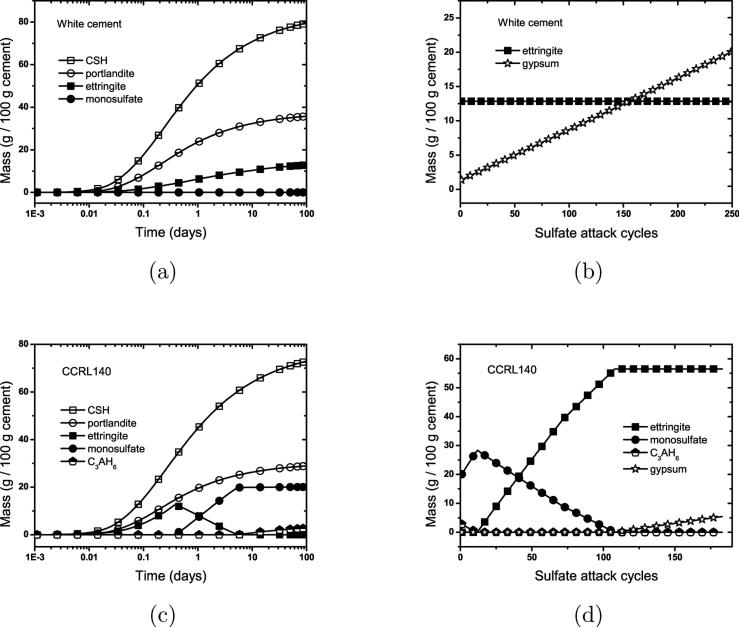
Figures 3 (for CCRL 168) and 11 (for the other two cements) show that these three cements behave differently both during hydration and during exposure to sulfate solution. Gypsum is completely consumed from CCRL 140 and CCRL 168 within the first day of hydration, while a small amount of gypsum remains in the white cement through 100 d of hydration. This remnant gypsum prevents the conversion of ettringite to monosulfate in the white cement, in contrast to both CCRL 140 and CCRL 168. At the beginning of sulfate attack, monosulfate and hydrogarnet (C3AH6) are the only aluminate-bearing phases predicted in CCRL 140. In CCRL 168, as already discussed, monosulfate, hemicarbonate, monocarbonate, and hydrotalcite all contribute to growth of ettringite during sulfate attack. As expected, the white cement, with no aluminate-bearing phases other than ettringite at the end of hydration, is essentially immune to sulfate attack. CCRL 168 has higher total Al content than CCRL 140, and therefore a greater volume of ettringite formed at the end (compare to Fig. 3(a)). This should be expected on thermodynamic grounds because the form of intermediate aluminate-bearing phases, unstable with respect to ettringite, should not influence the ultimate amount of ettringite formed. An interesting feature of CCRL 140 is that, with the first introduction of external sulfate, monosulfate actually grows temporarily at the expense of hydrogarnet. After hydrogarnet is consumed, monosulfate transforms continuously to ettringite as expected. Overall, more rapid ettringite growth is observed in CCRL 140 than in CCRL 168 during the early stages of sulfate attack. Ettringite growth in CCRL 168 is initially slower because its aluminates are partially contained in langbeinite, and because it contains small amounts of calcite and periclase, both of which promote the formation of carbonate and hydrotalcite phases that resist conversion to ettringite more strongly than does monosulfate (compare Fig. 3 and Fig. 11(c)). Therefore, in agreement with recent studies of sulfate attack [3, 15], these simulations indicate that both limestone (either calcium carbonate or dolomitic) and soluble magnesium sources can impart additional resistance to sulfate attack.
Figure 11.
Influence of Al content on phase evolution during hydration and subsequent external sulfate attack of a white cement (a,b) and CCRL 140 Type I cement (c,d).
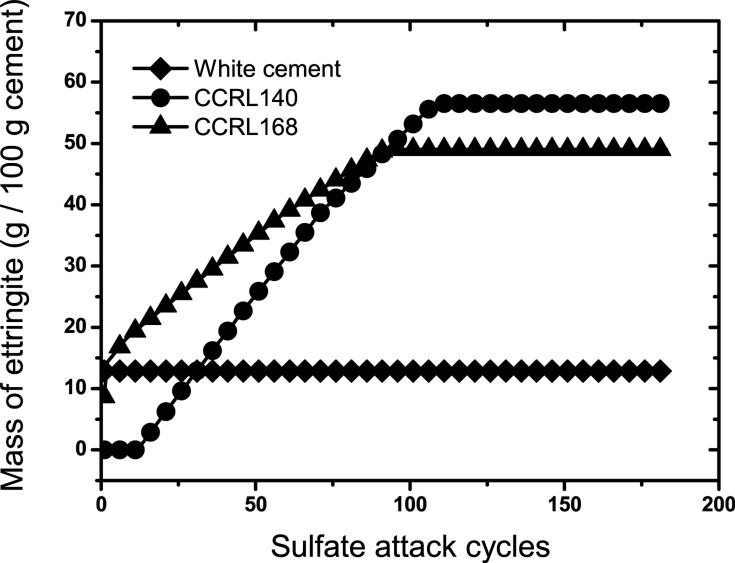
The changes in ettringite mass during sulfate attack simulations are compared for all three cement pastes in Fig. 12. This figure shows the delay in ettringite conversion exhibited by CCRL 140 owing to the initial conversion of hydrogarnet to monosulfate. However, after complete conversion of hydrogarnet, both the rate of conversion to ettringite and the final mass fraction of ettringite are greater in CCRL 140 than in CCRL 168. This result might seem unusual at first sight based on the greater combined content of iron and aluminum in CCRL 168. But as noted already in Fig. 3, a significant portion of the iron in CCRL 168 is tied up in an iron-rich hydrotalcite, and this iron stabilizes the hydrotalcite phase relative to ettringite. The paste made from CCRL 140, in contrast, lacks a su cient amount of magnesium to form much hydrotalcite, so ettringite is the only aluminum/iron-bearing phase remaining after prolonged exposure to sulfate solution.
Figure 12.
Comparison of ettringite mass evolution during sulfate attack for cement pastes made from CCRL 168, CCRL 140, and the white cement.
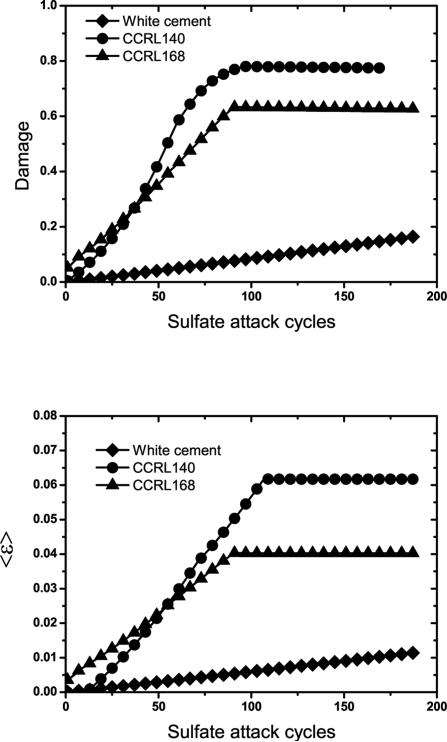
This influence of cement chemistry on the predicted amounts of ettringite is directly reflected in the predicted expansion and damage for all three cement pastes, as shown in Fig. 13. As described earlier, the white cement undergoes relatively little expansion because the aluminates are already completely converted to ettringite by the time sulfate exposure has begun. Expansion in the white cement is therefore due entirely to the relatively low volume of gypsum precipitation. CCRL 168, with the highest aluminate content of the three cements, sustains the greatest strain and damge over the first 40 flushing cycles, However, expansion and damage in CCRL 140 reach and exceed that in CCRL 168 after that point, due to its greater quantity of monosulfate (15.9 % by mass) compared to CCRL 168 (7.2 % by mass).
Figure 13.
Influence of Al content on average strain, 〈ε〉 (top) and damage (bottom) during exposure to sodium sulfate solution.
In summary, the combined aluminum and iron content of a portland cement is an important, but not the only, factor in determining a paste's resistance to external attack by sodium sulfate solution. The presence of magnesium and carbonate components in the cement can promote formation of intermediate aluminate-bearing phases, such as hemicarbonate and hydro- talcite, that have a lower thermodynamic driving force for transforming to ettringite than phases such as monosulfate and other AFm phases.
4. Conclusion
The method used here to model sulfate attack is well suited for revealing both chemical and microstructural influences on sulfate attack resistance for at least three reasons. First, the model uses thermodynamic geochemical speciation calculations to predict the equilibrium volumes and compositions of hydrated phases during hydration and during subsequent intrusion by a sodium sulfate solution. Second, it captures the 3D distribution of these hydrates in a manner that has been shown to faithfully reproduce a range of microstructural and macroscopic properties of the material [39, 45]. Third, the model is directly coupled to a 3D finite element model that enables the evolving stress field to be tracked as phase transformations give rise to local misfit strain. Regions susceptible to damage can be identified and followed based on a phase-dependent maximum tensile stress criterion. This latter feature enables the model to compute the evolving effective elastic stiffness of the binder and therefore monitor the material's resistance to expansion as well as the driving forces for that expansion. It is worth emphasizing that this is the first model of which we are aware that can provide a detailed microstructural analysis of sulfate attack at the scale of individual cement grains.
The model reproduces primary effects of bulk chemistry on sulfate attack resistance that have been reported previously [15]. Specifically, ettringite growth in confined pore volumes is largely responsible for expansion and damage formation. Any changes in bulk chemistry that favor carboaluminate and hydrotalcite relative to monosulfate can reduce the material's susceptibility to sulfate attack compared to those that are rich in monosulfate.
The simulations also predict secondary microstructural influences on sul-fate attack resistance. Finer dispersions of monosulfate are predicted to produce lower expansion and damage due to the greater relative accessibility of capillary porosity near the transforming monosulfate surfaces that can accommodate excess ettringite volume. These microstructural details have not received much attention previously and, to our knowledge, have not been tested experimentally. But the model suggests that they can influence macrosopic expansion by as much as 16 % in the systems examined here. New opportunities could be created for increasing sulfate resistance in concrete if these aspects of hydrated microstructure could be controlled more accurately, perhaps with organic additives that control nucleation and growth of monosulfate.
Acknowledgements
The China Scholarship Council (CSC) provided financial support for PF. The authors are grateful to Chiara Ferraris, Ken Snyder, and Paramita Mondal for helpful discussions during the preparation of the manuscript.
References
- 1.Santhanam M, Cohen MD, Olek J. Mechanism of sulfate attack: A fresh look Part 2. proposed mechanisms. Cem. Concr. Res. 2003;33:341–346. [Google Scholar]
- 2.Santhanam M, Cohen MD, Olek J. Effects of gypsum formation on the performance of cement mortars during external sulfate attack. Cem. Concr. Res. 2003;33:325–332. [Google Scholar]
- 3.Irassar EF, Bonavetti VL, González M. Microstructural study of sulfate attack on ordinary and limestone portland cements at ambient temperature. Cem. Concr. Res. 2003;33:31–41. [Google Scholar]
- 4.Tixier R, Mobasher B. Modeling of damage in cement-based materials subjected to external sulfate attack. I: Formulation. J. Mater. Civ. Eng. 2003;15(4):305–313. [Google Scholar]
- 5.Tixier R, Mobasher B. Modeling of damage in cement-based materials subjected to external sulfate attack. II: Comparison with experiments. J. Mater. Civ. Eng. 2003;15(4):314–322. [Google Scholar]
- 6.Monteiro PJM, Kurtis KE. Time to failure for concrete exposed to severe sulfate attack. Cem. Concr. Res. 2003;33:987–993. [Google Scholar]
- 7.Chindaprasirt P, Homwuttiwong S, Sirivivatnanon V. Influence of fly ash fineness on strength, drying shrinkage and sulfate resistance of blended cement mortar. Cem. Concr. Res. 2004;34:1087–1092. [Google Scholar]
- 8.Neville A. The confused world of sulfate attack on concrete. Cem. Concr. Res. 2004;34:1275–1296. [Google Scholar]
- 9.Mobasher B, Ferraris CF. Simulation of expansion in cement based materials subjected to external sulfate attack. Proceedings of RILEM Technical Meeting on Durability of Cement Based Materials. 2004 [Google Scholar]
- 10.Gospodinov PN. Numerical simulation of 3D sulfate ion diffusion and liquid push out of the materials capillaries in cement composites. Cem. Concr. Res. 2005;35:520–526. [Google Scholar]
- 11.Al-Akhras NM. Durability of metakaolin concrete to sulfate attack. Cem. Concr. Res. 2006;36:1727–1734. [Google Scholar]
- 12.Shazali MA, Baluch MH, Al-Gadhib AH. Predicting residual strength in unsaturated concrete exposed to sulfate attack. J. Mater. Civ. Eng. 2006;18:343–354. [Google Scholar]
- 13.Monteiro PJM. Scaling and saturation laws for the expansion of concrete exposed to sulfate attack. Proc. Nat. Acad. Sci. USA. 2006;103(31):11467–11472. doi: 10.1073/pnas.0604964103. [DOI] [PMC free article] [PubMed] [Google Scholar]
- 14.Anantharaman S. [July 23, 2015];Sulfate resistance and alkali silica resistance of class C & F replaced blended cements, M.Sc. thesis, Arizona State University, Phoenix, Arizona. 2008 May; Available at http://faculty.engineering.asu.edu/cement/wp-content/uploads/2011/09/Thesis_Sudheen_Print_021508.pdf.
- 15.Schmidt T, Lothenbach B, Romer M, Neuenschwander J, Scrivener KL. Physical and microstructural aspects of sulfate attack on ordinary and limestone blended Portland cements. Cem. Concr. Res. 2009;39:1111–1121. [Google Scholar]
- 16.Sarkar SL, Mahadevan S, Meeussen JCL, van der Sloot H, Kosson DS. Numerical simulation of cementitious materials degradation under external sulfate attack. Cem. Concr. Composites. 2010;32:241–252. [Google Scholar]
- 17.Idiart AE, López CM, Carol I. Chemo-mechanical analysis of concrete cracking and degradation due to external sulfate attack: A meso-scale model. Cem. Concr. Composites. 2011;33:411–423. [Google Scholar]
- 18.Kunther W, Lothenbach B, Scrivener KL. Influence of bicarbonate ions on the deterioration of mortar bars in sulfate solutions. Cem. Concr. Res. 2013;44:77–86. [Google Scholar]
- 19.Kunther W, Lothenbach B, Scrivener KL. On the relevance of volume increase for the length changes of mortar bars in sulfate solutions. Cem. Concr. Res. 2013;46:23–29. [Google Scholar]
- 20.Kunther W, Lothenbach B, Scrivener KL. Deterioration of mortar bars immersed in magnesium containing sulfate solutions, Mater. Structures. 2013;46:2003–2011. [Google Scholar]
- 21.Yu C, Sun W, Scrivener KL. Mechanism of expansion of mortars immersed in sodium sulfate solutions. Cem. Concr. Res. 2013;43:105–111. [Google Scholar]
- 22.Oliveira I, Cavalaro SHP, Aguado A. New kinetic model to quantify internal sulfate attack in concrete. Cem. Concr. Res. 2013;43:95–104. [Google Scholar]
- 23.Brown PW, Taylor HFW. The role of ettringite in external sulfate attack. In: Marchand J, Skalny JP, editors. Materials Science of Concrete: Sulfate Attack Mechanisms. American Ceramic Society; Westerville, OH: 1999. pp. 73–98. [Google Scholar]
- 24.Clifton JR, Pommersheim JM. Sulfate attack of cementitious materials: Volumetric relations and expansions, NIST Interagency Report 5390. National Institute of Standards and Technology; Gaithersburg, MD: Apr, 1994. [July 23, 2015]. Available at http://fire.nist.gov/bfrlpubs/build94/PDF/b94040.pdf. [Google Scholar]
- 25.Gollop RS, Taylor HFW. Microstructural and microanalytical studies of sulfate attack I. ordinary portland cement paste. Cem. Concr. Res. 1992;22:1027–1038. [Google Scholar]
- 26.Tian B, Cohen MD. Does gypsum formation during sulfate attack on concrete lead to expansion? Cem. Concr. Res. 2000;30:117–123. [Google Scholar]
- 27.Lafuma H. Théorie de l’expansion des ligants hydrauliques. Rev. Mater. Constr. Trav. Publics. 1929;243:441–444. [Google Scholar]
- 28.Cohen MD, Richards CW. Effects of the particle sizes of expansive clinker on strength–expansion characteristics of type K expansive cements. Cem. Concr. Res. 1982;12:717–725. [Google Scholar]
- 29.Mehta PK. Proceedings of the Conference on Expansive Cement Concretes. University of California; Berkeley: 1972. Chemistry and microstructure of expanseive cements. [Google Scholar]
- 30.Mehta PK. Mechanism of expansion associated with ettringite formation. Cem. Concr. Res. 1973;3:1–6. [Google Scholar]
- 31.Scherer GW. Stress from crystallization of salt. Cem. Concr. Res. 2004;34:1613–1624. [Google Scholar]
- 32.Scherer GW. Crystallization in pores. Cem. Concr. Res. 1999;29:1347–1358. [Google Scholar]
- 33.Flatt RJ, Scherer GW. Thermodynamics of crystallization stresses in DEF. Cem. Concr. Res. 2008;38:325–336. [Google Scholar]
- 34.Samson E, Marchand J, Beaudoin JJ. Modeling the influence of chemical reactions on the mechanisms of ionic transport in porous materials: An overview. Cem. Concr. Res. 2000;30:1895–1902. [Google Scholar]
- 35.Marchand J. Modeling the behavior of unsaturated cement systems exposed to aggressive chemical environments. Mater. Structures. 2001;34:195–200. [Google Scholar]
- 36.Samson E, Marchand J. Modeling the transport of ions in unsaturated cement-based materials. Computers & Structures. 2007;85:1740–1756. [Google Scholar]
- 37.Gospodinov PN, Kazandjiev RF, Partalin TA, Mironova MK. Diffusion of sulfate ions into cement stone regarding simultaneous chemical reactions and resulting effects. Cem. Concr. Res. 1999;29:1591–1596. [Google Scholar]
- 38.Schmidt-Döhl F, Rostásy FS. A model for the calculation of combined chemical reactions and transport processes and its application to the corrosion of mineral-building materials. Part II. Experimental verification. Cem. Concr. Res. 1999;29:1047–1053. [Google Scholar]
- 39.Bullard JW, Lothenbach B, Stutzman PE, Snyder KA. Coupling thermodynamics and digital image models to simulate hydration and microstructure development of portland cement pastes. J. Mater. Res. 2011;26(4):609–622. [Google Scholar]
- 40.Garboczi EJ. NISTIR 6269. U.S. Department of Commerce; Dec, 1998. [July 23, 2015]. Finite element and finite difference programs for computing the linear electric and elastic properties of digital images of random materials. Available at http://www.nist.gov/manuscript-publication-search.cfm?pub_id=860168. [Google Scholar]
- 41.Parrot LJ, Killoh DC. Prediction of cement hydration. Br. Ceram. Proc. 1984;35:41–53. [Google Scholar]
- 42.Kulik DA. [July 23, 2015];GEMS-PSI 2.03. http://les.web.psi.ch/Software/GEMS-PSI/
- 43.Lothenbach B, Winnefeld F. Thermodynamic modelling of the hydration of Portland cement. Cem. Concr. Res. 2006;36:209–226. [Google Scholar]
- 44.Lothenbach B, Matschei T, Möschner G, Glasser FP. Thermodynamic modelling of the effect of temperature on the hydration and porosity of Portland cement. Cem. Concr. Res. 2008;38:1–18. [Google Scholar]
- 45.Feng P, Miao C, Bullard JW. A model of phase stability, microsructure and properties during leaching of portland cement binders. Cem. Concr. Composites. 2014;49:9–19. [Google Scholar]
- 46.Sugiyami T, Worapatt R, Yukikazu T. Simultaneous transport of chlo-ride and calcium ions in hydrated cement systems. J. Adv. Concrete Technol. 2003;1:127–138. [Google Scholar]
- 47.Wang JG. Sulfate attack on hardened cement paste. Cem. Concr. Res. 1994;24(4):735–742. [Google Scholar]
- 48.Roziere E, Loukili A, Hachem RE, Grondin F. Durability of concrete exposed to leaching and external sulphate attack. Cem. Concr. Res. 2009;39:1188–1198. [Google Scholar]
- 49.Hummel W, Berner U, Curti E, Pearson FJ, Thoenen T. Nagra / PSI Chemical Thermodynamic Data Base 01/01. Universal Publishers; Parkland, Florida: 2002. [Google Scholar]
- 50.Haecker CJ, Garboczi EJ, Bullard JW, Bohn RB, Sun Z, Shah SP, Voigt T. Modeling the linear elastic properties of Portland cement paste. Cem. Concr. Res. 2005;35:1948–1960. [Google Scholar]
- 51.Thorpe MF, Garboczi EJ. Elastic properties of central-force networks with bond-length mismatch. Phys. Rev. B. 1990;42:8405–8417. doi: 10.1103/physrevb.42.8405. [DOI] [PubMed] [Google Scholar]
- 52.Roberts AP, Garboczi EJ. Elastic properties of a tungsten-silver composite by reconstruction and computation. J. Mech. Phys. Solids. 1999;47:2029–2055. [Google Scholar]
- 53.Meille S, Garboczi EJ. Linear elastic properties of 2D and 3D models of porous materials made from elongated objects. Modell. Simul. Mater. Sci. Eng. 2001;9(5):371–390. [Google Scholar]
- 54.Arns CH, Knackstedt MA, Pinczewski WV, Garboczi EJ. Computation of linear elastic properties from microtomographic images: Methodology and agreement between theory and experiment. Geophys. 2002;67(5):1396–1405. [Google Scholar]
- 55.Sahachaiyunta P, Ponpaisanseree K, Bullard JW, Stutzman PE, Garboczi EJ, Vichit-Vadakan W. Virtual testing in a cement plant. Concr. Intl. 2012:33–39. [Google Scholar]
- 56.Valentini L, Parisatto M, Russo V, Ferrari G, Bullard JW, Angel RJ, Dalconi MC, Artioli G. Prediction of the mechanical properties of industrial cement mortars by computer modelling. Cem. Concr. Composites. in press. [Google Scholar]
- 57.Raphael JM. Tensile strength of concrete. ACI J. 1984;81:158–165. [Google Scholar]
- 58.Nazari A, Riahi S. Splitting tensile strength of concrete using ground granulated blast furnace slag and SiO2 nanoparticles as binder. Energy and Buildings. 2011;43:864–872. [Google Scholar]
- 59.Belytschko T, Gracie R, Bentura G. A review of extended/generalized finite element methods for material modeling. Modelling Simul. Mater. Sci. Eng. 2009;17:043001. [Google Scholar]
- 60.Annual Book of ASTM Standards. ASTM International; West Conshohocken, PA: 2000. [Google Scholar]
- 61.AASHTO Standard T 353-14, Particle Size Analyis of Hydraulic Cement and Related Materials by Light Scattering. American Association of State Highway and Transportation Officials; Washington, D.C.: 2014. [Google Scholar]
- 62.Virtual cement and concrete testing laboratory software. 2014 Jun; http://www.nist.gov/el/buildint materials/evcctl.cfm.
- 63.Ferraris CF, Stutzman PE, Peltz MA, Winpigler JA. Developing a more rapid test to assess sulfate resistance of hydraulic cements. J. Res. National Inst. Standards Technol. 2005;110(5):529–540. doi: 10.6028/jres.110.080. [DOI] [PMC free article] [PubMed] [Google Scholar]


