Abstract
Background
Intrathoracic impedance-derived OptiVol fluid index calculated using implanted devices has been shown to predict mortality; direct measurements of impedance have not been examined. We hypothesized that baseline measured impedance predicts all-cause mortality; changes in measured impedance result in a change in the predicted mortality; and the prognostic value of measured impedance is additive to the calculated OptiVol fluid index.
Methods and Results
A retrospective analysis of 146,238 patients within the Medtronic CareLink data base with implanted devices was performed. Baseline measured impedance was determined using daily values averaged from month 6 to 9 post implant and were used to divide patients into tertiles; Group L= Low Impedance: ≤ 65 ohms, M= Medium Impedance: 66–72 ohms, H= High Impedance: ≥ 73 ohms. Change in measured impedance was determined from values averaged from month 9 to 12 post implant compared to the 6 to 9 month values. OptiVol fluid index was calculated using published methods. All-cause mortality was assessed beginning 9 months post implant; changes in mortality beginning 12 months post implant. Baseline measured impedance predicted all-cause mortality; 5 year mortality for group L was 41%, M was 29%, H was 25%, p < 0.001 among all groups. Changes in measured impedance resulted in a change in the predicted mortality; the prognostic value of measured impedance was additive to the OptiVol fluid index.
Conclusions
Direct measurements of intrathoracic impedance using an implanted device can be used to stratify patients at varying mortality risk.
Keywords: heart failure, impedance, all-cause mortality
Changes in intrathoracic impedance-derived fluid indices measured using implanted devices has been shown to predict heart failure hospitalizations and all-cause mortality in patients with heart failure and a reduced ejection fraction (1–18). In these previous studies, an impedance-derived fluid index (hereafter called “OptiVol fluid index”) was obtained using a cumulative sum mathematical model that calculates the differences between impedance measured in ohms (hereafter called directly “measured impedance”) and a reference impedance; the OptiVol fluid index was expressed in ohm-days. It was demonstrated that when the OptiVol fluid index value exceeded 60 ohm-days, the crossing of this threshold value predicted both increased morbidity and mortality (2–7). This calculated OptiVol fluid index was chosen instead of the directly measured impedance because of several anticipated confounding limitations of the direct impedance measurement. These included multiple non-cardiovascular and cardiovascular factors independent of volume status that could alter measured impedance in individual patients. In addition, patient to patient variability in measured impedance values was felt to occur without reference to volume status. Finally, immediately after device implantation, measured impedance values vary for several weeks before they reach a reproducible equilibrium. These and other factors were thought to limit the clinical value and reproducibility of measured impedance.
However, the independent prognostic value of measured impedance has not previously been thoroughly evaluated, particularly with respect to predicting all-cause mortality. Measured impedance has several advantages. It is a simple and direct measurement. It may have value independent of or additive to the OptiVol fluid index. Changes in measured impedance values over defined time periods may signal a change in prognosis.
Accordingly, data within the Medtronic CareLink database from more than 146,000 patients were examined to test the hypotheses that measured intrathoracic impedance has independent prognostic value. Specifically, it was hypothesized that baseline measured impedance predicts all-cause mortality; changes in measured impedance result in a change in the predicted mortality; and the prognostic value of measured impedance is additive to and independent of the OptiVol fluid index.
Methods
Study Patients
The Medtronic CareLink® Discovery Link was established as a de-identified repository of longitudinal data retrieved via a remote monitoring network of implantable cardiac defibrillator (ICD) or cardiac resynchronization device with an ICD (CRT-D) manufactured by Medtronic, Plc. Centers using CareLink entered into a data use agreement that allows for the use of data for research purposes in accordance with regulations stipulated in the Health Insurance Portability and Accountability Act (HIPAA). However, demographic description of these patients was limited. For example, left ventricular structure and function characteristics were not included in the CareLink® database. Therefore, certain implications concerning the application of the results of this study to specific patient populations can only be inferred. For example, it is inferred that more than 95% of the patients in this study had heart failure with a reduced ejection fraction (HFrEF) based on 2 issues. First, only patients with HFrEF are qualified to receive a CRT or CRT-D; second, previous studies have demonstrated that < 10% of ICD patients have heart failure with a preserved ejection fraction (HFpEF) placed for secondary prevention. Thus, in aggregate > 95% of the subjects studied were likely to have HFrEF.
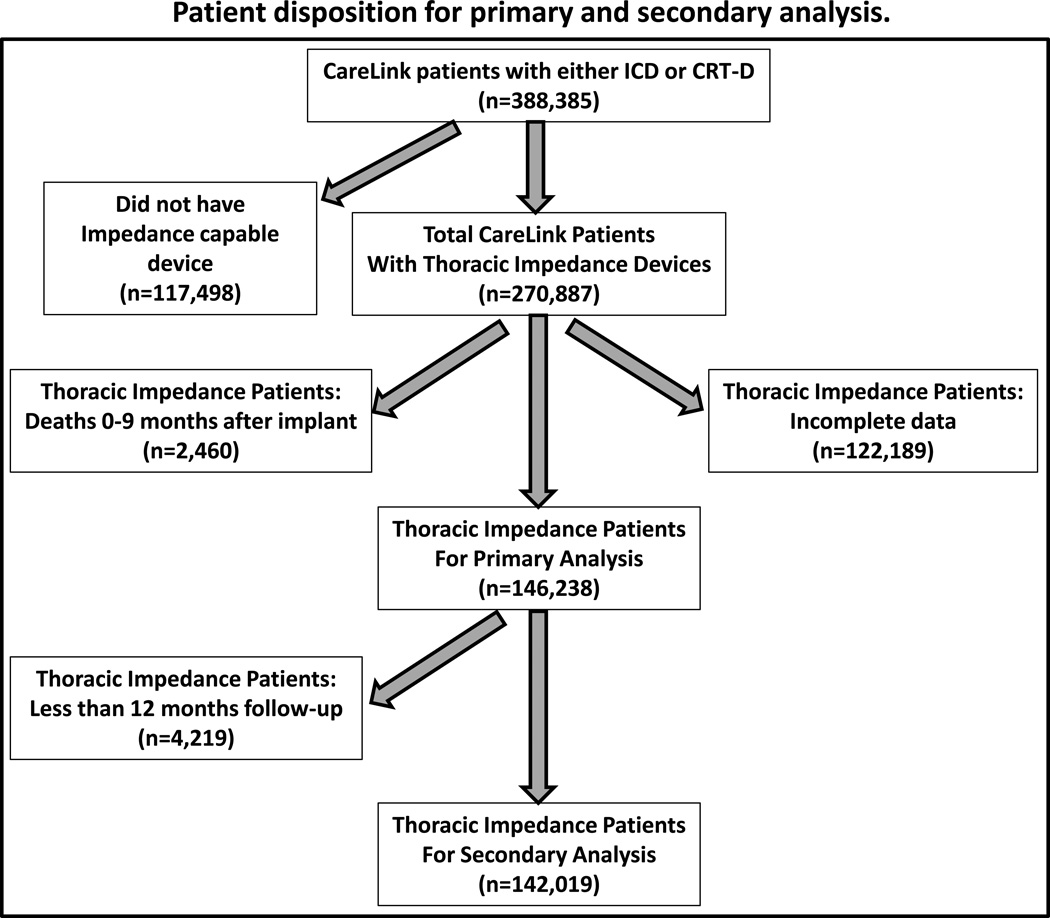
In this study, a retrospective analysis of patients with devices implanted in the USA from December 2004 through August 2012 was conducted. From the total number of CareLink patients implanted with either ICD or CRT-D devices during this time frame (n= 388,385), those patients implanted with devices without the capability of measuring intrathoracic impedance (n= 117,498) were excluded (Figure 1). Also, patients with significant missing impedance data due to infrequent CareLink® data transmissions (n= 122,189) were also excluded. Furthermore, because analysis was based on the behavior of the intrathoracic impedance during the first 9 months, patients who died within this period were excluded (n= 2460). These criteria were set a priori, driven solely by requirements for the analysis. After exclusions, 146,238 patients were included in the analysis.
Figure 1.
Patient sample size disposition for primary and secondary survival analysis. ICD = implantable cardiac defibrillator, CRT-D = cardiac resynchronization with an cardiac defibrillator.
Intrathoracic Impedance Measurements
All ICD and CRT-D devices measured intrathoracic impedance using the RV-coil to can vector. Four impedance measurements were taken every 20 min from the period of noon to 5 pm, and the resulting 64 measurements were averaged to obtain daily measured impedance. Impedance measurements were available starting one day post-implant and on all days through the last transmission date. At least 9 months elapsed between the implant date and last transmission date. Baseline measured impedance was determined using daily impedance values averaged from 6 months through 9 months post implant. The first 6 months of impedance data were excluded because intrathoracic impedance measured by the device is known to slowly change over this time as the device pocket matures (3).
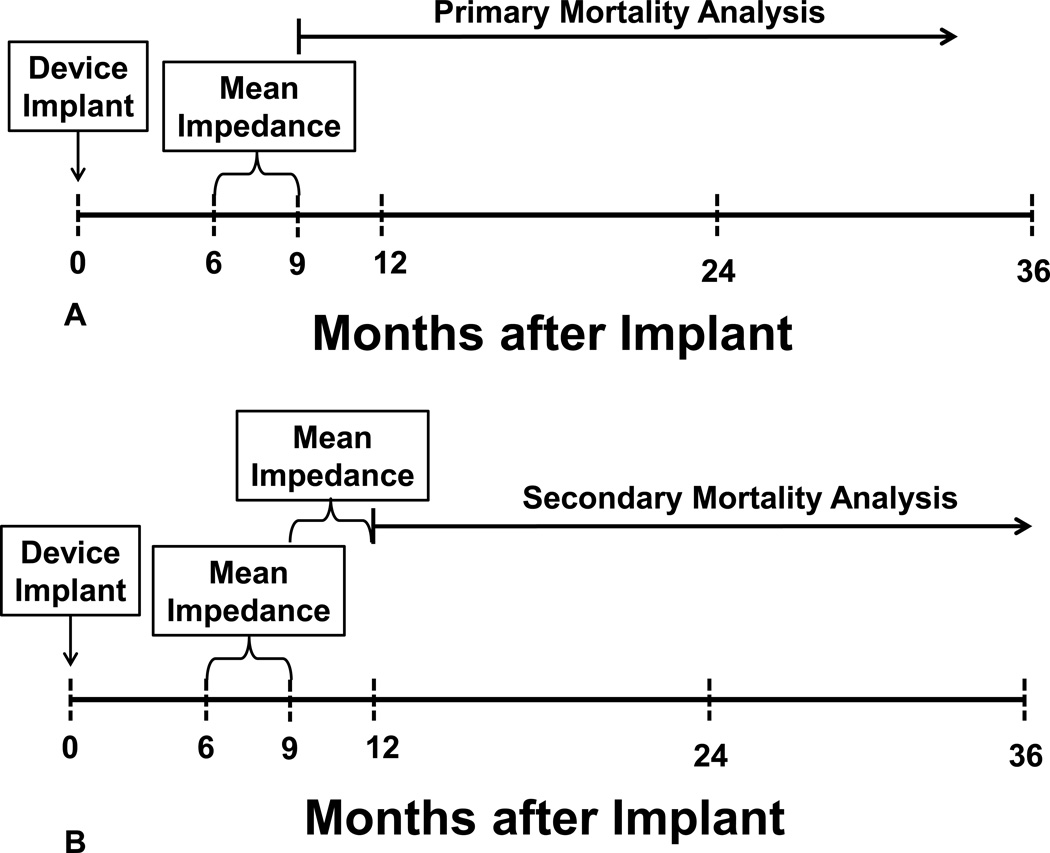
Two analyses were performed (Figure 2A, B). In the primary analysis, survival was evaluated from 9 months forward (Figure 2A). Mortality data were obtained from the Medtronic Device Registry and cross-referenced with the Social Security Death Index up to 31 May 2013. Patients were divided into three groups based on 33rd and 66th percentile values for the distribution of the baseline impedance values as follows:
Group H: High Impedance: ≥ 73 ohms (Highest observed impedance: 170 ohms)
Group M: Medium Impedance: 66–72 ohms
Group L: Low Impedance: ≤ 65 ohms (Lowest observed impedance: 27 ohms)
Furthermore, whether measured impedance provides incremental value to prediction of all-cause mortality independent of threshold crossing was examined. “Threshold crossing” was defined as a reduction in intrathoracic impedance leading to a rise in the derived OptiVol fluid index above the nominal threshold of 60 ohm-days during 6–9 months after implant.
Figure 2.
Panel A- Experimental design for the primary survival analysis, see text for details.
Panel B- Experimental design for the secondary survival analysis, see text for details.
In the secondary analysis, whether changes in average impedance over the next 3 months (i.e. 9 to 12 months after implant) in each of three groups were associated with varying mortality were examined (Figure 2B). For this secondary analysis, patients in group L (based on baseline impedance) who had no change in measured impedance over 9–12 months (i.e., the measured impedance remained ≤ 65 ohms) were called “group L.L” (i.e., started in group L, stayed in group L). Likewise, patients in group L (based on baseline impedance) who had an increase in measured impedance over 9–12 months to values 66–72 ohms were called “group L.M” (started in group L, changed to group M); and patients in group L (based on baseline impedance) who had an increase in measured impedance over 9–12 months to values ≥ 73 ohms were called “group L.H” (started in group L, changed to group H). A similar labeling scheme was used for patients in groups M and H using their initial 6–9 month impedance values first followed by their subsequent 9–12 month values.
Data Analysis
The F-test for continuous variables (mean ± SD) and χ2 test for categorical variables were used to examine the differences in baseline characteristics among groups. Kaplan–Meier survival analysis and Cox proportional hazards regression were used for time-to-event analysis, with the starting date of follow-up after the observation period (9 months after implantation for the primary analysis and 12 months after implantation for the secondary analysis). Hazard ratios (HR) and 95% confidence intervals (95% CI) for all-cause mortality were adjusted for age, gender, and device type. All analyses were performed using statistical software from SAS, Inc. (Version 9, Cary NC, USA).
Results
Patient Demographics
For the entire cohort of 146,238 patients, the mean ± SD age was 67±12 years, 75% were male, 15% had a single chamber ICD (ICD-VR), 40% dual chamber ICD (ICD-DR), and 45% CRT-D. The mean ± SD follow-up was 29±19 months. When this cohort was divided into tertiles, there were significant differences between the 3 groups in all of these baseline demographic data (Table 1). For example, patients in group L (measured impedance ≤ 65 ohms) were older, more often had a CRT-D, and more frequently were female than patients in groups M (measured impedance 66–72 ohms) and H (measured impedance ≥ 73 ohms). These baseline demographic differences were expected because of the very large sample size studied; however, each of these baseline factors was adjusted for in the Cox regression analyses described below.
Table 1.
Demographic Data for Three Impedance Groups
| Mean Measured Impedance between 6 and 9 months | ||||
|---|---|---|---|---|
| Group L | Group M | Group H | ||
| 27 – 65 Ω | 66 – 72 Ω | 73 – 170 Ω | ||
| (n=48709) | (n=46933) | (n=50596) | ||
| Age at implant, years | 70 ± 12 | 68 ± 11 | 65 ± 11 | p < 0.001 |
| Gender | ||||
| Female | 29% | 22% | 24% | |
| Male | 71% | 78% | 76% | p < 0.001 |
| Device type | ||||
| ICD-VR | 12% | 14% | 18% | |
| ICD-DR | 38% | 41% | 41% | |
| CRT-D | 50% | 45% | 41% | p < 0.001 |
| Mean follow-up, months | 26 ± 18 | 29 ± 19 | 32 ± 20 | p < 0.001 |
| Status | ||||
| Alive | 82% | 86% | 87% | |
| Dead | 18% | 14% | 13% | p < 0.001 |
Abbreviations: Ω = Impedance in ohms, group L = patients with baseline measured impedance ≤ 65 ohms, Group M = patients with baseline measured impedance 66–72 ohms; Group H: patients with baseline measured impedance ≥ 73 ohms. ICD-VR = single chamber intra-cardiac defibrillator, ICD-DR = dual chamber intra-cardiac defibrillator, CRT-D = cardiac resynchronization with an cardiac defibrillator.
Measured Impedance vs. Survival (Primary Analysis)
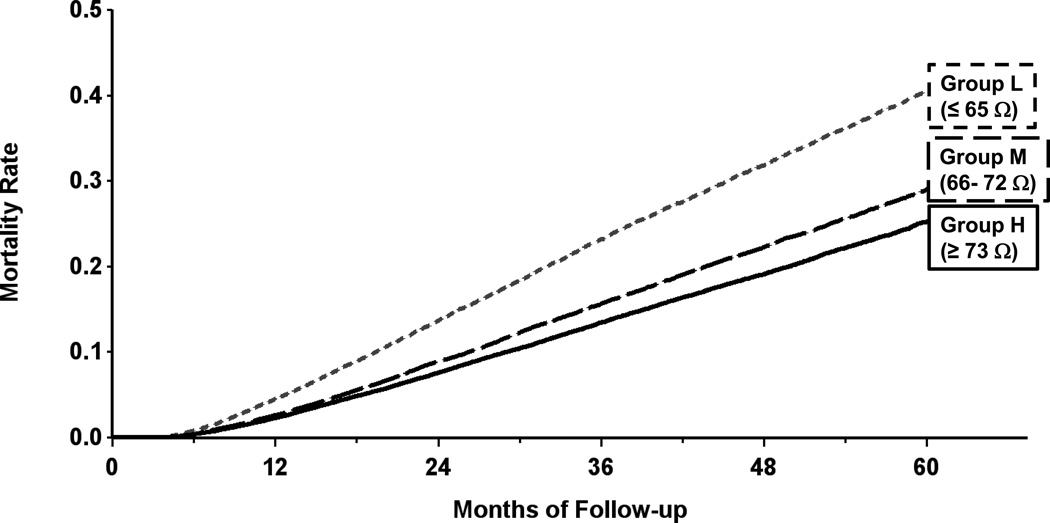
The Kaplan-Meier estimate of all-cause mortality in group L patients was 41% at 5 years of follow-up; this was significantly higher than the 29% mortality in group M and 25% mortality in group H patients; all pair-wise comparisons were significant at p < 0.001 (Figure 3). When adjusted for age, gender and type of device, the hazard ratio for group L vs. M was 1.38 (95% CI: 1.33, 1.42) and hazard ratio for group L vs. H was 1.39 (95% CI: 1.34, 1.44). Both hazard ratios were statistically significant with p < 0.001 (Table 2). The hazard ratio for group M vs. H was 1.01 (95% CI: 0.98, 1.04), which was not significant (p = 0.588).
Figure 3.
Kaplan-Meier estimate of all-cause mortality in the primary mortality analysis. Patients were divided into tertiles based on average baseline measured impedance from 6–9 months after implantation: Group L measured impedance ≤ 65 ohms, group M 66–72 ohms, group H ≥ 73 ohms.
Table 2.
Hazard Ratios for All-Cause Mortality Predicted by Baseline Measured Impedance
| Unadjusted (HR, 95% CI) | Adjusted* (HR, 95% CI) | |
|---|---|---|
| Group L vs. Group M | 1.54 (1.50 1.60) p < 0.001 |
1.38 (1.33, 1.42) p < 0.001 |
| Group L vs. Group H | 1.83 (1.77, 1.89) p < 0.001 |
1.39 (1.34, 1.44) p < 0.001 |
| Group M vs. Group H | 1.18 (1.14, 1.22) p < 0.001 |
1.01 (0.98, 1.04) p = 0.588 |
The observation period over which the baseline direct measurement of impedance was obtained was 3 months from month 6 to 9 post implant. In addition, as an exploratory analysis, shorter observation periods were examined to determine whether observation periods of 1 month, 1 week, and 1 day would also be sufficient to predict mortality (Table 3). This exploratory analysis was done only for the primary analysis and only after adjustment for age, gender and type of device (all tables except Table 3 and all graphs use 3 month time periods because they were the most robust and easily presented). This analysis of mortality started the day after the end of the period for calculating average impedance. For example, the “1 day average” is the impedance value at day 183 post implant; mortality analysis started at day 184 post implant. Similarly, the “1 week average” is the average impedance from day 183 to day 189 post implant; mortality analysis started at day 190 post implant. For all observation periods, 3 months, 1 month, 1 week and 1 day, baseline measured impedance predicted mortality. Using each observation period, group L patients had a higher mortality than group M or H patients (p < 0.001 for all pairwise comparisons); there were no significant differences between group M and H patients.
Table 3.
Adjusted * Hazard Ratios for All-Cause Mortality Predicted by Impedance Measured Over Variable Time Periods
| Group L vs M | Group L vs H | Group M vs H | |
|---|---|---|---|
| 3 month average | 1.38 (1.33, 1.42) p < 0.001 |
1.39 (1.34, 1.44) p < 0.001 |
1.01 (0.98, 1.04) p = 0.588 |
| 1 month average | 1.36 (1.32, 1.41) p < 0.001 |
1.36 (1.32, 1.41) p < 0.001 |
1.00 (0.97, 1.03) p = 0.959 |
| 1 week average | 1.36 (1.31, 1.40) p < 0.001 |
1.36 (1.32, 1.41) p < 0.001 |
1.00 (0.97, 1.04) p = 0.853 |
| 1 day average | 1.37 (1.33, 1.42) p < 0.001 |
1.37 (1.32, 1.41) p < 0.001 |
1.00 (0.96, 1.03) p = 0.874 |
Abbreviations: Group L = patients with baseline measured impedance ≤ 65 ohms, Group M = patients with baseline measured impedance 66–72 ohms; Group H: patients with baseline measured impedance ≥ 73 ohms. HR = Hazard Ratio,
= Adjusted for age, gender and device type.
Incremental Value of Measured Impedance to OptiVol Threshold Crossings
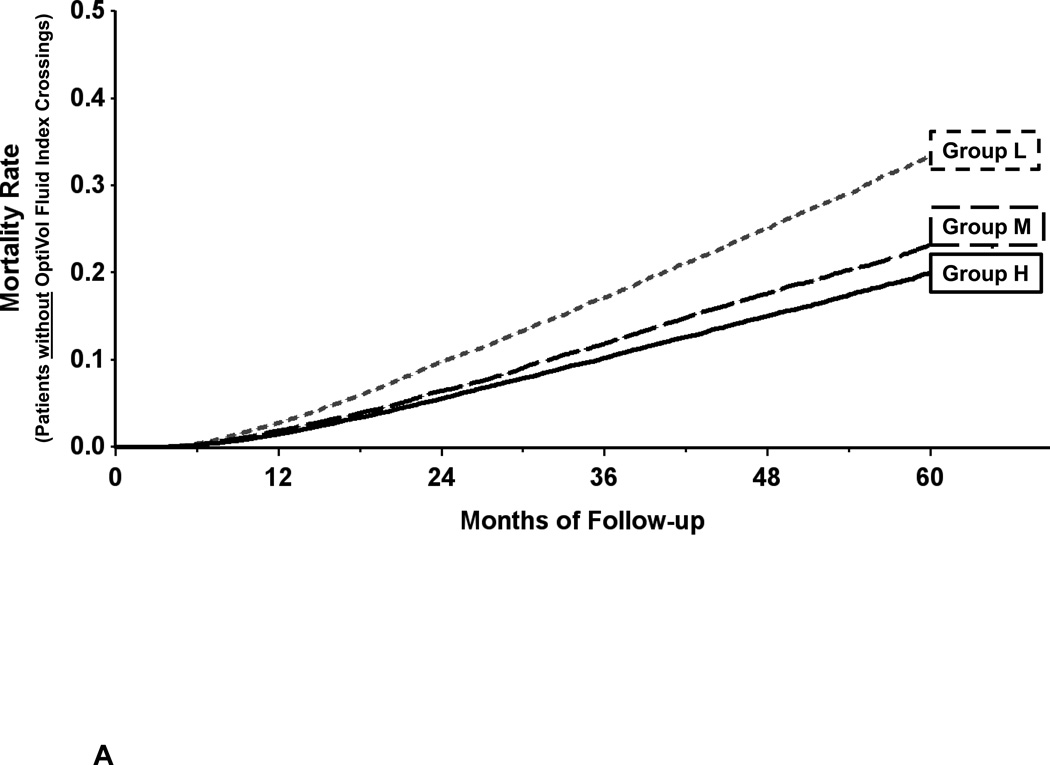
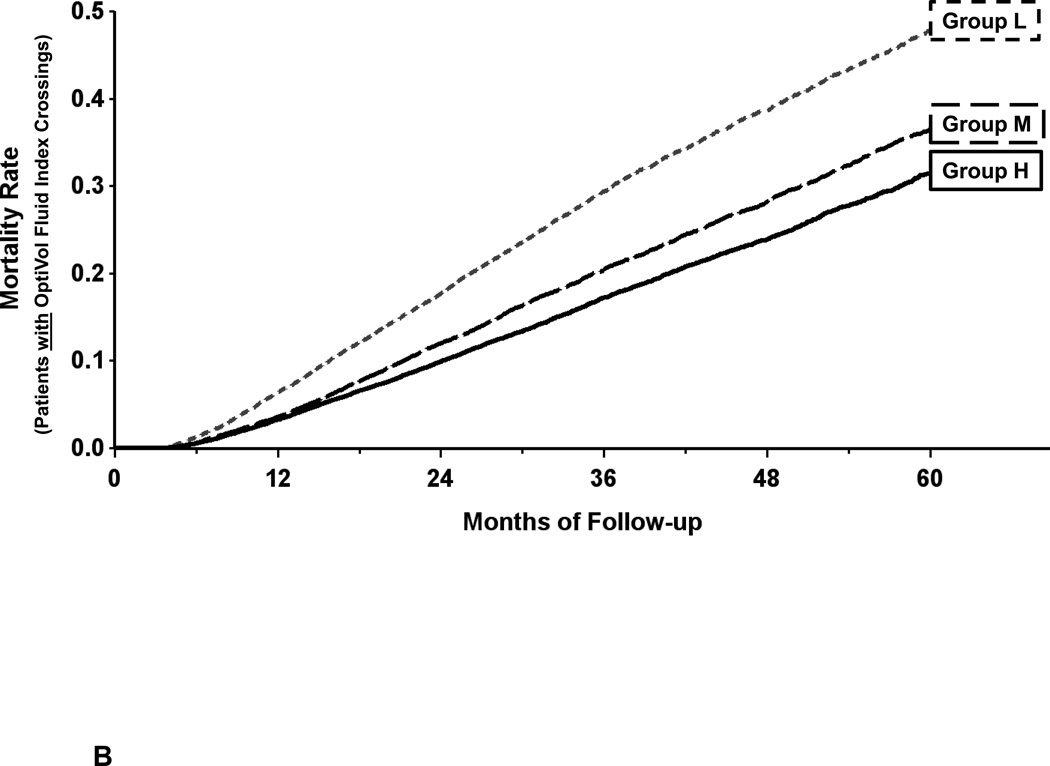
The predictive discrimination for all-cause mortality provided by the baseline (6–9 month) measured impedance in the primary analysis was present in both patients that did not have an OptiVol fluid index threshold crossing during 6–9 months after implantation (Figure 4A) and those that did (Figure 4B). The 5 year mortality for group L patients with threshold crossings (48%) was higher than those without (33%; p < 0.001).Within groups with or without threshold crossings, patients in groups M and H had lower mortality rates than group L patients (p < 0.001 for all pairwise comparisons).
Figure 4.
Incremental value of measured impedance to threshold crossings:
Panel A-. There was predictive discrimination for all-cause mortality provided by the baseline (6–9 month) measured impedance in patients that did not have an OptiVol fluid index threshold crossing.
Panel B- There was predictive discrimination for all-cause mortality provided by the baseline (6–9 month) measured impedance in patients that did have an OptiVol fluid index threshold crossing. However, 5 year mortality was higher in patients with a threshold crossing in L, M, and H groups.
Change in Measured Impedance vs. Survival (Secondary Analysis)
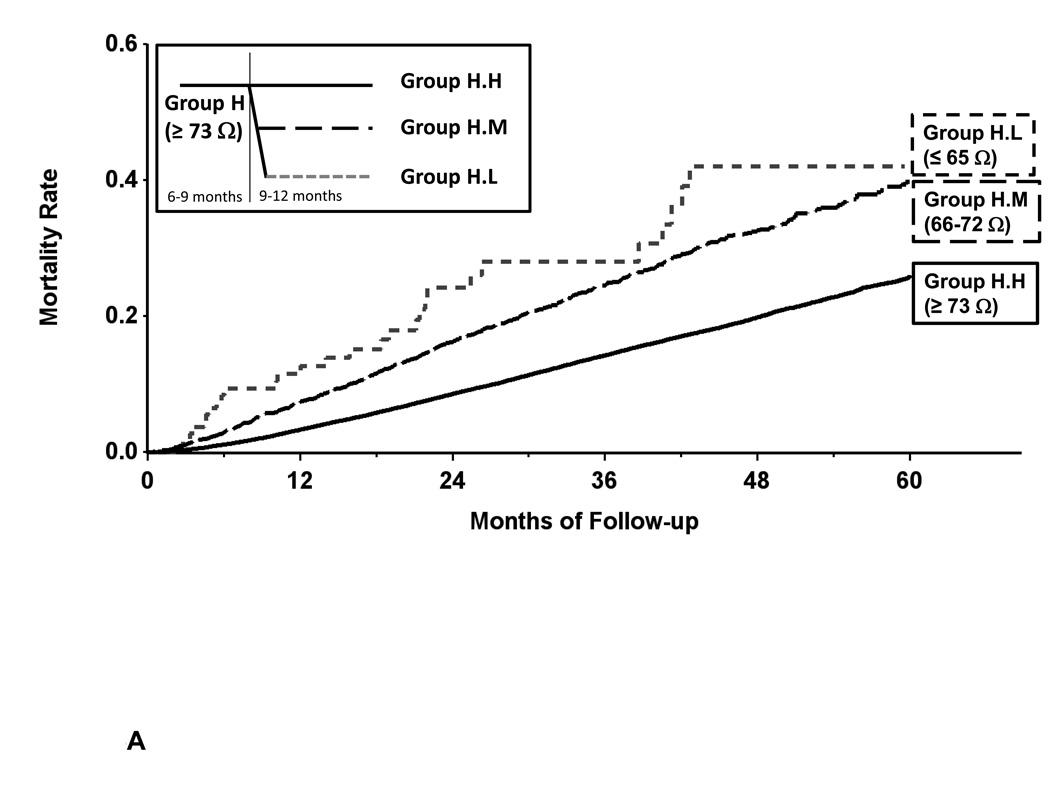
In group H, when there was a decrease in measured impedance during the 9–12 month after implantation period, the subsequent mortality rate increased; this difference in mortality reached statistical significance in groups H.M and H.L (Table 4, Figure 5A). These changes resulted in significant increase in hazard ratios even after adjustment for co-variates of age, gender, device type for groups H.L vs H.M (HR 1.63 [1.12, 2.37]), H.L vs H.H (HR 2.61 [1.81, 3.75]) and H.M vs H.H (HR 1.60 [1.47, 1.73]) all with statistically significant p values.
Table 4.
All-Cause Mortality Predicted by Change From Baseline Measured Impedance
| 6–9 Month | 9–12 Month Comparison | Unadjusted (HR, 95% CI) | Adjusted (HR, 95% CI)* |
|---|---|---|---|
| Group L |
Group L.L vs. L.M (n = 40989 vs 5918) |
1.27 (1.19, 1.36) p < 0.001 |
1.21 (1.13, 1.29) p < 0.001 |
|
Group L.L vs. L.H (n = 40989 vs 118) |
0.66 (0.47, 0.94) p = 0.020 |
0.62 (0.44, 0.88) p = 0.007 |
|
|
Group L.M vs. L.H (n = 5918 vs 118) |
0.52 (0.37, 0.74) p < 0.001 |
0.52 (0.36, 0.73) p < 0.001 |
|
| Group M |
Group M.L vs. M.M (n = 3395 vs 35725) |
2.18 (2.02, 2.35) p < 0.001 |
2.04 (1.89, 2.20) p < 0.001 |
|
Group M.L vs. M.H (n = 3395 vs 6477) |
2.07 (1.88, 2.27) p < 0.001 |
1.80 (1.64, 1.99) p < 0.001 |
|
|
Group M.M vs. M.H (n = 35725 vs 6477) |
0.95 (0.88, 1.02) p = 0.136 |
0.88 (0.82, 0.95) p < 0.001 |
|
| Group H |
Group H.L vs. H.M (n = 123 vs 3289) |
1.44 (1.00, 2.09) p = 0.053 |
1.63 (1.12, 2.37) p = 0.010 |
|
Group H.L vs. H.H (n = 123 vs 45985) |
2.66 (1.85, 3.83) p < 0.001 |
2.61 (1.81, 3.75) p < 0.001 |
|
|
Group H.M vs. H.H (n = 3289 vs 45985) |
1.84 (1.70, 1.99) p < 0.001 |
1.60 (1.47, 1.73) p < 0.001 |
|
Abbreviations: For group definitions see methods section, HR = Hazard Ratio,
= Adjusted for age, gender and device type.
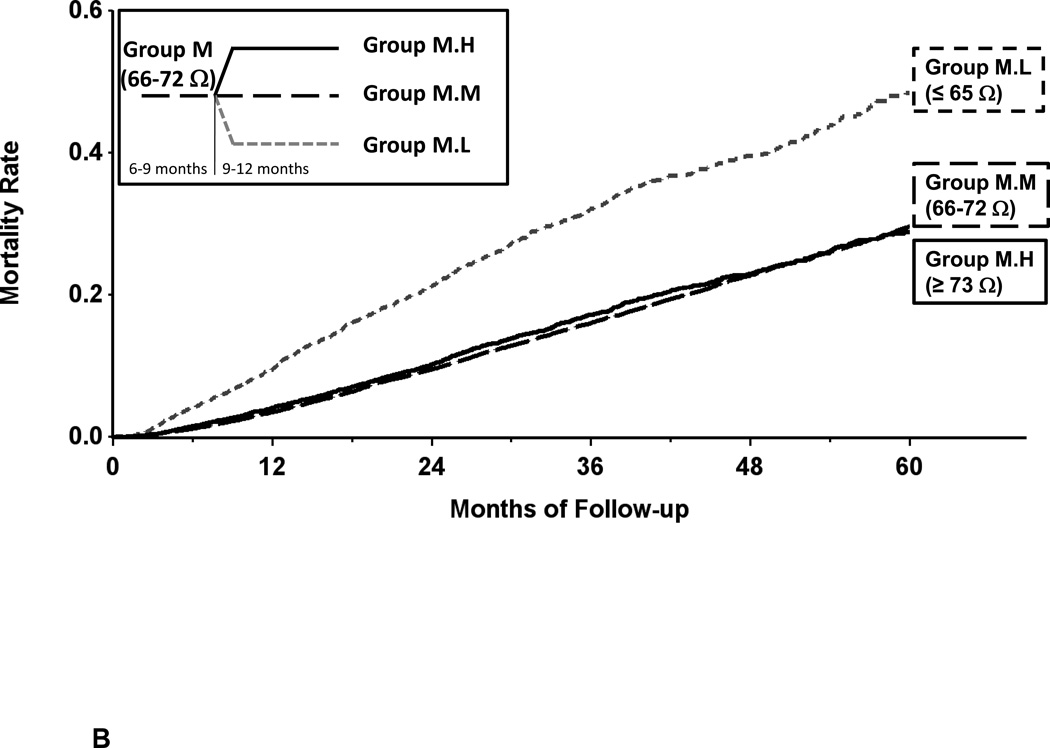
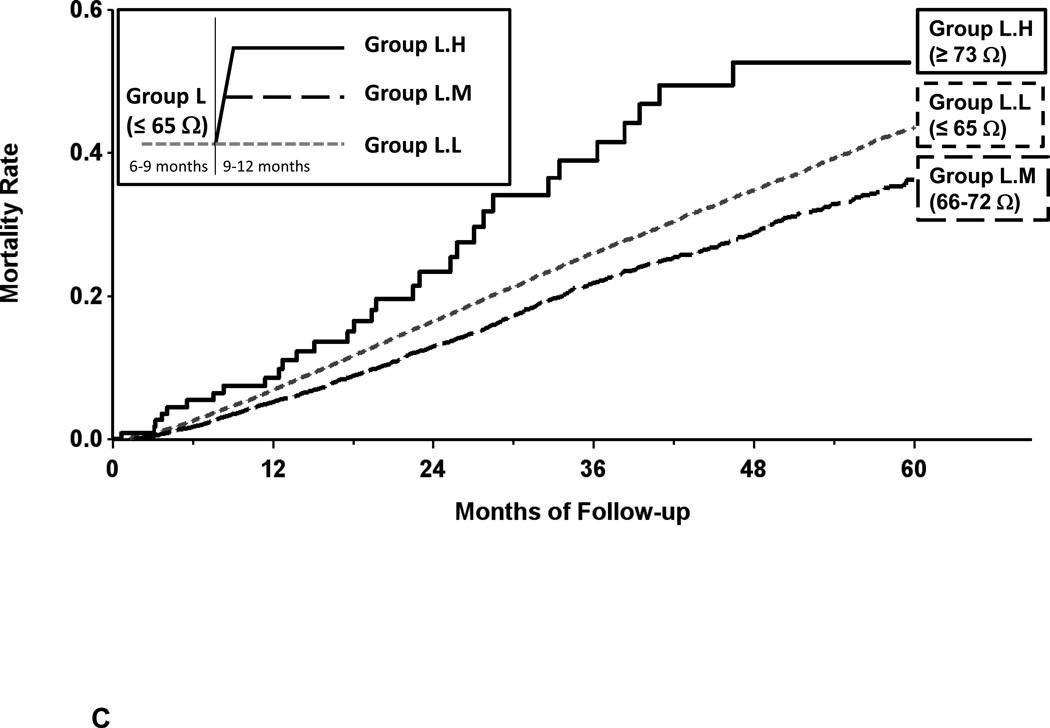
Figure 5.
Panel A- Kaplan-Meier estimate of all-cause mortality in the secondary mortality analysis for patients with changes in baseline measured impedance of ≥ 73 ohms. Decreased measured impedance resulted in increased mortality (group H.L vs H.M and H.H).
Panel B- Kaplan-Meier estimate of all-cause mortality in the secondary mortality analysis for patients with changes in baseline measured impedance 66–72 ohms. Increased measured impedance resulted in decreased mortality (group M.L vs M.M); decreased measured impedance resulted in increased mortality (group M.L vs M.H).
Panel C- Kaplan-Meier estimate of all-cause mortality in the secondary mortality analysis for patients with changes from baseline measured impedance of ≤ 65 ohms. Increased measured impedance resulted in decreased mortality (group L.L vs L.M and L.H).
In group M, when there was an increase in measured impedance during the 9–12 month after implantation period, the subsequent mortality rate decreased; this difference in mortality reached statistical significance in group M.H (Table 4, Figure 5B). When there was a decrease in measured impedance during the 9–12 month after implantation period, the subsequent mortality increased; this difference in mortality reached statistical significance in group M.L. These changes resulted in significant increase in hazard ratios even after adjustment for covariates of age, gender, device type for groups M.L vs M.M (HR 2.04 [1.89, 2.20]), M.L vs M.H (HR 1.80 [1.64, 1.99]) and M.M vs M.H (HR 0.88 [0.82, 0.95]) each comparison p < 0.001. Note that mortality curves in Figure 5B do not show difference between M.M and M.H because they illustrate unadjusted data.
In group L, when there was an increase in measured impedance during the 9–12 month after implantation period to a level of Medium (Figure 5C), the subsequent mortality rate decreased; this difference in mortality reached statistical significance (Table 4). These changes resulted in significant increase in hazard ratios even after adjustment for covariates of age, gender, device type for groups L.L vs L.M (HR 1.21 [1.13, 1.29]). However, when there was a further increase in measured impedance from baseline level L to level H during 9–12 months, mortality rate 12 months post implant increased; for L.M vs L.H HR 0.52 [0.36, 0.73]), both p < 0.001.
Discussion
Despite significant advances in guideline directed therapeutic strategies including beta-blockade, renin-angiotensin-aldosterone antagonism, cardiac resynchronization therapy and implantable cardiac defibrillators, patients with heart failure and a reduced ejection fraction have a 5 year mortality that approaches 50%, frequent hospitalizations for HF, and profound disability (19,20). The ability to accurately identify patients at a high, intermediate or low risk of morbidity and mortality and the ability to accurately identify a change in that risk profile has important management implications. Data from this study suggest that intrathoracic impedance, measured using an implantable device, provides data that can be used to risk stratify patients with ICDs or CRT-D devices. Specifically, directly measured baseline impedance predicts all-cause mortality with patients having lower baseline impedance having higher mortality. The prognostic value of measured impedance is additive to and independent of the OptiVol fluid index. With one exception (see limitations below), changes in directly measured impedance over time resulted in a change in the predicted mortality.
The patient population for whom these findings should have significant application was carefully considered. Because demographic description of the patients described in this study was limited, the implications concerning the application of these results to specific patient populations can only be inferred. However, it is estimated that > 95% of the patients in this study had heart failure with a reduced ejection fraction (HFrEF); patients with a CRT or CRT-D had HFrEF; previous studies have demonstrated that < 10% of ICD patients have HFpEF. Published studies report that only a small portion of ICDs (< 20%) are for secondary prevention, and only a subset of these secondary prevention patients(~30%) have HFpEF (21, 22). Thus, the current study results apply primarily to HFrEF patients, recognizing that only a small portion of the current data (< 5%) may be from HFpEF patients. Thus, in aggregate, because > 95% of the subjects studied were likely to have HFrEF, the conclusions stated above have important implications to predicting mortality and changes in mortality using directly measured impedance in patients with HFrEF.
Previous studies demonstrated that the presence of an OptiVol fluid index crossing was associated with increased mortality (2). In fact, patients with one or more crossings during the first six months after implant were shown to be at 2.15 times higher risk of a mortal event than patients with no OptiVol crossings. The current study demonstrated that the addition of directly measured impedance to the presence or absence of an OptiVol fluid index crossing improved predictive accuracy for mortal events. While the OptiVol fluid index method used data from the first six months after device implantation, in the current study, data from the first six months after implant were excluded; directly measured intrathoracic impedance tends to gradually increase over this period. Thereafter, observation periods of 3 months duration were used to measure baseline impedance or change from baseline. However, observations periods shorter than 3 months were also shown to have utility using the directly measured impedance or change in measured impedance. In fact data presented in this study suggest that directly measured impedance values assessed over time periods as short as 1 day yield similar mortality risk stratification as those reported in the current study using 3-month observation periods. Thus, once stable values of directly measured impedance are obtained after device implant, unlike OptiVol fluid index measurements which require extended observation durations to detect the presence of an OptiVol fluid index crossing, directly measured impedance data can provide data regarding changes in mortality (and potentially morbidity) over time periods that have important clinical value and reflect relatively rapidly changing status.
Contrast to other prognostic models
There are several methods that have been shown to have value in predicting morbidity and mortality in HFrEF patients. These include models based on clinical and demographic factors (such as the Seattle heart failure and MAGGIC models), cardiac structure and function (such as LV remodeling patterns), biomarkers (such as natriuretic peptides), and direct hemodynamic measurements (such as catheterization measurements) (23–32). None of these can be done remotely and continuously and each requires complex and sophisticated methods to assess. Implantable hemodynamic monitoring has been shown to predict morbidity but not mortality based on use of chronic PA pressure estimates of fluid status. The Champion trial showed a trend toward, but no significant reduction in mortality in the treatment group compared to the control group (31). Because of the limitations in the current study design, the use of impedance to predict mortality has not been directly compared to these other techniques to determine its independent value. However, some indirect comparisons may be applicable. A recent study showed that the OptiVol fluid index adds incremental value to established models that predict patient mortality (33). Specifically, OptiVol further stratified mortality risk in patients with medium to high risk based on the MAGGIC model. Given that OptiVol is derived from measured impedance and hence inherently measures similar physiological parameters, it is likely that directly measured impedance too may add incremental value to clinical factors in predicting mortality risk. A large dataset of device patients with relevant clinical factors and mortality events would be needed to examine this hypothesis. Measured impedance has been compared with acute changes in pulmonary capillary wedge pressure (PCWP) (1, 5, 34–36). Both PCWP and NT-proBNP have been shown to be inversely correlated with impedance (i.e. as PCWP and NT-proBNP increase, impedance decreases).
Study limitations
Despite a very large and unbiased view of the device-derived data from a remote monitoring portal, there was limited clinical information concerning covariates that were readily available to enhance our understanding of the underlying mechanisms leading to (or confounding) the current data analyses. Due to de-identification of the data set, there was no information regarding co-morbidities, medication changes, whether changes in measured impedance or OptiVol fluid index threshold crossings led to subsequent HF hospitalizations or therapeutic interventions. The exact cause of death for individual patients was not available, nor a variety of clinical covariates that may influence the prognostic value of measured impedance or OptiVol fluid index data were available. The exclusion from the primary analysis of patients who died during the first 6 months of follow-up, as well as the exclusion from the long-term analysis of patients who died during the first 12 months of follow-up, introduces a survival bias in these analyses. There were likely many clinical factors (both cardiac and non-cardiac) that may have influenced the relatively high mortality rates of patients with implanted devices. It is possible that there were confounding factors that could have been unevenly distributed between the L, M, H impedance patient groups that could not be fully adjusted. These factors may also explain why one of the nine secondary analyses resulted in a higher predicted mortality than expected, when impedance was low and then became high. Given these limitations, the current study should be viewed as hypothesis generating rather than a definitive assessment of the potential utility of impedance monitoring.
Clinical Implications
The direct measurement of impedance has several aspects that make it clinically advantageous. It is simple and requires no mathematical modeling. It provides capability for use as a remote and continuous assessment of volume state. It is a measurement that can be made using a permanently implantable device.
One advantage of measured impedance, specifically over a derived index such as OptiVol, is that a zone of “normal” measured impedance can be established. A deviation from this normal measured impedance range may signify elevated risk, specifically, a decrease in impedance may suggest volume overload. This is similar to a normal PA pressure range within which a patient can then be managed. Furthermore, an OptiVol fluid index can be insensitive to situations in which the patient is chronically volume overloaded or the volume accumulation occurs very slowly (i.e. under conditions in which the reference impedance also changes effectively preventing separation to occur between reference and measured impedance and preventing the calculated cumulative sum to rise). Measured impedance can be a more sensitive to OptiVol for detecting changes in patient status under these circumstances. Furthermore, because impedance provides orthogonal information not captured by OptiVol in certain situations, it may also be added to existing device diagnostics based models to enhance their overall performance (14–17).
Conclusion
Directly measured intrathoracic impedance, measured using an implantable device, provides data that can be used to identify risk stratification in patients with HFrEF. Specifically, baseline measured impedance predicts all-cause mortality. Changes from baseline measured impedance result in a change in the predicted mortality. The prognostic value of directly measured impedance is additive to and independent of the impedance-dependent fluid index. Thus, measured impedance can support risk stratification in chronic heart failure patients.
Clinical Perspective.
Intrathoracic impedance can be assessed using two measurement methods: impedance -derived OptiVol fluid index and direct measurements of impedance itself. The utility of direct measurements of impedance has been not been previously examined. We hypothesized that baseline directly measured impedance predicts all-cause mortality; changes in measured impedance result in a change in the predicted mortality; and the prognostic value of measured impedance is additive to the calculated OptiVol fluid index. A retrospective analysis of 146,238 patients within the Medtronic CareLink data base with implanted devices was performed. Baseline measured impedance was used to divide patients into tertiles; Group L= Low Impedance: ≤ 65 ohms, M= Medium Impedance: 66–72 ohms, H= High Impedance: ≥ 73 ohms. Baseline measured impedance predicted all-cause mortality; 5 year mortality for group L was 41%, M was 29%, H was 25%. Changes in measured impedance resulted in a change in the predicted mortality. The prognostic value of measured impedance was additive to the OptiVol fluid index. Therefore, direct measurements of intrathoracic impedance using an implanted device can be used to stratify patients at varying mortality risk. The ability to accurately identify patients at a high, intermediate or low risk of morbidity and mortality and the ability to accurately identify a change in that risk profile has important management implications. Data from this study suggest that intrathoracic impedance, measured using an implantable device, provides data that can be used to risk stratify patients with ICDs or CRT-D devices.
Acknowledgments
Drs. Zile, received research grants from and served as consultants to Medtronic, Plc.
Drs. Sharma, Warman and Bennett and Mr. Johnson are Medtronic employees.
Sources of Funding
This work was supported by National Institutes of Health grants R56HL123478 (Zile), the Research Service of the Department of Veterans Affairs (5101CX000415-02 and 5101BX000487-04, Zile), and Medtronic, Plc. (Zile).
Footnotes
Disclosures
Dr. Baicu has no disclosures.
References
- 1.Yu CM, Wang L, Chau E, Chan RH, Kong SL, Tang MO, Christensen J, Stadler RW, Lau CP. Intrathoracic impedance monitoring in patients with heart failure: correlation with fluid status and feasibility of early warning preceding hospitalization. Circulation. 2005;112:841–848. doi: 10.1161/CIRCULATIONAHA.104.492207. [DOI] [PubMed] [Google Scholar]
- 2.Tang WH, Warman EN, Johnson JW, Small RS, Heywood JT. Threshold crossing of device-based intrathoracic impedance trends identifies relatively increased mortality risk. European heart journal. 2012;33:2189–2196. doi: 10.1093/eurheartj/ehs121. [DOI] [PMC free article] [PubMed] [Google Scholar]
- 3.Conraads VM, Tavazzi L, Santini M, Oliva F, Gerritse B, Yu CM, Cowie MR. Sensitivity and positive predictive value of implantable intrathoracic impedance monitoring as a predictor of heart failure hospitalizations: the SENSE-HF trial. European heart journal. 2011;32:2266–2273. doi: 10.1093/eurheartj/ehr050. [DOI] [PubMed] [Google Scholar]
- 4.Small RS, Wickemeyer W, Germany R, Hoppe B, Andrulli J, Brady PA, Labeau M, Koehler J, Sarkar S, Hettrick DA, Tang WH. Changes in intrathoracic impedance are associated with subsequent risk of hospitalizations for acute decompensated heart failure: clinical utility of implanted device monitoring without a patient alert. J Card Fail. 2009;15:475–481. doi: 10.1016/j.cardfail.2009.01.012. [DOI] [PubMed] [Google Scholar]
- 5.Wang L. Fundamentals of intrathoracic impedance monitoring in heart failure. Am J Cardiol. 2007;99:3G–10G. doi: 10.1016/j.amjcard.2007.02.009. [DOI] [PubMed] [Google Scholar]
- 6.Abraham WT, Compton S, Haas G, Foreman B, Canby RC, Fishel R, McRae S, Toledo GB, Sarkar S, Hettrick DA FAST Study Investigators. Intrathoracic impedance vs daily weight monitoring for predicting worsening heart failure events: results of the Fluid Accumulation Status Trial (FAST) Congest Heart Fail. 2011;17:51–55. doi: 10.1111/j.1751-7133.2011.00220.x. [DOI] [PubMed] [Google Scholar]
- 7.Soga Y, Ando K, Arita T, Hyodo M, Goya M, Iwabuchi M, Nobuyoshi M. Efficacy of fluid assessment based on intrathoracic impedance monitoring in patients with systolic heart failure. Circ J. 2011;75:129–134. doi: 10.1253/circj.cj-10-0730. [DOI] [PubMed] [Google Scholar]
- 8.Whellan DJ, Ousdigian KT, Al-Khatib SM, Pu W, Sarkar S, Porter CB, Pavri BB, O'Connor CM PARTNERS Study Investigators. Combined heart failure device diagnostics identify patients at higher risk of subsequent heart failure hospitalizations: results from PARTNERS HF (Program to Access and Review Trending Information and Evaluate Correlation to Symptoms in Patients With Heart Failure) study. J Am Coll Cardiol. 2010;55:1803–1810. doi: 10.1016/j.jacc.2009.11.089. [DOI] [PubMed] [Google Scholar]
- 9.Vanderheyden M, Houben R, Verstreken S, Ståhlberg M, Reiters P, Kessels R, Braunschweig F. Continuous monitoring of intrathoracic impedance and right ventricular pressures in patients with heart failure. Circ Heart Fail. 2010;3:370–377. doi: 10.1161/CIRCHEARTFAILURE.109.867549. [DOI] [PubMed] [Google Scholar]
- 10.Catanzariti D, Lunati M, Landolina M, Zanotto G, Lonardi G, Iacopino S, Oliva F, Perego GB, Varbaro A, Denaro A, Valsecchi S, Vergara G Italian Clinical Service OptiVol-CRT Group. Monitoring intrathoracic impedance with an implantable defibrillator reduces hospitalizations in patients with heart failure. Pacing Clin Electrophysiol. 2009;32:363–370. doi: 10.1111/j.1540-8159.2008.02245.x. [DOI] [PubMed] [Google Scholar]
- 11.Tang WH, Tong W. Measuring impedance in congestive heart failure: current options and clinical applications. Am Heart J. 2009;157:402–411. doi: 10.1016/j.ahj.2008.10.016. [DOI] [PMC free article] [PubMed] [Google Scholar]
- 12.Vollmann D, Nägele H, Schauerte P, Wiegand U, Butter C, Zanotto G, Quesada A, Guthmann A, Hill MR, Lamp B European InSync Sentry Observational Study Investigators. Clinical utility of intrathoracic impedance monitoring to alert patients with an implanted device of deteriorating chronic heart failure. Eur Heart J. 2007;28:1835–1840. doi: 10.1093/eurheartj/ehl506. [DOI] [PubMed] [Google Scholar]
- 13.Packer M, Abraham WT, Mehra MR, Yancy CW, Lawless CE, Mitchell JE, Smart FW, Bijou R, O'Connor CM, Massie BM, Pina IL, Greenberg BH, Young JB, Fishbein DP, Hauptman PJ, Bourge RC, Strobeck JE, Murali S, Schocken D, Teerlink JR, Levy WC, Trupp RJ, Silver MA Prospective Evaluation and Identification of Cardiac Decompensation by ICG Test (PREDICT) Study Investigators and Coordinators. Utility of impedance cardiography for the identification of short-term risk of clinical decompensation in stable patients with chronic heart failure. J Am Coll Cardiol. 2006;47:2245–2252. doi: 10.1016/j.jacc.2005.12.071. [DOI] [PubMed] [Google Scholar]
- 14.Cowie MR, Sarkar S, Koehler J, Whellan DJ, Crossley GH, Tang WH, Abraham WT, Sharma V, Santini M. Development and validation of an integrated diagnostic algorithm derived from parameters monitored in implantable devices for identifying patients at risk for heart failure hospitalization in an ambulatory setting. Eur Heart J. 2013;34:2472–2480. doi: 10.1093/eurheartj/eht083. [DOI] [PMC free article] [PubMed] [Google Scholar]
- 15.Gula LJ, Wells GA, Yee R, Koehler J, Sarkar S, Sharma V, Skanes AC, Sapp JL, Redfearn DP, Manlucu J, Tang AS. A novel algorithm to assess risk of heart failure exacerbation using ICD diagnostics: validation from RAFT. Heart Rhythm. 2014;11:1626–1631. doi: 10.1016/j.hrthm.2014.05.015. [DOI] [PubMed] [Google Scholar]
- 16.Sharma V, Rathman LD, Small RS, Whellan DJ, Koehler J, Warman E, Abraham WT. Stratifying patients at the risk of heart failure hospitalization using existing device diagnostic thresholds. Heart Lung. 2015;44:129–136. doi: 10.1016/j.hrtlng.2014.07.007. [DOI] [PMC free article] [PubMed] [Google Scholar]
- 17.Anand IS, Tang WHW, Greenberg BH, Chakravarthy N, Libbus I, Katra RP On Behalf Of The Music Investigators. Design and Performance of a Multisensor Heart Failure Monitoring Algorithm: Results From the Multisensor Monitoring in Congestive Heart Failure (MUSIC) Study. Journal of Cardiac Failure. 2012;18:289–295. doi: 10.1016/j.cardfail.2012.01.009. [DOI] [PubMed] [Google Scholar]
- 18.van Veldhuisen DJ, Braunschweig F, Conraads V, Ford I, Cowie MR, Jondeau G, Kautzner J, Aguilera RM, Lunati M, Yu CM, Gerritse B, Borggrefe M DOT-HF Investigators. Intrathoracic impedance monitoring, audible patient alerts, and outcome in patients with heart failure. Circulation. 2011;124:1719–1726. doi: 10.1161/CIRCULATIONAHA.111.043042. [DOI] [PubMed] [Google Scholar]
- 19.Yancy CW, Jessup M, Bozkurt B, Butler J, Casey DE, Jr, Drazner MH, Fonarow GC, Geraci SA, Horwich T, Januzzi JL, Johnson MR, Kasper EK, Levy WC, Masoudi FA, McBride PE, McMurray JJ, Mitchell JE, Peterson PN, Riegel B, Sam F, Stevenson LW, Tang WH, Tsai EJ, Wilkoff BL American College of Cardiology Foundation/American Heart Association Task Force on Practice Guidelines. 2013 ACCF/AHA guideline for the management of heart failure: a report of the American College of Cardiology Foundation/American Heart Association Task Force on practice guidelines. Circulation. 2013;128:e240–e327. doi: 10.1161/CIR.0b013e31829e8776. [DOI] [PubMed] [Google Scholar]
- 20.McMurray JJ1, Adamopoulos S, Anker SD, Auricchio A, Böhm M, Dickstein K, Falk V, Filippatos G, Fonseca C, Gomez-Sanchez MA, Jaarsma T, Køber L, Lip GY, Maggioni AP, Parkhomenko A, Pieske BM, Popescu BA, Rønnevik PK, Rutten FH, Schwitter J, Seferovic P, Stepinska J, Trindade PT, Voors AA, Zannad F, Zeiher A ESC Committee for Practice Guidelines. ESC Guidelines for the diagnosis and treatment of acute and chronic heart failure 2012: The Task Force for the Diagnosis and Treatment of Acute and Chronic Heart Failure 2012 of the European Society of Cardiology. Developed in collaboration with the Heart Failure Association (HFA) of the ESC. Eur Heart J. 2012;33:1787–1847. doi: 10.1093/eurheartj/ehs104. [DOI] [PubMed] [Google Scholar]
- 21.Ezekowitz JA, Armstrong PW, McAlister FA. Implantable cardioverter defibrillators in primary and secondary prevention: a systematic review of randomized, controlled trials. Ann Intern Med. 2003;138:445–452. doi: 10.7326/0003-4819-138-6-200303180-00007. [DOI] [PubMed] [Google Scholar]
- 22.Yousuf O, Chrispin J, Tomaselli GF, Berger RD. Clinical management and prevention of sudden cardiac death. Circ Res. 2015;116:2020–2040. doi: 10.1161/CIRCRESAHA.116.304555. [DOI] [PubMed] [Google Scholar]
- 23.Zile MR, Gaasch WH, Patel K, Aban IB, Ahmed A. Adverse Left Ventricular Remodeling and Incident Heart Failure in Community-Dwelling Older Adults. JACC Heart Fail. 2014;2:512–522. doi: 10.1016/j.jchf.2014.03.016. [DOI] [PubMed] [Google Scholar]
- 24.Lieb W, Gona P, Larson MG, Aragam J, Zile MR, Cheng S, Benjamin EJ, Vasan RS. The Natural History of Left Ventricular Geometry in the Community: Clinical Correlates and Prognostic Significance of Change in LV Geometric Pattern. J Am Coll Cardiol Img. 2014;7:870–878. doi: 10.1016/j.jcmg.2014.05.008. [DOI] [PMC free article] [PubMed] [Google Scholar]
- 25.Gaasch WH, Zile MR. Left Ventricular Structural Remodeling In Health And Disease: With Special Emphasis on Volume, Mass, and Relative Wall Thickness. J Am Coll Cardiol. 2011;58:1733–1740. doi: 10.1016/j.jacc.2011.07.022. [DOI] [PubMed] [Google Scholar]
- 26.Choudhary R, Iqba Nl, Khusro F, Higginbotham E, Green E, Maisel A. Heart Failure Biomarkers. Journal of Cardiovascular Translational Research. 2013;6:471–484. doi: 10.1007/s12265-013-9465-0. [DOI] [PubMed] [Google Scholar]
- 27.Zile MR, Baicu CF. Biomarkers of Diastolic Dysfunction and Myocardial Fibrosis: Application to Heart Failure with Preserved Ejection Fraction. J Cardiovasc Transl Res. 2013;6:501–515. doi: 10.1007/s12265-013-9472-1. [DOI] [PubMed] [Google Scholar]
- 28.Meta-analysis Global Group in Chronic Heart Failure (MAGGIC) The survival of patients with heart failure with preserved or reduced left ventricular ejection fraction: an individual patient data meta-analysis. Eur Heart J. 2012;33:1750–1757. doi: 10.1093/eurheartj/ehr254. [DOI] [PubMed] [Google Scholar]
- 29.Lee DS, Gona P, Vasan RS, Larson MG, Benjamin EJ, Wang TJ, Tu JV, Levy D. Relation of disease pathogenesis and risk factors to heart failure with preserved or reduced ejection fraction: insights from the Framingham Heart Study of the National Heart, Lung, and Blood Institute. Circulation. 2009;119:3070–3077. doi: 10.1161/CIRCULATIONAHA.108.815944. [DOI] [PMC free article] [PubMed] [Google Scholar]
- 30.Levy WC, Mozaffarian D, Linker DT, Sutradhar SC, Anker SD, Cropp AB, Anand I, Maggioni A, Burton P, Sullivan MD, Pitt B, Poole-Wilson PA, Mann DL, Packer M. The Seattle Heart Failure Model: prediction of survival in heart failure. Circulation. 2006;113:1424–1433. doi: 10.1161/CIRCULATIONAHA.105.584102. [DOI] [PubMed] [Google Scholar]
- 31.Abraham WT, Adamson PB, Bourge RC, Aaron MF, Costanzo MR, Stevenson LW, Strickland W, Neelagaru S, Raval N, Krueger S, Weiner S, Shavelle D, Jeffries B, Yadav JS CHAMPION Trial Study Group. Wireless pulmonary artery haemodynamic monitoring in chronic heart failure: a randomised controlled trial. Lancet. 2011;377:658–666. doi: 10.1016/S0140-6736(11)60101-3. [DOI] [PubMed] [Google Scholar]
- 32.Adamson PB, Abraham WT, Bourge RC, Costanzo MR, Hasan A, Yadav C, Henderson J, Cowart P, Stevenson LW. Wireless pulmonary artery pressure monitoring guides management to reduce decompensation in heart failure with preserved ejection fraction. Circ Heart Fail. 2014;7:935–944. doi: 10.1161/CIRCHEARTFAILURE.113.001229. [DOI] [PubMed] [Google Scholar]
- 33.Manlucu J, Sharma V, Koehler J, Warman EN, Wells GA, Gula LJ, Yee R, Tang AS. The Incremental Value of Thoracic Impedance Derived Fluid Index Measurements Over Clinical Parameters to Predict Mortality in a Heart Failure Population. Heart Rhythm. 2015;12:S102–S103. [Google Scholar]
- 34.Lüthje L, Vollmann D, Drescher T, Schott P, Zenker D, Hasenfuss G, Unterberg C. Intrathoracic impedance monitoring to detect chronic heart failure deterioration: relationship to changes in NT-proBNP. Eur J Heart Fail. 2007;9:716–722. doi: 10.1016/j.ejheart.2007.03.005. [DOI] [PubMed] [Google Scholar]
- 35.Tomasi L, Zanotto G, Zanolla L, Golia G, Ometto R, Bonanno C, Vergara G, Maines M, Lonardi G, Visentin E, Rauhe W, Latina L, Perrone C, Varbaro A, DE Santo T IMPATTO (Studio osservazionale per la validazione dell'IMPedenzA Trans-TOracica) Study group. Physiopathologic correlates of intrathoracic impedance in chronic heart failure patients. Pacing Clin Electrophysiol. 2011;34:407–413. doi: 10.1111/j.1540-8159.2010.02979.x. [DOI] [PubMed] [Google Scholar]
- 36.Rademaker MT, Charles CJ, Melton IC, Richards AM, Frampton CM, Siou J, Qu F, Eigler NL, Gutfinger D, Troughton RW. Monitoring of heart failure: comparison of left atrial pressure with intrathoracic impedance and natriuretic peptide measurements in an experimental model of ovine heart failure. Clin Sci (Lond) 2011;120:207–217. doi: 10.1042/CS20100388. [DOI] [PMC free article] [PubMed] [Google Scholar]


