Abstract
We have developed laser-diode-based optical-resolution photoacoustic microscopy (LD-OR-PAM) of superficial microvasculature which has the desirable properties of being compact, low-cost, and label-free. A 300-mW visible pulsed laser diode was operated at a 405 ± 5 nm wavelength with a pulse energy as low as 52 nJ. By using a 3.6 MHz ultrasound transducer, the system was tested on carbon fibers with a lateral resolution of 0.95 µm and an SNR of 38 dB. The subcutaneous microvasculature on a mouse back was imaged without an exogenous contrast agent which demonstrates the potential of the proposed prototype for skin chromophores. Our eventual goal is to offer a practical and affordable multi-wavelength functional LD-OR-PAM instrument suitable for clinical applications.
OCIS codes: (170.3880) Medical and biological imaging, (110.5120) Photoacoustic imaging, (170.0110) Imaging systems, (180.0180) Microscopy, (140.2020) Diode lasers
1. Introduction
Recently, optical-resolution photoacoustic (PA) microscopy (OR-PAM) has made significant progress in anatomical, functional, and metabolic contrast imaging [1–3]. It has approached the stage where clinical instrumentation may become available in the near future. In comparison with conventional optical microscopy, OR-PAM can provide higher optical absorption contrast and label-free imaging capability at specific wavelengths for major subsurface skin chromophores [4–8]. One of the main drawbacks that may hinder clinical adoption is the need for bulky and expensive Q-switched nanosecond-pulsed solid-state laser systems which usually employ wavelength-tunable accessories for molecular and spectroscopic imaging, such as an optical parametric oscillator.
An attractive alternative is a semiconductor laser source which is relatively simple, inexpensive, compact, and robust for noninvasive PA imaging [9,10]. Moreover, it is widely available in the visible (VIS) to near-infrared (NIR) spectrum with a pulse repetition frequency up to a megahertz. The technological challenge of this alternative is that the low output peak power is typically limited to < 200 W to avoid catastrophic optical damage (COD) at the emission facet of the laser diode. Some commercial pulsed laser diodes (10-200 W peak power) operating in the NIR region of 750-1550 nm have been investigated before with a coded excitation [11–15] and/or hundreds of signal averaging [16–19] for a detectable signal-to-noise ratio (SNR). In the past two years, the NIR pulsed laser diode has been employed with hundreds of signal averaging on an OR-PAM mode, which needs relatively low pulse optical energy to achieve a micron-scale lateral resolution [20–22]. In the VIS region (400-650 nm), blood has a relatively strong absorption (> 10 cm−1) and the background absorption of water in tissue is weak (< 0.01 cm−1), which could be applied for label-free PA imaging of superficial vasculature. Most available VIS laser diodes have a lower power output of a few hundred milliwatts and operate in continuous-wave (CW) mode. In this work, we present a VIS laser-diode-based OR-PAM (LD-OR-PAM) system using a low-cost pulsed laser diode excitation which has a compact size of 1.8 × 1.2 × 1.2 cm3. In comparison to our NIR LD-OR-PAM [21,22], it has a lower pulse energy (52 nJ vs. 14 µJ) and a higher lateral resolution (0.95 µm vs. 1.5 µm). After low-pass filtering, the effective PA signal has an upper SNR of ~22 dB without signal averaging. Ex vivo imaging of subcutaneous microvasculature on a mouse back has been demonstrated without an exogenous contrast agent. The image contrast was improved primarily due to stronger absorption of the VIS wavelength by blood, which can provide label-free biomolecule detection with high sensitivity and specificity. The preliminary proof-of-concept prototype represents an encouraging step towards a clinical transition of OR-PAM technology.
2. Methods and materials
A VIS-pulsed laser diode (SLD3237VFR, Sony, Japan) was used as a PA excitation source at a wavelength of 405 ± 5 nm. It is the first blue-violet laser diode with a pulsed output peak power of 350 mW or higher. The laser diode uses a new end-face coating material to raise the optical output threshold and prevent COD. It achieves operation at a high temperature up to 90°C with a 3.8 mm diameter mount as shown in Fig. 1(a). Figure 1(b) shows a photograph of the laser diode excitation assembled with collimating lens, and its compact volume is only 1.8 × 1.2 × 1.2 cm3. The collimated laser has a beam diameter of ~4 mm and a full-angle divergence of 2.0 mrad. The pulse width of the diode laser is measured to be 174 ns as shown in Fig. 1(c), and the pulse repetition rate is 1 kHz. An aspheric objective lens (C671TME-405, Thorlabs, USA) with a numerical aperture (NA) of 0.60 was employed to achieve microscope optical illumination, which has a working distance of 2.12 mm. The CA of the objective lens is 4.80 mm, and the effective focal length is 4.01 mm. The custom-built driving circuit of the laser diode also has a compact size of 7 × 4 cm2, and the total laser diode excitation is fixed on a miniature three-dimensional (3D) motorized stage for raster scanning.
Fig. 1.
(a) Photo of the compact laser diode compared with a quarter coin. (b) Photo of the assembled laser diode excitation. (c) Pulse width of the laser diode.
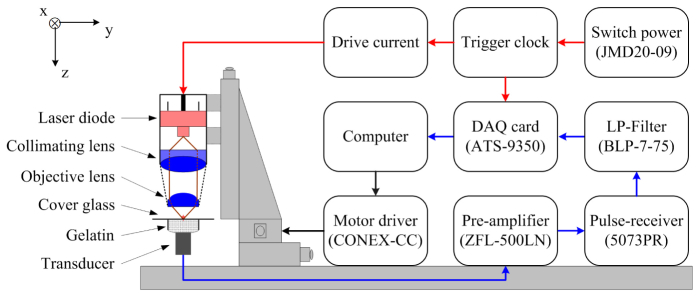
The schematic diagram of the VIS LD-OR-PAM prototype is depicted in Fig. 2. An ultrasonic transducer (V382-SU, Olympus, Japan) was used as a PA sensor with a center frequency of 3.6 MHz and a −6 dB bandwidth of 61.8%. A plastic tube filled with ultrasound gel was fixed on the upper end of the transducer so that the phantom could be placed on it with a piece of micro cover glass. The ultrasound gel was used to couple the sound from the phantom to the transducer. The excited PA wave was detected in forward mode and converted into a voltage signal by the transducer, and further amplified by a low-noise preamplifier. Then the voltage signal was followed by a pulse-receiver and a low-pass filter with a cutoff frequency of about 7.0 MHz for optimizing the SNR. A pulsed clock was sent to trigger a 12-bit digitizer card for a series of data acquisitions. The trigger signal was synchronized with the clock-out signal from the laser diode driver. In the 3D scanning process, the raster scanning was implemented by translating the total laser diode excitation along the horizontal x-y plane. In the experiments, the ultrasound velocity was assumed to be 1.5 µm/ns for imaging reconstruction.
Fig. 2.
Schematic diagram of the VIS LD-OR-PAM system.
3. Results
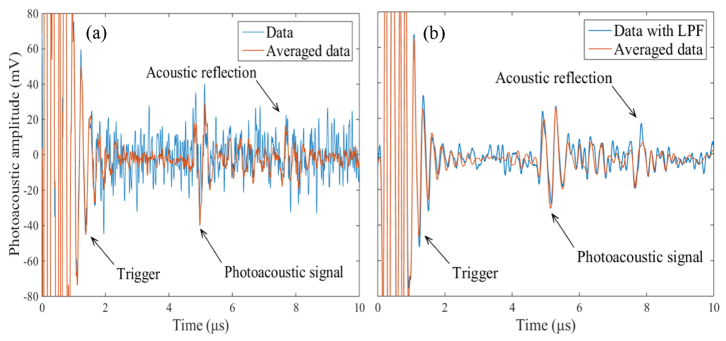
Due to the low power of the VIS laser diode, special attention should be paid to the noise level of the VIS LD-OR-PAM system. Figure 3(a) gives a typical time-resolved transient pressure along the z-axis captured from a human hair. It can be seen that the effective PA signal and acoustic reflection was hidden in the background noise, and the detectable SNR can be improved by performing signal averaging. For comparison, Fig. 2(b) gives the corresponding transient pressure after a 7.0 MHz low-pass filtering. It can be seen that the high-frequency stochastic noise has been filtered effectively, and the effect of signal averaging further minimized the noise. The PA signal is dominated by the frequency components below ~5.7 MHz bandwidth according to the reciprocal of the pulse width of 174 ns, resulting in a predominance of lower frequency-dependent acoustic attenuation. The effective PA signal has a peak-to-peak voltage of ~50 mV and an upper SNR of ~22 dB. Meanwhile, the trigger signal has a peak-to-peak voltage more than 160 mV with a duration time of ~2.0 μs. In addition to the stochastic thermal noise, a signal averaging of 16 times was implemented to deal with the unwanted interference signals stemming from the drivers of the laser diode and motorized stages.
Fig. 3.
(a) Time-resolved PA signal from a human hair averaged 1 time and 16 times. (b) Corresponding PA signal after low-pass filtering averaged 1 time and 16 times. LPF: Low-pass filtering.
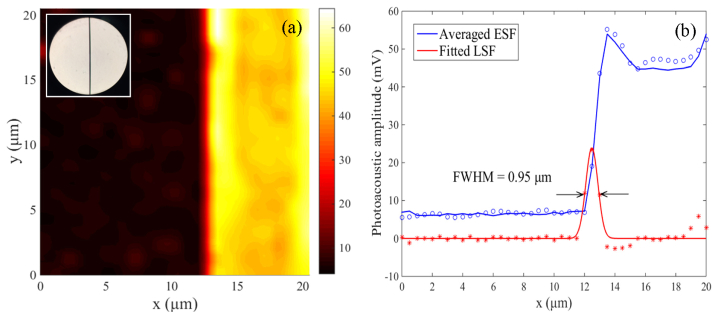
To measure the lateral resolution of the VIS LD-OR-PAM system, the edge of a carbon fiber (AGM-94, Asbury Carbons, USA) was imaged in water medium as shown in Fig. 4(a), inset with its optical microscopy image (diameter, ~7 μm) by a 40 × objective. The sharp edge of the carbon fiber is clearly imaged with a SNR as high as 38 dB, and the PA amplitude of the fiber center has a slight reduction due to its cylindrical shape. Figure 4(b) gives a cross-sectional profile of the image at y = 10 µm, and the edge-spread function (ESF) was estimated by averaging the edge of the carbon fiber along the y-axis. The line-spread function (LSF) was extracted from the derivative of the ESF and was fitted to a Gaussian function [A*exp(-((x-B)/C)2], where A = 23.88, B = 12.48, and C = 0.5633. According to the full-width-half-maximum (FWHM), the lateral resolution was estimated to be ~0.95 µm.
Fig. 4.
(a) MAP image of a ~7 µm carbon fiber edge. Inset: optical image with a 40X objective. (b) Lateral resolution of the VIS LD-OR-PAM defined by the averaged edge-spread function (ESF) and its derivative.
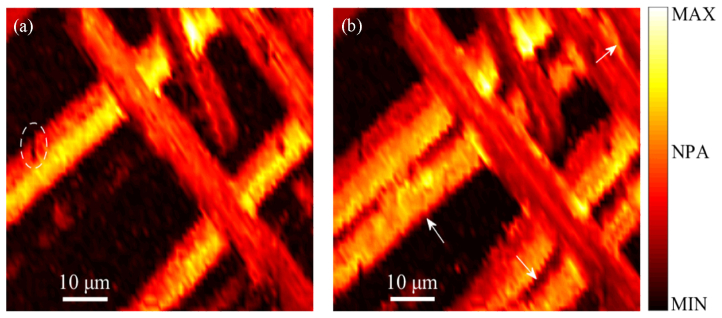
To demonstrate the imaging capability of the proposed system, we imaged a milled carbon fiber network as small as capillary-sized blood vessels. The carbon fibers were suspended in the viscous ultrasound gel. An imaging field-of-view (FOV) of 80 × 50 µm2 was scanned with a step size of 1 µm. Figure 5(a) gives a cross-sectional image of the carbon fiber network in a superficial layer which has a distance (in the z-axis) of ~5.07 mm to the transducer. The depth information along the z-axis was derived from the acoustic flight time of the PA waves. It can be seen that the relative position and surface flaws of the carbon fibers were clearly visualized. Because of the high-NA objective in VIS LD-OR-PAM, some carbon fibers will be away from the optical focal zone. Figure 5(b) gives a MAP image which was obtained by scanning the laser spot along the z-axis with a 5-µm step. It can be seen that several missing carbon fibers appear in the desired imaging range, and some image blurring may be caused by a difference between the focal zone and z scanning step.
Fig. 5.
(a) Cross-sectional image of the carbon fiber network. (b) MAP image by depth-scanning; arrows and ellipses denote carbon fibers and surface flaws, respectively. NPA: Normalized photoacoustic amplitude.
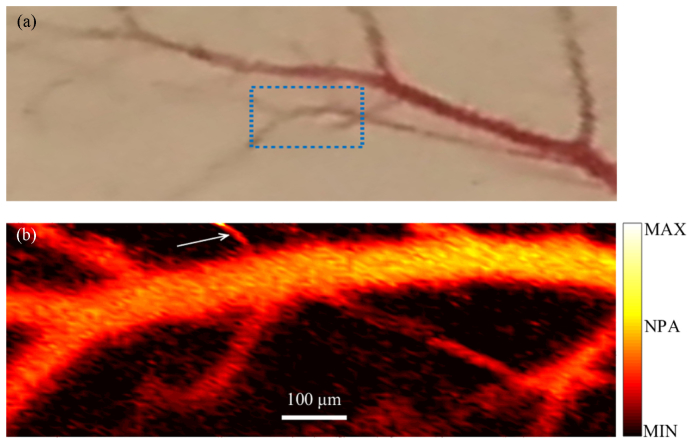
The label-free imaging feasibility of VIS LD-OR-PAM was validated by resolving subcutaneous microvasculature on a mouse back ex vivo. Before the experiment, the hair was gently removed from the skin with depilatory lotion as shown in Fig. 6(a), and a thin layer of ultrasound gel was applied to the mouse skin. An imaging FOV of 990 × 330 µm2 was scanned with a step size of 5 µm and a signal averaging of 512 pulses. In Fig. 6(b), the PAM image of the microvasculature agrees with the photograph taken with a camera. However, small vessels are observed only in the PAM image. The branches of the major blood vessel (diameter, ~100 μm) are clearly resolved. Some vessels, such as the vessel labeled with the black arrow, have a diameter of ~15 µm and, hence, are capillaries. Also, some blood vessels are degraded due to the blood coagulation. However, the current transmission-mode OR-PAM can image only a thin sample and is not suitable for in vivo applications. By contrast, reflection-mode OR-PAM is not limited by the sample thickness. A number of methods have been reported previously for reflection model PAM, including ring-shape transducer, optical-acoustic combiner, and dark-field objective, respectively [23]. With similar modifications, our VIS LD-OR-PAM system can be adapted to operate in reflection mode, which can potentially be applied to more anatomical sites in vivo.
Fig. 6.
(a) Photo of subcutaneous microvasculature on a mouse back. (b) Ex vivo MAP image acquired with VIS LD-OR-PAM; arrow denotes a blood capillary with a diameter of ~15 µm.
4. Discussions and conclusions
Noise is the fundamental limitation of PAM detection with a low-power laser diode excitation which mainly arises from thermal noise of the ultrasonic transducer and electronic noise of the electronic devices. The amplitude of the PA signal is directly proportional to the pulse energy of the laser when the stress confinement condition is satisfied. For example, a Q-switched laser pulse (5 mJ energy output) would produce a SNR that is five orders of magnitude (50 dB) greater than that generated by the current laser diode, ignoring optical and acoustic attenuation. Certainly, the noise could be improved by performing abundant signal averaging over a short period of time at the expense of imaging speed. Alternatively, another noise reduction solution is to decrease the detection frequency and bandwidth of the ultrasonic transducer and its associated electronics [23,24]. Low-frequency narrow-band ultrasonic transducers can readily achieve a high filtering efficiency of the noise contributions from the medium and transducer. For example, in the CW excitation mode of a laser diode, a 2.45 MHz narrow-band ultrasonic transducer can be used with a lock-in amplifier to improve the SNR to as high as 43 dB without signal averaging, compared with its pulsed excitation counterpart with a detection bandwidth of tens of megahertz [11].
On the other hand, the axial resolution of PAM is directly related to the transducer bandwidth of time-resolved ultrasonic detection, which is usually linearly proportional to the center frequency of the transducer, f0. Thus, higher axial resolution could be achieved with a greater f0. The current VIS LD-OR-PAM system has achieved submicron lateral resolution, but due to the low f0, its axial resolution only reaches a level of a few hundred microns, which is the most conspicuous limitation of 3D imaging with a highly asymmetric voxel. To enhance the axial resolution, the usual way is to increase the f0 by using a shorter burst laser beam, and the current laser diode could achieve a duration of 30 ns at a 50% duty cycle. Although promising, the finest axial resolution still remains much worse than the lateral resolution (~15 µm axial resolution at 75 MHz) [25]. In addition, the high-frequency ultrasound will also inversely decrease the detection SNR and penetration depth because of acoustic dispersion and attenuation. So far, ~1.2 µm axial resolution has been reported with a 1.2 GHz ultra-high frequency transducer for an imaging range of tens of microns (~400 dB/mm at 1 GHz) [26]. Therefore, simply increasing the transducer frequency doesn’t appear to be an effective approach to a more symmetric voxel in an axial direction. Fortunately, there are still several other viable methods to improve the axial resolution to several microns for OR-PAM, such as deconvolution [27], slow-sound coupling [28], and Grueneisen relaxation [29]. Frequency encoding technique has been used to achieve 1.0 µm axial resolution of bovine erythrocytes with a 5 MHz ultrasonic transducer in OR-PAM [30].
The lateral resolution of OR-PAM is only determined by the optical wavelength and the NA of the optical objective lens, unlike that of AR-PAM which is related to the f0. In practice, the lateral resolution of the current LD-OR-PAM system is about 1.7 times more than the root-mean-square spot radius of the objective lens (~0.57 µm at 408 nm), probably because of the large laser emitting area of the laser diode, which emits a non-rotationally symmetric beam with a large divergence angle of 19 degrees in the perpendicular axis (‘fast axis’) and 9 degrees in the parallel axis (‘slow axis’). Certainly, a micrometer-level pinhole could be used for spatial filtering to improve the spot quality at the cost of optical energy loss. Alternatively, an optimized design of focusing optics similar to the optical head of Blu-ray data storage may be another choice. For example, the same model laser diode combined with a fiber-axicon has been explored for direct-laser writing fabrication with a precision of ± 0.5 µm [31].
At 405 nm, the maximum permissible exposure (MPE) on the skin surface by pulsed laser is ~22.46 mJ/cm2 (1.1 × CA × t0.25 J/cm2 within an exposure duration t between 100 ns and 10 s, where CA = 1 for 400 < λ < 700 nm), as governed by the American National Standards Institute (ANSI) safety standard [32]. In the VIS LD-OR-PAM system, the laser diode was operated with a laser duration of 174 ns and laser energy of 52 nJ per pulse. Regardless of the optics loss, the peak power density at the focus spot was ~4.2 × 10⁷ W/cm2, which is at least three orders of magnitude lower than that of two-photon microscopy (1010-1012 W/cm2). Assuming that the depth of the laser focus is 50 µm below the skin surface, the calculated surface optical fluence is ~1.85 mJ/cm2, almost 12 times of magnitude less than the ANSI safety limits. Generally, the weaker the optical fluence, the lower chance of tissue thermal damage there will be, even under the ANSI safety threshold. In addition, the molar extinction coefficient of hemoglobin (Hb) and oxyhemoglobin (HbO2) has its highest absorption peak in the 405-420 nm blue regions (up to 500 mM−1cm−1) for blood imaging. However, the penetration of blue light is superficial due to tremendous absorption of skin chromophores such as melanin. Moving to the 500 nm range, there are three absorption peaks of Hb and HbO2 at 538, 550, and 578 nm (53-55 mM−1cm−1). There is an order of magnitude less than that in the blue region, but it still represents tremendous absorption in comparison to the NIR region (e.g., 850, 905, and 1550 nm for a commercial high-power laser diode). Therefore, the further development of VIS LD-OR-PAM has the significant potential to provide noninvasive functional imaging with multi-wavelength laser diodes.
In summary, we demonstrated the potential of a compact and label-free OR-PAM using a low-cost VIS pulsed laser diode. The lateral resolution was estimated to be ~0.95 µm for imaging carbon fibers with a SNR up to 38 dB. The subcutaneous microvasculature on a mouse was clearly resolved without any contrast agent. The proposed VIS LD-OR-PAM has been demonstrated as a promising tool for label-free imaging in superficial tissue. Our next work will focus on reflection-mode real-time VIS LD-OR-PAM with laser fast-scanning and multi-wavelength laser diodes.
Acknowledgments
This work was sponsored in part by the National Institutes of Health (NIH) (R01EY-021529, R01HL-125084, R01HL-127271, and P41-EB015890), the National Natural Scientific Foundation of China (NSFC) (11304129), and the Science and Technology Program of Jiangxi Province (20143BBM26053, 20151BAB217025).
References and links
- 1.Wang L. V., Hu S., “Photoacoustic tomography: in vivo imaging from organelles to organs,” Science 335(6075), 1458–1462 (2012). 10.1126/science.1216210 [DOI] [PMC free article] [PubMed] [Google Scholar]
- 2.Yao J., Wang L., Yang J. M., Maslov K. I., Wong T. T. W., Li L., Huang C. H., Zou J., Wang L. V., “High-speed label-free functional photoacoustic microscopy of mouse brain in action,” Nat. Methods 12(5), 407–410 (2015). 10.1038/nmeth.3336 [DOI] [PMC free article] [PubMed] [Google Scholar]
- 3.Jathoul A. P., Laufer J., Ogunlade O., Treeby B., Cox B., Zhang E., Johnson P., Pizzey A. R., Philip B., Marafioti T., Lythgoe M. F., Pedley R. B., Pule M. a., Beard P., “Deep in vivo photoacoustic imaging of mammalian tissues using a tyrosinase-based genetic reporter,” Nat. Photonics 9(4), 239–246 (2015). [Google Scholar]
- 4.Yuan Y., Yang S., Xing D., “Optical-resolution photoacoustic microscopy based on two-dimensional scanning galvanometer,” Appl. Phys. Lett. 100(2), 023702 (2012). 10.1063/1.3675907 [DOI] [Google Scholar]
- 5.Xiang L., Wang B., Ji L., Jiang H., “4-D photoacoustic tomography,” Sci. Rep. 3, 1113 (2013). 10.1038/srep01113 [DOI] [PMC free article] [PubMed] [Google Scholar]
- 6.Yang Z., Chen J., Yao J., Lin R., Meng J., Liu C., Yang J., Li X., Wang L., Song L., “Multi-parametric quantitative microvascular imaging with optical-resolution photoacoustic microscopy in vivo,” Opt. Express 22(2), 1500–1511 (2014). 10.1364/OE.22.001500 [DOI] [PubMed] [Google Scholar]
- 7.Ning B., Kennedy M. J., Dixon A. J., Sun N., Cao R., Soetikno B. T., Chen R., Zhou Q., Kirk Shung K., Hossack J. A., Hu S., “Simultaneous photoacoustic microscopy of microvascular anatomy, oxygen saturation, and blood flow,” Opt. Lett. 40(6), 910–913 (2015). 10.1364/OL.40.000910 [DOI] [PubMed] [Google Scholar]
- 8.Hajireza P., Sorge J., Brett M., Zemp R., “In vivo optical resolution photoacoustic microscopy using glancing angle-deposited nanostructured Fabry-Perot etalons,” Opt. Lett. 40(7), 1350–1353 (2015). 10.1364/OL.40.001350 [DOI] [PubMed] [Google Scholar]
- 9.Kolkman R. G. M., Steenbergen W., van Leeuwen T. G., “In vivo photoacoustic imaging of blood vessels with a pulsed laser diode,” Lasers Med. Sci. 21(3), 134–139 (2006). 10.1007/s10103-006-0384-z [DOI] [PubMed] [Google Scholar]
- 10.Allen T. J., Beard P. C., “Pulsed near-infrared laser diode excitation system for biomedical photoacoustic imaging,” Opt. Lett. 31(23), 3462–3464 (2006). 10.1364/OL.31.003462 [DOI] [PubMed] [Google Scholar]
- 11.Maslov K., Wang L. V., “Photoacoustic imaging of biological tissue with intensity-modulated continuous-wave laser,” J. Biomed. Opt. 13(2), 024006 (2008). 10.1117/1.2904965 [DOI] [PubMed] [Google Scholar]
- 12.Mienkina M. P., Friedrich C. S., Gerhardt N. C., Beckmann M. F., Schiffner M. F., Hofmann M. R., Schmitz G., “Multispectral photoacoustic coded excitation imaging using unipolar orthogonal Golay codes,” Opt. Express 18(9), 9076–9087 (2010). 10.1364/OE.18.009076 [DOI] [PubMed] [Google Scholar]
- 13.Beckmann M. F., Schwab H. M., Schmitz G., “Optimized SNR simultaneous multispectral photoacoustic imaging with laser diodes,” Opt. Express 23(2), 1816–1828 (2015). 10.1364/OE.23.001816 [DOI] [PubMed] [Google Scholar]
- 14.Su S. Y., Li P. C., “Coded excitation for photoacoustic imaging using a high-speed diode laser,” Opt. Express 19(2), 1174–1182 (2011). 10.1364/OE.19.001174 [DOI] [PubMed] [Google Scholar]
- 15.Leboulluec P., Liu H., Yuan B., “A cost-efficient frequency-domain photoacoustic imaging system,” Am. J. Phys. 81(9), 712–717 (2013). 10.1119/1.4816242 [DOI] [PMC free article] [PubMed] [Google Scholar]
- 16.Zeng L., Liu G., Yang D., Ji X., “3D-visual laser-diode-based photoacoustic imaging,” Opt. Express 20(2), 1237–1246 (2012). 10.1364/OE.20.001237 [DOI] [PubMed] [Google Scholar]
- 17.Daoudi K., van den Berg P. J., Rabot O., Kohl A., Tisserand S., Brands P., Steenbergen W., “Handheld probe integrating laser diode and ultrasound transducer array for ultrasound/photoacoustic dual modality imaging,” Opt. Express 22(21), 26365–26374 (2014). 10.1364/OE.22.026365 [DOI] [PubMed] [Google Scholar]
- 18.Kang D., Huang Q., Li Y., “Measurement of cardiac output by use of noninvasively measured transient hemodilution curves with photoacoustic technology,” Biomed. Opt. Express 5(5), 1445–1452 (2014). 10.1364/BOE.5.001445 [DOI] [PMC free article] [PubMed] [Google Scholar]
- 19.Upputuri P. K., Pramanik M., “Performance characterization of low-cost, high-speed, portable pulsed laser diode photoacoustic tomography (PLD-PAT) system,” Biomed. Opt. Express 6(10), 4118–4129 (2015). 10.1364/BOE.6.004118 [DOI] [PMC free article] [PubMed] [Google Scholar]
- 20.Wang T., Nandy S., Salehi H. S., Kumavor P. D., Zhu Q., “A low-cost photoacoustic microscopy system with a laser diode excitation,” Biomed. Opt. Express 5(9), 3053–3058 (2014). 10.1364/BOE.5.003053 [DOI] [PMC free article] [PubMed] [Google Scholar]
- 21.Zeng L., Liu G., Yang D., Ji X., “Portable optical-resolution photoacoustic microscopy with a pulsed laser diode excitation,” Appl. Phys. Lett. 102(5), 053704 (2013). 10.1063/1.4791566 [DOI] [Google Scholar]
- 22.Zeng L., Liu G., Yang D., Ji X., “Cost-efficient laser-diode-induced optical-resolution photoacoustic microscopy for two-dimensional/three-dimensional biomedical imaging,” J. Biomed. Opt. 19(7), 076017 (2014). 10.1117/1.JBO.19.7.076017 [DOI] [PubMed] [Google Scholar]
- 23.Yao J., Wang L. V., “Sensitivity of photoacoustic microscopy,” Photoacoustics 2(2), 87–101 (2014). 10.1016/j.pacs.2014.04.002 [DOI] [PMC free article] [PubMed] [Google Scholar]
- 24.Wang L. V., Gao L., “Photoacoustic microscopy and computed tomography: from bench to bedside,” Annu. Rev. Biomed. Eng. 16(1), 155–185 (2014). 10.1146/annurev-bioeng-071813-104553 [DOI] [PMC free article] [PubMed] [Google Scholar]
- 25.Wang L., Maslov K., Yao J., Rao B., Wang L. V., “Fast voice-coil scanning optical-resolution photoacoustic microscopy,” Opt. Lett. 36(2), 139–141 (2011). 10.1364/OL.36.000139 [DOI] [PMC free article] [PubMed] [Google Scholar]
- 26.Strohm E. M., Berndl E. S. L., Kolios M. C., “High frequency label-free photoacoustic microscopy of single cells,” Photoacoustics 1(3-4), 49–53 (2013). 10.1016/j.pacs.2013.08.003 [DOI] [PMC free article] [PubMed] [Google Scholar]
- 27.Huang C., Nie L., Schoonover R. W., Wang L. V., Anastasio M. A., “Photoacoustic computed tomography correcting for heterogeneity and attenuation,” J. Biomed. Opt. 17(6), 061211 (2012). 10.1117/1.JBO.17.6.061211 [DOI] [PMC free article] [PubMed] [Google Scholar]
- 28.Zhang C., Zhou Y., Li C., Wang L. V., “Slow-sound photoacoustic microscopy,” Appl. Phys. Lett. 102(16), 163702 (2013). 10.1063/1.4803444 [DOI] [PMC free article] [PubMed] [Google Scholar]
- 29.Wang L., Zhang C., Wang L. V., “Grueneisen relaxation photoacoustic microscopy,” Phys. Rev. Lett. 113(17), 174301 (2014). 10.1103/PhysRevLett.113.174301 [DOI] [PMC free article] [PubMed] [Google Scholar]
- 30.Mattison S. P., Applegate B. E., “Simplified method for ultra high-resolution photoacoustic microscopy via transient absorption,” Opt. Lett. 39(15), 4474–4477 (2014). 10.1364/OL.39.004474 [DOI] [PubMed] [Google Scholar]
- 31.Huang H., Chen S., Zou H., Li Q., Fu J., Lin F., Wu X., “Fabrication of micro-axicons using direct-laser writing,” Opt. Express 22(9), 11035–11042 (2014). 10.1364/OE.22.011035 [DOI] [PubMed] [Google Scholar]
- 32.American National Standards Institute Inc, (ANSI), ANSI Z136.1–2007: American National Standard for Safe Use of Lasers (ANSI, 2007). [Google Scholar]


