Abstract
Objective
To test the effects of sequential exposure to FGF2, 9 and 18 on human Mesenchymal Stem Cells (hMSC) differentiation during in vitro chondrogenesis.
Design
Control and FGF2-expanded hMSC were cultured in aggregates in the presence of rhFGF9, rhFGF18 or rhFGFR3-specific signaling FGF variants, starting at different times during the chondroinductive program. qRT-PCR and immunocytochemistry were performed at different stages. The aggregate cultures were switched to a hypertrophy-inducing medium along with rhFGFs and neutralizing antibodies against FGFR1 and FGFR3. Histological/immunohistochemical/biochemical analyses were performed.
Results
FGF2-exposed hMSC during expansion up-regulated Sox9 suggesting an early activation of the chondrogenic machinery. FGF2, FGF9 and 18 modulated the expression profile of FGFR1 and FGFR3 in hMSC during expansion and chondrogenesis. In combination with TGF-β, FGF9 and FGF18 inhibited chondrogenesis when added at the beginning of the program (≤d7), while exhibiting an anabolic effect when added later (≥d14), an effect mediated by FGFR3. Finally, FGFR3 signaling induced by either FGF9 or FGF18 delayed the appearance of spontaneous and induced hypertrophy-related changes.
Conclusions
The stage of hMSC-dependent chondrogenesis at which the growth factors are added impacts the progression of the differentiation program: increased cell proliferation and priming (FGF2); stimulated early chondrogenic differentiation (TGF-β, FGF9/FGF18) by shifting the chondrogenic program earlier; augmented ECM production (FGF9/FGF18); and delayed terminal hypertrophy (FGF9/FGF18). Collectively, these factors could be used to optimize pre-implantation conditions of hMSC when used to engineer cartilage grafts.
Keywords: Mesenchymal Stem Cells, Fibroblast Growth Factor (FGF), FGFR, Chondrogenesis, Hypertrophy, Cartilage Repair
INTRODUCTION
The expansion potential and the ability to differentiate into chondrocytes of human Bone Marrow-derived Mesenchymal Stem Cells (hMSC) have been studied and documented extensively. These cells constitute an interesting alternative to autologous chondrocytes to treat chondral and osteochondral defects1–3. However, much work still needs to be done before hMSC can be accepted as a front-line treatment, mainly due to the difficulties associated with the control of a definitive chondrocyte phenotype capable of fabricating stable hyaline cartilage.
A salient feature of existing in vitro approaches to the expansion and chondrogenic differentiation of hMSC is that they use one-step stimulation, in the sense that a single culture medium is used to expand the cells, and a single chondrogenic formulation is used to drive the entire multi-step differentiation process. Yet, to date, true hyaline articular cartilage has not been successfully engineered using hMSC following these simple approaches, highlighting the need for optimization of these formulations. For this reason, and due to several recent observations, we propose a comprehensive re-thinking of these assumptions. The observations that serve as ground for the new approach are: first, the finding that hMSC can be specifically primed for subsequent chondrogenic differentiation and massive ECM formation by stimulating cells with FGF2 during the expansion phase4,5; second, the recognition that marrow hMSC likely have an intrinsic differentiation program, analogous to endochondral bone formation and fracture healing, which drives new chondrocytes to terminal hypertrophic differentiation and the generation of a “transient” cartilaginous ECM with different structure and function compared to hyaline native articular cartilage6–9; and third, borrowing from developmental biology and embryonic stem cell research, it is clear that a sequential exposure to different bioactive molecules is required to drive differentiation towards particular cellular phenotypes10,11.
The effects of FGF2 on hMSC have been extensively studied, showing an enhancement in proliferation and chondrogenic potential when applied during the expansion phase5. In contrast, when applied during chondrogenic differentiation, it has a negative effect on matrix deposition and differentiation12,13.
FGF18 has recently gained attention due to its demonstrated anabolic effects on cartilage14. In mature articular chondrocytes, in both in vitro and in vivo models of articular cartilage injury, FGF18 exhibits mitogenic activities in addition to increased ECM production, thereby promoting cartilage repair15–17. These observations have led to the design of clinical trials to study the use of intra-articular injections of FGF18 as an alternative treatment for different stages of knee Osteoarthritis (OA) and for acute cartilage injuries (Merck Serono, Switzerland). On the other hand, much less is known regarding the role of FGF9 during cartilage biology and repair. FGF9 has similar receptor specificities as FGF-18 while belonging to a different subfamily of FGF ligands. FGF9 is known to signal from epithelium to mesenchyme inducing mesenchymal proliferation, and to induce the production of other FGF family members involved in sex determination and lung development18. During skeletal development, FGF9 is expressed in the proximity of developing skeletal elements (apical ectodermal ridge), affecting skeletogenesis consequent to mesenchymal cell condensation. FGF9−/− mice exhibit rhizomelia, a condition characterized by shortening of proximal skeletal elements19. In addition, FGF9 seems to be able to redirect cranial development mesenchyme from an intramembranous to an endochondral process20. Finally, during in vitro hMSC chondrogenic differentiation, is has been shown that FGF9 exerts a negative effect when present throughout the entire differentiation program12. On the other hand, FGFR3 has been demonstrated to have a positive impact on chondrogenic differentiation as well as matrix deposition by differentiated chondrocytes (proanabolic effect), in sharp contrast with FGFR1-dependent signaling, described as procatabolic and antianabolic14,15,21–23. In fact, a resulting FGFR3:FGFR1 ratio is significantly reduced in OA and proposed as a potential target for therapeutic modification21. This signaling antagonism downstream of both receptors, in addition to the known lack of full receptor specificity of FGF ligands would suggest the use of FGFR3-specific ligands in order to augment the positive response.
On the basis of the need of a re-thinking of the established assumptions for in vitro chondrogenic differentiation of hMSC, we now propose a new approach, one that “mimics” embryonic development. In this approach we assume that the entire chondrogenic program is controlled by a combination of various growth factors sequentially delivered, with each step individually modulated, resulting in a cellular phenotype that generates a more “permanent” hyaline-like cartilage ECM that could be implanted in vivo to treat chondral and osteochondral defects. The experiments reported here elucidate the effect of these FGF family members when used at different stages of the in vitro chondrogenic differentiation program of hMSC.
METHODS
Cell cultures
Cultures of hMSC were established as previously described24,25. The marrow was collected using a procedure reviewed and approved by the University Hospitals of Cleveland Institutional Review Board; informed consent was obtained from all donors. Cells were obtained from four healthy de-identified adult volunteer donors, and expanded in either DMEM-LG + FBS 10% (Control-expanded) or DMEM-LG + FBS 10% + 10 ng/ml FGF2 (FGF2-expanded) for 14 days. All results were calculated, compared and shown using data obtained from all donors (6 pellets per condition) and run in triplicate. An intrinsic variability was seen among absolute values obtained with the 4 donors, yet the data is consistent among them.
Chondrogenic induction
Control and FGF2-expanded cells were cultured in aggregates4,5 with complete chondrogenic medium (DMEM-HG supplemented with 1% ITS, 10−7 M dexamethasone, 1 mM sodium pyruvate, 120 μM ascorbic acid-2 phosphate, 100 μM non-essential amino acids and 10 ng/ml TGF-β1), in the presence of 10 ng/ml rhFGF18, 10 ng/ml rhFGF9, 10 ng/ml mutant ligands that exclusively signal through FGFR3 (FGF9v1 and FGF18v3) and neutralizing antibodies against FGFR1 (0.1 μg/ml) and FGFR3 (0.5 μg/ml) (Procore; Ness Ziona, Israel) starting at different times of the chondroinductive program. FGF18v3 is a truncated version of FGF18 lacking the amino-terminal 51 amino acids of the ligand and having the first methionine replacing Glutamine 51. FGF9v1 is likewise a truncated version of FGF9 lacking the amino-terminal 37 amino acids of the ligand and having tryptophane 144 substituted for Glycine). Histological/biochemical, immunocytochemistry and qRT-PCR analyses were performed at different time points during the differentiation progression.
Antibody penetration to pellets
To confirm the penetration and distribution of the FGFR neutralizing antibodies inside the ECM-rich pellet, the anti-human FGFR3 neutralizing antibody was added at different time points during the aggregate culture (d0, d7, d14), and immunolocalized in frozen sections at days 21 with an anti-mouse secondary antibody.
Hypertrophy delay
Aggregate cultures of FGF2-expanded cells were switched after 2 weeks to a hypertrophy-inducing medium (TGF-β withdrawal, low dexamethasone, 1 ng/ml triiodothyronine)6, 7 for 2 additional weeks, along with rhFGF18, rhFGF9, FGF18v3, FGF9v1, and the FGFR1/FGFR3 neutralizing antibodies. Histological/biochemical analyses and alkaline phosphatase (ALP) activity assessment (Supplemental methods) as a marker of hypertrophy-induced changes were then performed.
Histology/immunohistochemistry
Pellets were fixed, paraffin-embedded, and sectioned. Adjacent sections were stained with toluidine blue O to evaluate proteoglycan content. For type II collagen (Col2) immunohistochemistry, pellet sections were deparaffinized/rehydrated followed by antigen retrieval through incubation with 10 μg/ml proteinase-K (Roche) in TE buffer for 20 min at 37°C, and endogenous peroxidase activity blocked by incubating with 3% hydrogen peroxide during 30 min at RT. Nonspecific binding sites were blocked with 2.5% normal horse serum, sections were incubated overnight with mouse monoclonal Col2 antibody (CIIC1; Developmental studies hybridoma bank, Iowa City, IA). Sections were incubated with anti-mouse Ig (ImmPRESS™ polymerized reporter enzyme staining system, Vector Laboratories, CA) for 30 min, followed by a short incubation with ImmPACT™ red peroxidase substrate (Vector laboratories, CA).
Total GAG/DNA assay
The proteoglycan content of the aggregates was quantified using methods described previously26, presented in detail in Supplemental methods.
RNA isolation and real-time qPCR
Total RNA was isolated from cells using TRIzol® reagent (Invitrogen, Carlsbad, CA) according to the manufacturer’s instructions. Before RNA isolation, the aggregates were homogenized using RNase-free disposable Pellet-Pestles® (Kimble-Chase, TN). The sample was digested on-column with DNasel and purified with the RNeasy mini kit (Qiagen, Valencia, CA). One μg of total RNA was used for reverse transcription with SuperScript III (Invitrogen), and 10 ng of the resulting cDNA were quantified by qPCR using a StepOne Real-time thermocycler (Applied Biosystems). HPRT was chosen to normalize the data; relative expression was calculated according to the 2−ΔΔCT method27.
Statistical analysis
Statistical analysis was conducted using GraphPad Prism software (Version 5.0c for Mac OS X). Gene expression and GAG quantification assessment for normal distribution (Shapiro-Wilk and Kolmogorov-Smirnov tests) was inconclusive based on small n number. Visual analysis of the data shows no skewedness and absence of outliers. Therefore, parametric test were used to calculate statistical significance, taking into account that with small samples the non-parametric tests have little power to find significant differences. Student’s paired t-test (paired by donor) was used to compare two groups and ANOVA with Tukey’s post hoc testing for multiple comparisons. Values are represented as means ± 95% confidence intervals and significance assigned at P<0.05.
RESULTS
FGF2 effects during hMSC expansion and early chondrogenesis
We have previously shown that FGF2 treatment during expansion enhances the proliferation and subsequent chondrogenic potential of hMSC, delaying their senescence and the concomitant loss of differentiation capacity associated with cell passaging5,28. In contrast, the addition of FGF2 later during differentiation in aggregates has a negative effect on in vitro chondrogenesis12. This contrasting information suggests that the beneficial effects of FGF2 on hMSC-derived chondrogenic differentiation are limited to the presence of the ligand only during the expansion phase. We compared the expression of Sox9 in control- and FGF2-expanded hMSC both at the end of the expansion period (d0), and after 3 days in chondrogenic aggregate cultures. As shown in Fig.1, Sox9 mRNA and protein are upregulated at the end of expansion with FGF2 (d0) (Fig.1A and B). Later, after an initial exposure to chondrogenic medium for 3 days, Sox9 gene expression becomes comparable, due to a more pronounced upregulation in control-expanded cells (Fig.1A). This “catch up” effect can be explained by a “ceiling” effect on Sox9 expression. Examination of other related genes (Sox5, Sox6 and Sox8) in similar conditions revealed an overall low expression during this time. In conclusion, expanding hMSC in the presence of FGF2 shifts the activation of Sox9 earlier than in control-expanded cells.
Figure 1. Immunocytochemistry of hMSC stimulated with FGF2 during expansion phase and gene expression during expansion and in vitro chondrogenesis.
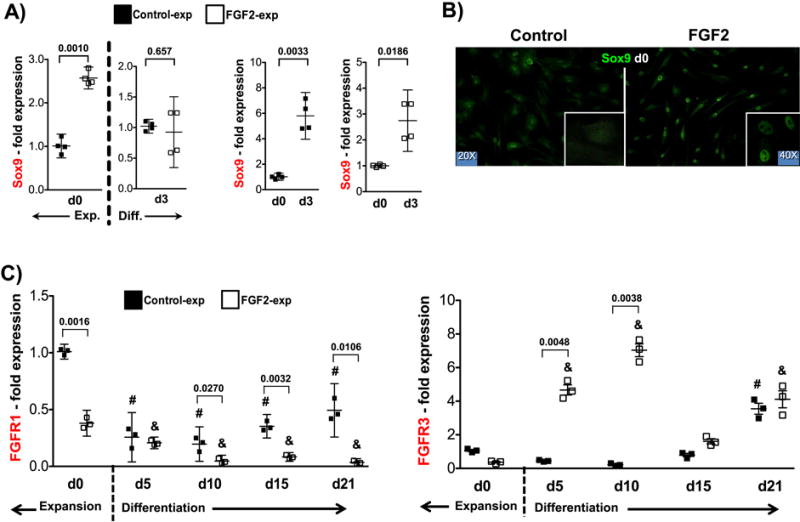
(A) Sox9 mRNA (n=4) at the end of 14 days of expansion (Exp. - d0) and at early chondrogenic differentiation in aggregate cultures (Diff. – d3) with and without FGF2. Statistical comparisons made against control-expanded data at d0 and d3 independently (left panel) and against d0 for both groups (right panel). (B) Sox9 protein at the end of 14 days of expansion in control and FGF2-rich medium. (C) FGFR1 and FGFR3 (n=3) gene expression profiles (assessed by qRT-PCR) evaluated after 14 days of expansion (d0) and subsequent aggregate culture for 21 days. (#): Statistical significance (p<0.0001) when data compared to control-expanded at d0; (&): Statistical significance (p<0.0001) when data compared to FGF2-expanded at d0. Statistical significances (p values) when Control and FGF2-expanded cells are compared at a particular time-point are shown in the graph for clarity. Gene expression analysis was performed for all four donors (Sox9) and three donors (FGFRs) using triplicate samples.
Of the four known FGF receptors (FGFRs), three (FGFR1, FGFR2 and FGFR3) are expressed by hMSC12. We therefore looked for potential altered expression of different FGFRs after expansion with FGF2 (in comparison with control-expanded cells) and then during chondrogenic induction in aggregate cultures. Consistent with that report, FGFR1 was the most abundant at the end of expansion (both control and FGF2-expanded cells), while FGFR2 and FGFR3, although present, were significantly less expressed (Suppl. Fig.1A). In contrast to FGFR1 and FGFR3, which experienced prominent changes at different stages of chondrogenesis (Fig. 1C), FGFR2 remained consistently low and did not show any significant difference in expression throughout the examination period (Suppl. Fig.1B). FGFR1 was downregulated at the end of expansion (d0) in FGF2-rich medium, while the expression of FGFR3, although exhibited a similar trend, did not reach statistical difference (Fig.1C). Later during chondrogenic induction, FGFR1 remained low in FGF2-expanded cells, compared to day 0 and to control-expanded cells. In contrast, FGFR3 was significantly upregulated exclusively during the first two weeks of differentiation in FGF2-expanded cells, returning to levels comparable to control-expanded cells thereafter.
FGF9 and FGF18 effects on FGFRs expression during hMSC chondrogenesis
Both FGF9 and FGF18 were weakly expressed at the end of expansion. Then during aggregate culture their expression dropped even more and remained low throughout the differentiation period (Suppl. Fig 1C). When exogenously administered to control-expanded cells (starting at day 0 of aggregate culture), neither ligand altered the expression of FGFR1 or FGFR3 during the entire differentiation program (d0 – d21), except from a negative effect observed on FGFR3 at day 21 (Figs. 2A & 2B). On the other hand, when administered to FGF2-expanded cells, both ligands affected FGFR1 and FGFR3 expression. During early differentiation (up to day 10) they had no effect on FGFR1 expression while negative on FGFR3 reducing its significant upregulation obtained after expansion with FGF2 (more pronounced with FGF9). Later during differentiation (d15 onward), both factors similarly upregulated the two receptors significantly (Figs. 2A & 2B). The resulting FGFR3:FGFR1 ratio shows that both ligands counteract the high ratio obtained after expansion with FGF2 throughout the entire differentiation program, and in control-expanded cells during late differentiation (Fig. 2C). FGFR2 expression was not modified at any time by either ligand (Suppl. Fig. 1B).
Figure 2. FGFR3, FGFR1 gene expression and FGFR3:FGFR1 ratio during hMSC chondrogenic differentiation in the presence of FGF9 and FGF18.
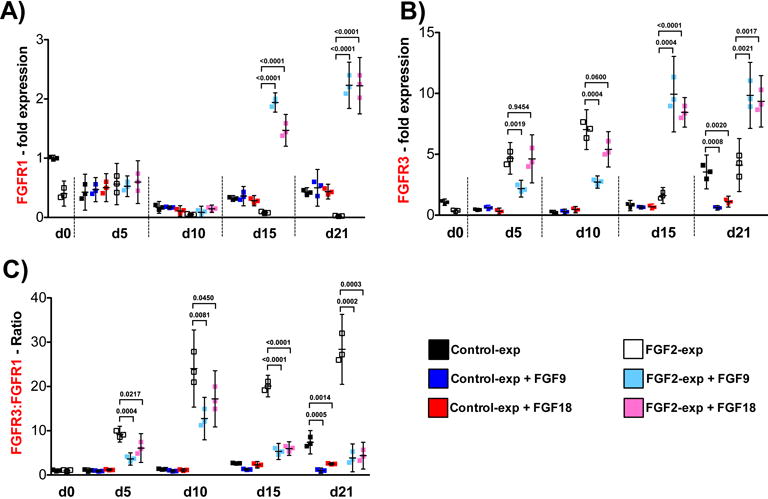
Control and FGF2-expanded cells (n=3) were subjected to FGF9 or FGF18 stimulation from d0 to d21 of differentiation induction in pellet cultures, where d0 data corresponds to expanded cells just before aggregate formation. Pellet cultures were harvested at day 5, 10, 15 and 21, and qRT-PCR performed to evaluate FGFR3 and FGFR1 gene expression (A & B) and FGFR3:FGFR1 ratio (C). Results with non-stimulated Control (black dots) and FGF2-expanded cells (white dots) are shown again as in Fig 1C for reference (statistical differences presented in Fig 1C). Data obtained at every time point with FGF9 and FGF18 stimulation were compared with Control-expanded and FGF2-expanded cells at the same point, and the statistical differences (p values) shown in the graph for clarity. All other comparison were p>0.1.
ECM deposition (anabolic effect)
As shown in Figure 3, FGF9 and FGF18 showed a negative effect when added to FGF2-expanded hMSC at the beginning of the chondroinduction program (from d0 and d7 to d21). In contrast, both factors produced a clear anabolic effect when the stimulation started later in culture (d14 to d21). This effect is again mediated by FGFR3 as FGF9v1 and FGF18v3, mutated versions of FGF9 and 18, which signal exclusively through FGFR3, increased the positive anabolic effect evident as a higher toluidine blue staining (Fig.3A), GAG/DNA concentration and aggrecan mRNA upregulation (Fig.3B), and Col2 RNA and protein expression (Fig.4A and B). To further study the specific role of FGFR3 and FGFR1 on hMSC chondrogenesis, we added FGF9, FGF18 and their mutant variants at day 14 until day 21, along with FGFR1 and FGFR3 neutralizing antibodies. As shown in Supplemental Figure 2, this type of neutralizing antibodies are able to penetrate and distribute homogeneously throughout the pellet after several days of administration, thus showing accessibility of the antibodies to their targets inside a structure with growing ECM. As expected, and similar to the results shown in Figures 3 and 4, both FGF9 and FGF18 had an anabolic effect above the TGF-β effect, exacerbated even more with the mutants, especially with FGF9v1. Blocking FGFR1 and FGFR3 had no effect and significantly decreased, respectively, the anabolic effect of both FGFs, suggesting a critical FGFR3-mediated positive effect on ECM deposition. Interestingly, FGF9v1 has a greater anabolic effect than the native FGF9 and FGF18 and the FGF18v3 variant as seen in the histology (Fig. 5A), the GAG/DNA assay and the upregulation of Col2 and aggrecan mRNA (Fig.5B), suggesting a more potent effect of FGF9, when signaling exclusively through FGFR3. In conclusion, FGF9 and FGF18 signaling via FGFR3 late during chondrogenic differentiation have an anabolic effect above TGF-β, with a greater response with FGF9.
Figure 3. Chondrogenic differentiation of FGF2-expanded hMSC in the presence of FGF9 or FGF18 (and variants) at different times of initial stimulation.
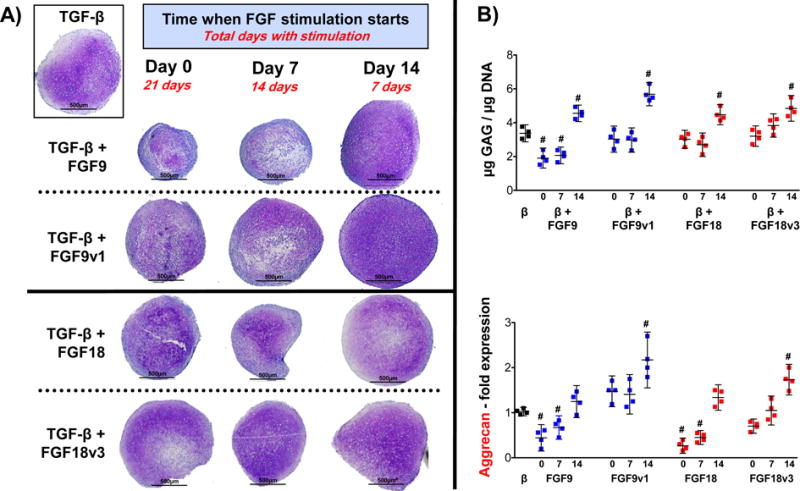
FGF9, FGF18 or their variants were administered starting at the beginning (d0), at day 7 (d7) and at day 14 (d14) of chondrogenic differentiation until day 21. (A) Histological assessment of representative pellets showing the anabolic effect when stimulation starts at d14, and a negative effect when started earlier, specifically FGF9. Pellet shown in the insert (control) corresponds to black dots shown on B). (B) GAG/DNA quantification and aggrecan gene expression analysis assessed by qRT-PCR, performed at day 21. Statistical significance (#) was obtained for GAG/DNA comparing all values to control pellet (black dots) with the following p values: β+9 (d0: 0.0010; d7: 0.0011; d14: 0.0017); β+9v1 (d14: 0.0001); β+18 (d14: 0.0021); β+18v3 (d14: 0.0008). All other comparisons were p > 0.2. For Aggrecan, significance (#) gave the following p values: β+9 (d0: 0.0009; d7: 0.0021); β+9v1 (d14: 0.0011); β+18 (d0: <0.0001; d7: <0.0001); β+18v3 (d14: 0.0007). All other comparisons were p > 0.2. N=4.
Figure 4. Type 2 collagen Immunohistochemistry and gene expression of FGF2-expanded hMSC in the presence of FGF9 or FGF18 (and variants) at different times of initial stimulation.
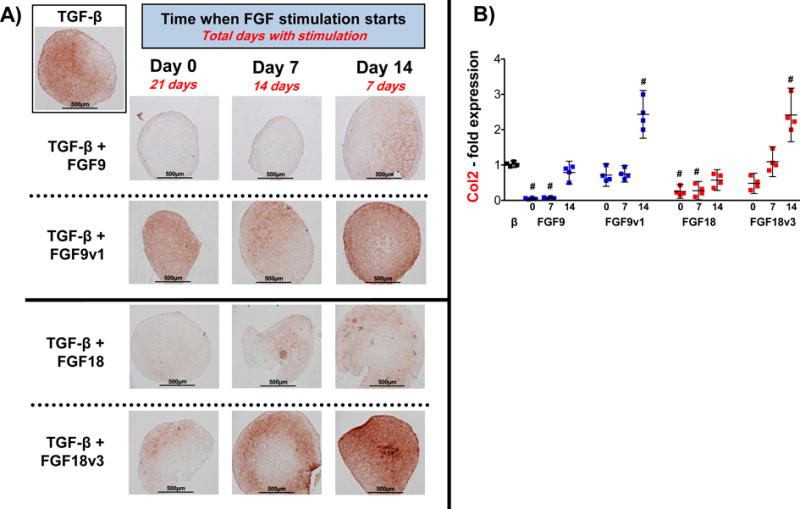
Type 2 collagen presence in pellets subjected to same conditions as in Figure 3, assessed at day 21 by immunohistochemistry (A) and qRT-PCR (B). Statistical significance (#) was obtained comparing all values to control pellet (black dots) with the following p values: β+9 (d0: <0.0001; d7: <0.0001); β+9v1 (d14: 0.0006); β+18 (d0: <0.0001; d7: <0.0001); β+18v3 (d14: 0.0012). All other comparisons were p > 0.2. N=4.
Figure 5. Chondrogenic differentiation of FGF2-expanded hMSC stimulated with FGF9 or FGF18 (or their variants) from day 14 in the presence of FGFR1 or FGFR3 neutralizing antibodies.
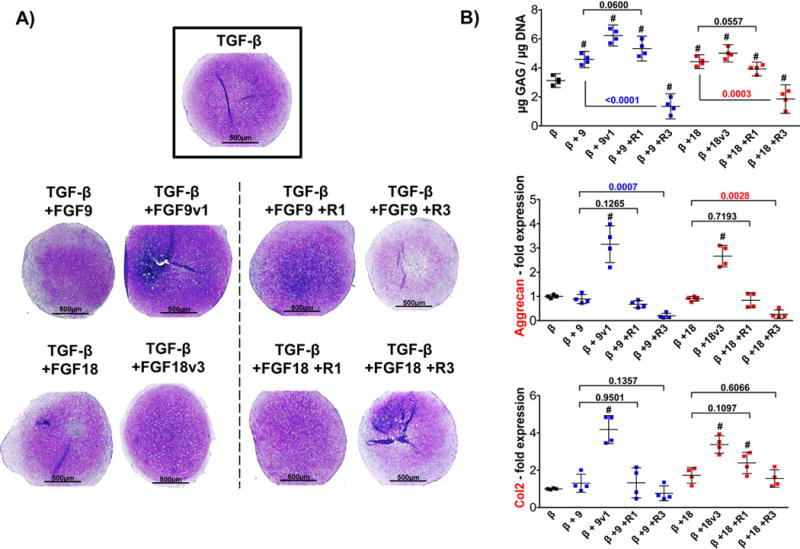
FGF2-expanded cells were stimulated with ligands or mutant variants for 7 days starting at d14 (until d21). Receptor neutralizing antibodies were added 48 hours in advance (d12) to assure blocking before ligands were administered. Pellet shown in the insert (control) corresponds to black dots shown on B). (A) Histological assessment of representative pellets confirming the results with FGF ligands and mutants (as presented in Fig. 3 – d14), and the determinant role of FGFR3 in this effect, (B) GAG/DNA quantification and gene expression analysis of type 2 collagen and aggrecan, assessed by qRT-PCR performed at day 21. Statistical significance (#) was obtained comparing all values to control pellet (black dots) with the following p values: for GAG/DNA: β+9 (0.0007), β+9v1 (<0.0001), β+9+R1 (0.0004), β+9+R3 (0.0012), β+18 (0.0008), β+18v3 (0.0002), β+18+R1 (0.0091), β+18+R3 (0.0100). For Aggrecan expression: β+9v1 (<0.0013) and β+18v3 (0.0003). For Col2 expression β+9v1 (0.0002), β+18v3 (0.0001), β+18+R1 (0.0009). All other comparisons were p > 0.1. The effects of blocking FGFR1 and FGFR3 receptors when compared with respective growth factor alone are shown in the graph with significant differences (p values) displayed in color. N=4.
Both ligands did not have a significant effect on cell proliferation during monolayer culture (data not shown). Their effect was restricted to pellet culture, showing that the anabolic effect was due to ECM deposition and not an increase in the ECM-producing cell number.
Delayed Hypertrophy
The presence of FGFs at a later point during the differentiation program presented another unanticipated significant benefit. Compared with control-expanded cells at day 21, pellets made with FGF2-expanded hMSC exhibited an upregulation of hypertrophy markers (Col10, Runx2, MMP13 and VEGF) (Fig.6A), all suggestive of an earlier onset of terminal cell differentiation. Interestingly, the addition of FGF9 or FGF18 (and variants) during the last 2 weeks of an extended culture of FGF2-expanded cells (d14 to d28) antagonized this upregulation in all four genes (Fig.6B). Blocking FGFR3 prevents this antagonistic effect in Runx2 expression (both FGF9 and FGF18), while in Col10, MMP13 and VEGF it is only evident for FGF18. Blocking FGFR1, on the other hand, does not have an impact on the effect of either FGF9 or FGF18. This suggests that signaling through FGFR3 is the main responsible for the delayed hypertrophy phenotype downstream of FGF18 signaling, and that FGF9 may use alternate pathways, at least to control certain hypertrophy genes. As a further confirmation of this effect, we tested both ligands with FGF2-expanded cells directly stimulated to enhance terminal differentiation, in order to assess their ability to antagonize conditions known to induce chondrocyte hypertrophy6,7. In these pro-terminally differentiating conditions, both FGF9 and FGF18 (and variants) were also able to partially delay the appearance of induced hypertrophy-related changes in cytomorphology (larger lacunae as previously reported6,7), but more dramatically to reduce the activity of the hypertrophy-specific marker alkaline phosphatase (ALP) (Fig.7). These effects are mediated again mainly through FGFR3 signaling, as neutralizing FGFR3, not FGFR1, reverted the ALP activity. In conclusion, FGF9 and FGF18, signaling mainly via FGFR3, showed a delay in the presence of hypertrophic changes during late chondrogenic differentiation of hMSC.
Figure 6. Spontaneous hypertrophic phenotype delayed with FGF9 and FGF18.
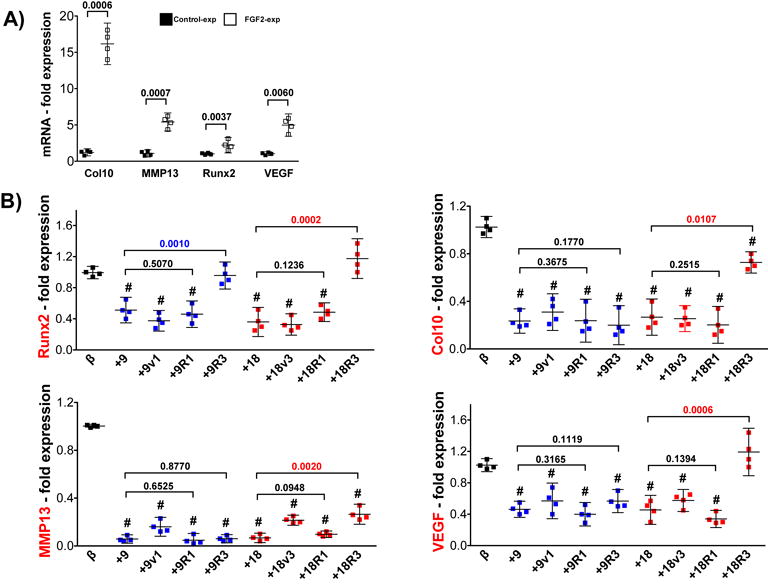
(A) Gene expression profile of hypertrophy markers showing an early onset of terminal differentiation of FGF2-expanded cells compared with control-expanded cells. P values are shown for each gene in the graph for clarity. (B) Gene expression profile assessment of FGF2-expanded cells (n=4) stimulated with FGF9, FGF18 and variants along with blocking FGFR3 (+R3) or FGFR1 (+R1) antibodies for two weeks (d14 to d28). Compared to control pellets without stimulation (β), statistical significance (p<0.0001) was obtained for the majority of conditions (#) in all four genes. The effects of blocking FGFR1 and FGFR3 receptors when compared with respective growth factor alone are shown in the graph with significant differences (p values) displayed in color. N=4.
Figure 7. FGF9 and FGF18 delay induced hypertrophy-related features.
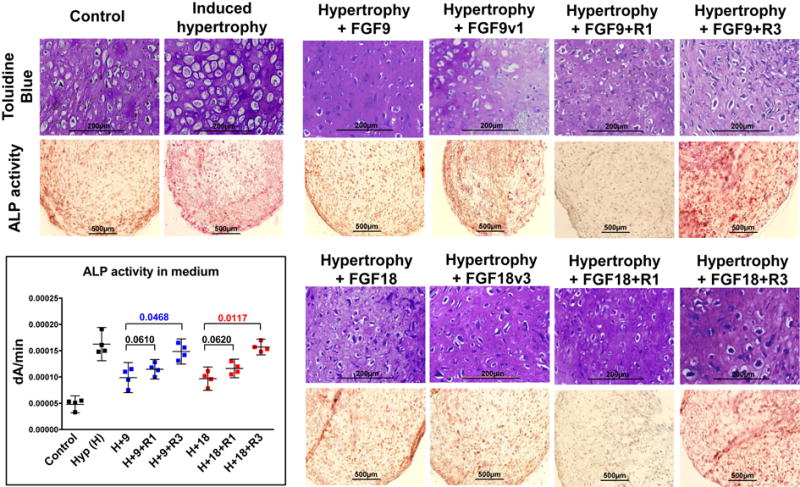
Induced terminal differentiation of FGF2-expanded hMSC evaluated cytomorphologically6,7 (top row) and by the activity of the hypertrophy-specific marker Alkaline Phosphatase (ALP) in sections (lower row) and quantified (dA/min = changes of Absorbance at A405 in time within the linear range) in the medium6 (insert). Compared to control, all conditions with hypertrophy induction are statistically different (p<0.0001). Compared to hypertrophy alone (H): the addition of FGF9 (p=0.0441) and FGF18 (p=0.0280) delayed the appearance of those enhanced terminal differentiation characteristics. Blocking FGFR3 prevented this effect (with FGF9: p=0.1975, and with FGF18: p=0.4863), while blocking FGFR1 did not (with FGF9: p=0.0459, and with FGF18: p=0.0478). This effect of blocking the receptors is further supported when compared to the growth factors alone: p values shown in graph for clarity and significant differences displayed in color. N=4.
DISCUSSION
Tissue engineering for cartilage repair is focused on developing strategies aimed at generating a durable tissue with a stable hyaline cartilage phenotype, a task that relies on the identification and manipulation of signaling pathways that promote chondrogenesis and cartilage production. Several previous studies have focused on the use of different growth factors to control hMSC-based chondrogenesis towards articular cartilage, some of them with arguable success, but still not efficiently bypassing the osteochondral fate of hMSC6,29. The control of chondrogenesis starting with hMSC and aiming for the correct and functional phenotype is certainly more complex than can be accomplished by adding single chondrogenic factors (i.e., TGF-β). This traditional approach fails to accomplish those aims, mainly because the lack of integration of crucial temporal aspects of the chondrogenic program regulation. We propose that sequential addition of growth factors to cell culture medium is a useful technique for stimulating efficient chondrogenesis of hMSC in vitro30–32.
Members of the FGF superfamily of morphogens play a variety of roles in chondrogenesis in vitro, as well as during development and repair33. We and others have previously shown that FGF2, when administered exclusively during hMSC expansion, enhances proliferation, delays senescence, and primes the cells for a better subsequent chondrogenic differentiation4,5,34. However, the precise underlying mechanisms are not well understood.
We show that the presence of FGF2 during hMSC expansion shifts earlier and upregulates the transcription factor Sox9, critical in the early phases of chondrogenic differentiation of mesenchymal precursors35,36. In addition, FGF2 modulates the expression of FGF receptors, normally expressed in a distinct and stage-dependent pattern and essential during chondrogenic differentiation. FGFR1, critical during expansion37,38, but with a negative effect during early chondrogenesis39, was significantly downregulated throughout the differentiation program. FGFR3, a known marker of precartilaginous cells40, that enhances matrix deposition22, and that is poorly expressed in hMSC during expansion and early stages of differentiation14,41, was significantly upregulated at these early stages. This resulting receptor profile generated with FGF2 during expansion can then be used during active differentiation to enhance the positive effects of FGFR3 ligands such as FGF18 (and FGF9 as proposed here), at times where they would normally not signal efficiently. This is based on the fact that FGF18, signaling specifically through FGFR3, exerts an anabolic effect during chondrogenesis14–17.
Both FGF9 and FGF18 signal primarily through FGFR3, with signaling through FGFR1 and FGFR2 reported as secondary mechanisms23. We found that these two ligands in turn modulate FGFR3/FGFR1 expression at all stages in a feedback loop manner (especially FGFR3). This negative feedback of FGF9/FGF18 is reflected on the FGFR3:FGFR1 ratio, which although is maintained high, it becomes closer to physiological levels when compared to human articular cartilage (2.84±0.9), and contrasted to other skeletal tissues such as tendon: 0.71±0.33; cruciate ligaments: 0.85±0.34; meniscus: 1.14±0.46; muscle: 1.08±0.08 and trabecular bone: 1.77±0.04 (unpublished observations obtained from microarray analysis of human samples). Interestingly, both receptors were high at late stages of differentiation, where an anabolic response has been documented22. Given the antagonistic signaling downstream of these receptors, the FGFR3:FGFR1 ratio presented by Ellman et al. and Vincent et al.14,21 becomes key to the biological outcome of FGFs, and could be used to evaluate FGF9/FGF18 effects on hMSC chondrogenesis.
As the chondrogenic program of hMSC progresses, we found that FGF18 and FGF9, signaling through FGFR3, have anabolic effects on ECM production. Remarkably, we found a greater effect with FGF9 than with FGF18, allowing us to speculate a potential entry of FGF9 into clinical trials for the treatment of cartilage injuries, as FGF18 is currently under clinical investigation (www.clinicaltrials.gov NCT01066871, NCT01689337, NCT01033994, NCT01919164, NCT00911469). The addition of FGF9 only at early stages of differentiation has been shown to have no significant effect on GAG deposition, but a prolonged exposure can cause a significant decrease in GAG deposition12. Similarly, we found that the addition of FGF9 or FGF18 as early as day 0 and day 7 and until day 21 partially inhibits ECM deposition. In contrast, their addition at a later time point (from day 14 until day 21) stimulates an anabolic effect. These observations underline the temporal control of FGF supplementation, which is critical for successful hMSC-derived chondrogenesis. Furthermore, FGF9 and FGF18 mutant variants, which signal exclusively through FGFR3 had the greatest positive effects, unmasking the FGFR3-dependent effects and emphasizing the importance of avoiding downstream signaling antagonism. These differential effects of FGF signaling reflect the dependency on the differentiation state of the cells, the FGFRs repertoire they express at determined time points during the program and the presence of specific growth factors. This dynamic balance of FGFR expression is also important during disease. Yan and colleagues showed a significant reduction in FGFR3 expression in human osteoarthritis cartilage compared to normal post-mortem samples39, implying that exogenous administration of FGF9/FGF18 would have a suboptimum effect on this condition. Therefore, a potential novel therapeutic approach may be based on strategies that augment FGFR3 levels within diseased tissues in order to potentiate the beneficial effects of these FGF family members once administered42. Alternatively, more potent and/or highly selective ligands may well prove superior for cartilage repair and as disease modifying agents in OA.
An unanticipated consequence of expanding hMSC with FGF2 is the early appearance of hypertrophy-related features. This phenomenon can be explained by a shift in the entire differentiation program, so the cells prematurely experience these terminally differentiation changes as part of their intrinsic ability to enter and finish an endochondral ossification program. In the pre-hypertrophic and hypertrophic zones of developing cartilage, both FGF18 and FGF9 interact with FGFR1 to promote vascular invasion and further terminal differentiation22. Our results pointing towards an inhibitory role of FGFR3 signaling to hypertrophic terminal differentiation suggest that the high FGFR3:FGFR1 ratio obtained with FGF9/FGF18 would be favorable to avoid hypertrophic differentiation. On the other hand, data regarding the effect of TGF-β on hypertrophic differentiation are conflicting. Previous observations from our group show that hypertrophic differentiation of hMSC following BMP-2 administration could be delayed by co-treatment with TGF-β43. Contrary, other groups have reported that TGF-β can secondarily induce hypertrophy in in vitro differentiating hMSC9, as well as in vivo after implantation of pre-differentiated cartilage pellets in SCID mice8. Regardless of the controversy, our results suggest that co-treatment with FGF9 and FGF18 may become necessary to modulate the hypertrophic phenotypic conversion.
In conclusion, we found that a sequential exposure of hMSC to members of the FGF family of morphogens has a significant impact on three main challenges during in vitro chondrogenesis, that in turn have critical roles during the generation of engineered cartilage implants (Fig. 8): 1) cell expansion (FGF2): key to maximize hMSC expansion potential, as large numbers of cells are required for tissue engineering; 2) chondrogenic differentiation (FGF9/FGF18): critical determinant of the long-term durability and clinical success of engineered cartilage is the amount and composition of the secreted ECM, and 3) hypertrophic differentiation (FGF9/FGF18): as osteochondral progenitors, hMSC appear to follow an intrinsic differentiation program that involves progression to a terminal hypertrophic differentiation, an undesirable cellular phenotype when attempting to generate hyaline articular cartilage.
Figure 8. Proposed sequential stimulation program for chondrogenesis induction of hMSC.
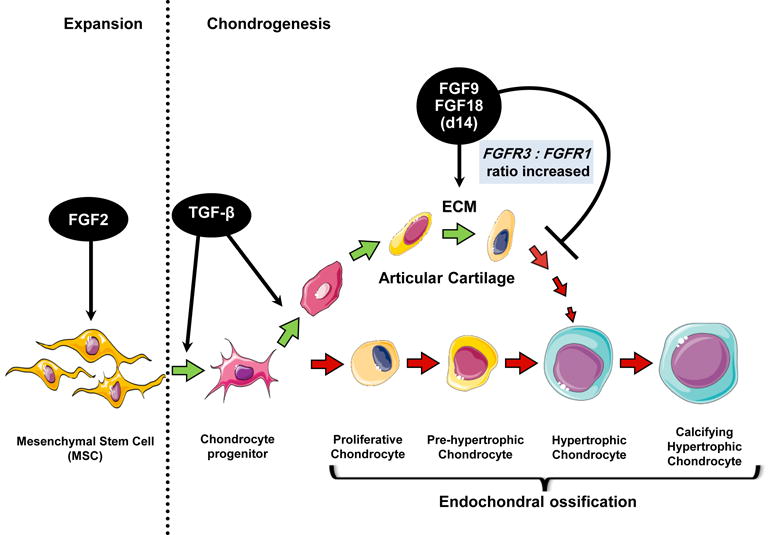
FGF2 is used to increase cell number and prime the cells for chondrogenesis (via Sox9 early appearance) during expansion, followed by stimulation with TGF-β to start chondrogenesis and either FGF9, FGF18 or FGFR3-specific ligands at day 14 (high FGFR3:FGFR1 ratio) to induce ECM secretion and delay the appearance of a hypertrophic phenotype. The program is intended to induce hMSC differentiation into a more stable pre-hypertrophic phenotype, typical of articular cartilage chondrocytes. Figure made with images available at Servier Medical Art (www.servier.fr).
Our results collectively constitute the basis for a re-evaluated proposition, one in which a factor not only has a specific effect on the cells but also establishes the ideal conditions for the action of another one sequentially delivered, that serves to amplify its effect. These data emphasize the importance of timing of exposure to the growth factors particularly due to the tight spatio-temporal control of these factors and their specific receptors at different stages of development. Understanding these temporal changes is therefore critical in determining the ligand-receptor interactions that are primarily responsible for the control of the ultimate cellular phenotype.
Supplementary Material
A) Expression of all three FGFRs (n=3) in control and FGF2-expanded cells after expansion (day 0), showing the significantly lower expression of FGFR3 and FGFR2 compared with FGFR1. P values are shown in the graph for clarity. B) FGFR2 expression (n=3) after expansion and during aggregate cultures in both control and FGF2-expanded cells, with and without FGF9 or FGF18 stimulation. C) FGF9 and FGF18 expression (n=3) after expansion (day 0) and during aggregate cultures in both control and FGF2-expanded cells. For B and C, all treatment groups were statistically significantly different (p<0.001) when compared to respective control-expanded and FGF2-expanded at d0. No statistical differences were found when Control and FGF2-expanded cells were compared at a particular time-point (p>0.3). ND = not detected. Table shows Ct values for the samples at day 0, showing very low levels of expression. The Ct values obtained for the housekeeping gene (HPRT) used to normalize these data were consistently similar across all samples.
A) Immunolocalization of the neutralizing FGFR3 antibody (added in culture at day 14) with an anti-mouse secondary antibody in sections of pellets harvested at day 21. Antibody image and Hoechst dye image are merged showing the cellular source of the antibody signal. Similar results adding the antibody at day 0 and day 7.
Summary of the conditions studied in the various experimental approaches employed. Important to note that day 14 of expansion is equivalent to day 0 of differentiation.
Acknowledgments
We want to thank Amad Awadallah for the histological processing of the samples and Donald Lennon and Margie Harris for the hMSC cell preparations.
FUNDING SOURCE: This project was funded by NIH grant PO1 AR053622 (NIAMS) and the L. David and E. Virginia Baldwin Foundation.
Footnotes
Publisher's Disclaimer: This is a PDF file of an unedited manuscript that has been accepted for publication. As a service to our customers we are providing this early version of the manuscript. The manuscript will undergo copyediting, typesetting, and review of the resulting proof before it is published in its final citable form. Please note that during the production process errors may be discovered which could affect the content, and all legal disclaimers that apply to the journal pertain.
AUTHOR CONTRIBUTION:
Diego Correa, Rodrigo Somoza: conception and design of study, acquisition of data, analysis and interpretation of results, drafting and revising the manuscript and final approval of the submitted article.
Paul Lin, Steve Greenberg, and Lori Duesler: acquisition of data.
Eran Rom and Avner Yayon: synthesis of FGF mutant variants and FGFR neutralizing antibodies, interpretation of data and revising the manuscript.
Jean F. Welter: interpretation of data and revising the manuscript.
Arnold I Caplan: conception and design of study, analysis and interpretation of results and final approval of the submitted article.
COMPETING INTEREST:
The authors have no conflicts of interest to disclose. A. Y. and E. R. are employees of Procore Ltd.
Contributor Information
Diego Correa, Email: dxc319@case.edu.
Rodrigo A. Somoza, Email: ras286@case.edu.
Paul Lin, Email: pxl57@case.edu.
Steven Greenberg, Email: sag84@case.edu.
Eran Rom, Email: eran@procore-bio.com.
Lori Duesler, Email: lrm8@case.edu.
Jean F. Welter, Email: jfw2@case.edu.
Avner Yayon, Email: yayon@procore-bio.com.
Arnold I. Caplan, Email: arnold.caplan@case.edu.
References
- 1.Barry F. Chondrogenic Differentiation of mesenchymal stem cells from bone marrow: differentiation-dependent gene expression of matrix components. Experimental Cell Research. 2001;268(2):189–200. doi: 10.1006/excr.2001.5278. [DOI] [PubMed] [Google Scholar]
- 2.Caplan AI. Why are MSCs therapeutic? new data: new insight. J Pathol. 2009;217(2):318–324. doi: 10.1002/path.2469. [DOI] [PMC free article] [PubMed] [Google Scholar]
- 3.Richardson SM, Hoyland JA, Mobasheri R, Csaki C, Shakibaei M, Mobasheri A. Mesenchymal stem cells in regenerative medicine: opportunities and challenges for articular cartilage and intervertebral disc tissue engineering. J Cell Physiol. 2010;222(1):23–32. doi: 10.1002/jcp.21915. [DOI] [PubMed] [Google Scholar]
- 4.Solchaga LA, Penick K, Goldberg VM, Caplan AI, Welter JF. Fibroblast growth factor-2 enhances proliferation and delays loss of chondrogenic potential in human adult bone-marrow-derived mesenchymal stem cells. Tissue Eng Part A. 2010;16(3):1009–1019. doi: 10.1089/ten.tea.2009.0100. [DOI] [PMC free article] [PubMed] [Google Scholar]
- 5.Solchaga LA, Penick K, Porter JD, Goldberg VM, Caplan AI, Welter JF. FGF-2 enhances the mitotic and chondrogenic potentials of human adult bone marrow-derived mesenchymal stem cells. J Cell Physiol. 2005;203(2):398–409. doi: 10.1002/jcp.20238. [DOI] [PubMed] [Google Scholar]
- 6.Mueller MB, Fischer M, Zellner J, Berner A, Dienstknecht T, Prantl L, et al. Hypertrophy in mesenchymal stem cell chondrogenesis: effect of TGF-beta isoforms and chondrogenic conditioning. Cells Tissues Organs. 2010;192(3):158–166. doi: 10.1159/000313399. [DOI] [PMC free article] [PubMed] [Google Scholar]
- 7.Mueller MB, Tuan RS. Functional characterization of hypertrophy in chondrogenesis of human mesenchymal stem cells. Arthritis Rheum. 2008;58(5):1377–1388. doi: 10.1002/art.23370. [DOI] [PMC free article] [PubMed] [Google Scholar]
- 8.Pelttari K, Winter A, Steck E, Goetzke K, Hennig T, Ochs BG, et al. Premature induction of hypertrophy during in vitro chondrogenesis of human mesenchymal stem cells correlates with calcification and vascular invasion after ectopic transplantation in SCID mice. Arthritis Rheum. 2006;54(10):3254–3266. doi: 10.1002/art.22136. [DOI] [PubMed] [Google Scholar]
- 9.Steinert AF, Proffen B, Kunz M, Hendrich C, Ghivizzani SC, Nöth U, et al. Hypertrophy is induced during the in vitro chondrogenic differentiation of human mesenchymal stem cells by bone morphogenetic protein-2 and bone morphogenetic protein-4 gene transfer. Arthritis Res Ther. 2009;11(5):R148. doi: 10.1186/ar2822. [DOI] [PMC free article] [PubMed] [Google Scholar]
- 10.Gadjanski I, Spiller K, Vunjak-Novakovic G. Time-dependent processes in stem cell-based tissue engineering of articular cartilage. Stem Cell Rev. 2012;8(3):863–881. doi: 10.1007/s12015-011-9328-5. [DOI] [PMC free article] [PubMed] [Google Scholar]
- 11.Oldershaw RA, Baxter MA, Lowe ET, Bates N, Grady LM, Soncin F, et al. Directed differentiation of human embryonic stem cells toward chondrocytes. Nature Biotechnology. 2010;28(11):1187–1194. doi: 10.1038/nbt.1683. [DOI] [PubMed] [Google Scholar]
- 12.Hellingman CA, Koevoet W, Kops N, Farrell E, Jahr H, Liu W, et al. Fibroblast growth factor receptors in in vitro and in vivo chondrogenesis: relating tissue engineering using adult mesenchymal stem cells to embryonic development. Tissue Engineering Part A. 2010;16(2):545–556. doi: 10.1089/ten.TEA.2008.0551. [DOI] [PubMed] [Google Scholar]
- 13.Weiss S, Hennig T, Bock R, Steck E, Richter W. Impact of growth factors and PTHrP on early and late chondrogenic differentiation of human mesenchymal stem cells. J Cell Physiol. 2010;223(1):84–93. doi: 10.1002/jcp.22013. [DOI] [PubMed] [Google Scholar]
- 14.Ellman MB, Yan D, Ahmadinia K, Chen D, An HS, Im HJ. Fibroblast growth factor control of cartilage homeostasis. J Cell Biochem. 2013;114(4):735–742. doi: 10.1002/jcb.24418. [DOI] [PMC free article] [PubMed] [Google Scholar]
- 15.Davidson D, Blanc A, Filion D, Wang H, Plut P, Pfeffer G, et al. Fibroblast growth factor (FGF) 18 signals through FGF receptor 3 to promote chondrogenesis. J Biol Chem. 2005;280(21):20509–20515. doi: 10.1074/jbc.M410148200. [DOI] [PubMed] [Google Scholar]
- 16.Ellsworth JL, Berry J, Bukowski T, Claus J, Feldhaus A, Holderman S, et al. Fibroblast growth factor-18 is a trophic factor for mature chondrocytes and their progenitors. Osteoarthritis and Cartilage. 2002;10(4):308–320. doi: 10.1053/joca.2002.0514. [DOI] [PubMed] [Google Scholar]
- 17.Moore EE, Bendele AM, Thompson DL, Littau A, Waggie KS, Reardon B, et al. Fibroblast growth factor-18 stimulates chondrogenesis and cartilage repair in a rat model of injury-induced osteoarthritis. Osteoarthritis and Cartilage. 2005;13(7):623–631. doi: 10.1016/j.joca.2005.03.003. [DOI] [PubMed] [Google Scholar]
- 18.Beenken A, Mohammadi M. The FGF family: biology, pathophysiology and therapy. Nature Reviews Drug Discovery. 2009;8(3):235–253. doi: 10.1038/nrd2792. [DOI] [PMC free article] [PubMed] [Google Scholar]
- 19.Hung IH, Yu K, Lavine KJ, Ornitz DM. FGF9 regulates early hypertrophic chondrocyte differentiation and skeletal vascularization in the developing stylopod. Developmental Biology. 2007;307(2):300–313. doi: 10.1016/j.ydbio.2007.04.048. [DOI] [PMC free article] [PubMed] [Google Scholar]
- 20.Govindarajan V, Overbeek PA. FGF9 can induce endochondral ossification in cranial mesenchyme. BMC Developmental Biology. 2006;6:7. doi: 10.1186/1471-213X-6-7. [DOI] [PMC free article] [PubMed] [Google Scholar]
- 21.Vincent TL. Explaining the fibroblast growth factor paradox on osteoarthritis: lessons from conditional knockout mice. Arthritis & Rheumatism. 2012;64(12):3835–3838. doi: 10.1002/art.34648. [DOI] [PubMed] [Google Scholar]
- 22.Hidaka C, Goldring MB. Regulatory mechanisms of chondrogenesis and implications for understanding articular cartilage homeostasis. Current Rheumatology Reviews. 2008;4(3):136–147. [Google Scholar]
- 23.Zhang X, Ibrahimi OA, Olsen SK, Umemori H, Mohammadi M, Ornitz DM. Receptor specificity of the fibroblast growth factor family. The complete mammalian FGF family. J Biol Chem. 2006;281(23):15694–15700. doi: 10.1074/jbc.M601252200. [DOI] [PMC free article] [PubMed] [Google Scholar]
- 24.Haynesworth SE, Goshima J, Goldberg VM, Caplan AI. Characterization of cells with osteogenic potential from human marrow. Bone. 1992;13(1):81–88. doi: 10.1016/8756-3282(92)90364-3. [DOI] [PubMed] [Google Scholar]
- 25.Vunjak-Novakovic G, Freshney RI. Culture of Cells for Tissue Engineering. John Wiley & Sons; 2006. [Google Scholar]
- 26.Carrino DA, Arias JL, Caplan AI. A spectrophotometric modification of a sensitive densitometric Safranin O assay for glycosaminoglycans. Biochemistry International. 1991;24(3):485–495. [PubMed] [Google Scholar]
- 27.Livak KJ, Schmittgen TD. Analysis of relative gene expression data using real-time quantitative PCR and the 2(-Delta Delta C(T)) method. Methods (San Diego, Calif) 2001;25(4):402–408. doi: 10.1006/meth.2001.1262. [DOI] [PubMed] [Google Scholar]
- 28.Solchaga LA, Penick K, Goldberg VM, Caplan AI, Welter JF. Fibroblast growth factor-2 enhances proliferation and delays loss of chondrogenic potential in human adult bone-marrow-derived mesenchymal stem cells. Tissue Engineering Part A. 2010;16(3):1009–1019. doi: 10.1089/ten.tea.2009.0100. [DOI] [PMC free article] [PubMed] [Google Scholar]
- 29.Puetzer JL, Petitte JN, Loboa EG. Comparative review of growth factors for induction of three-dimensional in vitro chondrogenesis in human mesenchymal stem cells isolated from bone marrow and adipose tissue. Tissue engineering Part B, Reviews. 2010;16(4):435–444. doi: 10.1089/ten.TEB.2009.0705. [DOI] [PubMed] [Google Scholar]
- 30.Martin I, Jakob M, Schäfer D, Dick W, Spagnoli G, Heberer M. Quantitative analysis of gene expression in human articular cartilage from normal and osteoarthritic joints. Osteoarthritis and Cartilage. 2001;9(2):112–118. doi: 10.1053/joca.2000.0366. [DOI] [PubMed] [Google Scholar]
- 31.Pei M, Seidel J, Vunjak-Novakovic G, Freed LE. Growth factors for sequential cellular de- and re-differentiation in tissue engineering. Biochemical and Biophysical Research Communications. 2002;294(1):149–154. doi: 10.1016/S0006-291X(02)00439-4. [DOI] [PubMed] [Google Scholar]
- 32.Worster AA, Brower-Toland BD, Fortier LA, Bent SJ, Williams J, Nixon AJ. Chondrocytic differentiation of mesenchymal stem cells sequentially exposed to transforming growth factor-beta1 in monolayer and insulin-like growth factor-I in a three-dimensional matrix. Journal of Orthopaedic Research. 2001;19(4):738–749. doi: 10.1016/S0736-0266(00)00054-1. [DOI] [PubMed] [Google Scholar]
- 33.Aaron RK, Wang S, Ciombor DM. Upregulation of basal TGFbeta1 levels by EMF coincident with chondrogenesis–implications for skeletal repair and tissue engineering. Journal of Orthopaedic Research. 2002;20(2):233–240. doi: 10.1016/S0736-0266(01)00084-5. [DOI] [PubMed] [Google Scholar]
- 34.Handorf AM, Li WJ. Fibroblast growth factor-2 primes human mesenchymal stem cells for enhanced chondrogenesis. PLoS One. 2011;6(7):e22887. doi: 10.1371/journal.pone.0022887. [DOI] [PMC free article] [PubMed] [Google Scholar]
- 35.de Crombrugghe B, Lefebvre V, Behringer RR, Bi W, Murakami S, Huang W. Transcriptional mechanisms of chondrocyte differentiation. Matrix Biol. 2000;19(5):389–394. doi: 10.1016/s0945-053x(00)00094-9. [DOI] [PubMed] [Google Scholar]
- 36.Lefebvre V, Huang W, Harley VR, Goodfellow PN, de Crombrugghe B. Sox9 is a potent activator of the chondrocyte-specific enhancer of the pro alpha1(II) collagen gene. Mol Cell Biol. 1997;17(4):2336–2346. doi: 10.1128/mcb.17.4.2336. [DOI] [PMC free article] [PubMed] [Google Scholar]
- 37.Coutu DL, François M, Galipeau J. Inhibition of cellular senescence by developmentally regulated FGF receptors in mesenchymal stem cells. Blood. 2011;117(25):6801–6812. doi: 10.1182/blood-2010-12-321539. [DOI] [PubMed] [Google Scholar]
- 38.Coutu DL, Galipeau J. Roles of FGF signaling in stem cell self-renewal, senescence and aging. Aging. 2011;3(10):920–933. doi: 10.18632/aging.100369. [DOI] [PMC free article] [PubMed] [Google Scholar]
- 39.Yan D, Chen D, Cool SM, van Wijnen AJ, Mikecz K, Murphy G, et al. Fibroblast growth factor receptor 1 is principally responsible for fibroblast growth factor 2-induced catabolic activities in human articular chondrocytes. Arthritis Research & Therapy. 2011;13(4):R130. doi: 10.1186/ar3441. [DOI] [PMC free article] [PubMed] [Google Scholar] [Retracted]
- 40.Robinson D, Hasharoni A, Cohen N, Yayon A, Moskowitz RM, Nevo Z. Fibroblast growth factor receptor-3 as a marker for precartilaginous stem cells. Clinical Orthopaedics and Related Research. 1999;(367 Suppl):S163–75. doi: 10.1097/00003086-199910001-00018. [DOI] [PubMed] [Google Scholar]
- 41.Gadjanski I, Spiller K, Vunjak-Novakovic G. Time-Dependent Processes in Stem Cell-Based Tissue Engineering of Articular Cartilage. Stem Cell Reviews and Reports. 2011;8(3):863–881. doi: 10.1007/s12015-011-9328-5. [DOI] [PMC free article] [PubMed] [Google Scholar]
- 42.Vincent TL. Fibroblast growth factor 2: good or bad guy in the joint? Arthritis Research & Therapy. 2011;13(5):127. doi: 10.1186/ar3447. [DOI] [PMC free article] [PubMed] [Google Scholar]
- 43.Hanada K, Solchaga LA, Caplan AI, Hering TM, Goldberg VM, Yoo JU, et al. BMP-2 induction and TGF-beta 1 modulation of rat periosteal cell chondrogenesis. Journal of Cellular Biochemistry. 2001;81(2):284–294. doi: 10.1002/1097-4644(20010501)81:2<284::aid-jcb1043>3.0.co;2-d. [DOI] [PubMed] [Google Scholar]
Associated Data
This section collects any data citations, data availability statements, or supplementary materials included in this article.
Supplementary Materials
A) Expression of all three FGFRs (n=3) in control and FGF2-expanded cells after expansion (day 0), showing the significantly lower expression of FGFR3 and FGFR2 compared with FGFR1. P values are shown in the graph for clarity. B) FGFR2 expression (n=3) after expansion and during aggregate cultures in both control and FGF2-expanded cells, with and without FGF9 or FGF18 stimulation. C) FGF9 and FGF18 expression (n=3) after expansion (day 0) and during aggregate cultures in both control and FGF2-expanded cells. For B and C, all treatment groups were statistically significantly different (p<0.001) when compared to respective control-expanded and FGF2-expanded at d0. No statistical differences were found when Control and FGF2-expanded cells were compared at a particular time-point (p>0.3). ND = not detected. Table shows Ct values for the samples at day 0, showing very low levels of expression. The Ct values obtained for the housekeeping gene (HPRT) used to normalize these data were consistently similar across all samples.
A) Immunolocalization of the neutralizing FGFR3 antibody (added in culture at day 14) with an anti-mouse secondary antibody in sections of pellets harvested at day 21. Antibody image and Hoechst dye image are merged showing the cellular source of the antibody signal. Similar results adding the antibody at day 0 and day 7.
Summary of the conditions studied in the various experimental approaches employed. Important to note that day 14 of expansion is equivalent to day 0 of differentiation.


