Abstract
The endoplasmic reticulum (ER) contains the highest level of intracellular calcium, with concentrations approximately 5,000-fold greater than cytoplasmic levels. Tight control over ER calcium is imperative for protein folding, modification and trafficking. Perturbations to ER calcium can result in the activation of the unfolded protein response, a three-prong ER stress response mechanism, and contribute to pathogenesis in a variety of diseases. The ability to monitor ER calcium alterations during disease onset and progression is important in principle, yet challenging in practice. Currently available methods for monitoring ER calcium, such as calcium-dependent fluorescent dyes and proteins, have provided insight into ER calcium dynamics in cells, however these tools are not well suited for in vivo studies. Our lab has demonstrated that a modification to the carboxy-terminus of Gaussia luciferase confers secretion of the reporter in response to ER calcium depletion. The methods for using a luciferase based, secreted ER calcium monitoring protein (SERCaMP) for in vitro and in vivo applications are described herein. This video highlights hepatic injections, pharmacological manipulation of GLuc-SERCaMP, blood collection and processing, and assay parameters for longitudinal monitoring of ER calcium.
Keywords: Cellular Biology, Issue 103, SERCaMP, calcium, endoplasmic reticulum, ER stress, reporter protein, MANF, Gaussia luciferase, liver, neuroscience, rat
Introduction
The endoplasmic reticulum (ER) functions in many cellular capacities including protein folding, protein secretion, lipid homeostasis, and intracellular signaling1. Central to normal ER function is maintaining luminal calcium concentrations at ~5,000 times those found in the cytoplasm2-4. This energy intensive process is regulated by the sarco/endoplasmic reticulum calcium ATPase (SERCA), a pump that moves calcium ions into the ER. Efflux of calcium from the ER is mediated primarily by the ryanodine (RyR) and inositol triphosphate (IP3R) receptors. Because many ER processes are dependent on calcium, disrupting the store can lead to ER stress and eventual cell death.
ER calcium dysregulation has been observed in diseases including cardiomyopathy, diabetes, Alzheimer’s, and Parkinson’s5. Owing to the progressive nature of these diseases, it has been challenging to delineate the cause-effect relationship between pathogenesis and alterations in the ER calcium store. A number of technologies have allowed for significant advances in our understanding of ER calcium dynamics, including dyes and genetically encoded calcium indicators (GECIs). Low affinity calcium dyes, which increase in fluorescence when bound to Ca2+, can be loaded into cells to examine subcellular compartments with high concentrations of calcium6. GECIs, such as D1ER and CatchER allow for monitoring of calcium fluctuations with more precise control of subcellular localization7-9. Recently, another class of GECIs called calcium-measuring organelle-entrapped protein indicators (CEPIA) have been described10. A third approach combining genetics and small molecule chemistry is targeted-esterase dye loading (TED), which utilizes a genetically encoded carboxylesterase (targeted to the ER) with an ester-based calcium dye11.
While the aforementioned approaches have inherent strengths and weaknesses, they can provide valuable insight into ER calcium dynamics through acute measurements of fluorescence. They are, however, not optimal for the longitudinal studies often required to investigate disease progression. With the goal of devising a method to monitor calcium dynamics over extended periods of time, we identified and developed a protein modification to create the secreted ER calcium monitoring proteins (SERCaMPs)12.
SERCaMP circumvents several limitations associated with other methodologies, by providing a minimally invasive approach to repeatedly interrogate the ER calcium store. We have previously demonstrated that the carboxy-terminal peptide ASARTDL (alanine-serine-alanine-arginine-threonine-aspartic acid-leucine) is sufficient to promote ER retention; however, under conditions that cause decreases in ER calcium, the peptide sequence is no longer able to retain ER localization and the protein is secreted13. The basis of the SERCaMP technology is the appendage of ASARTDL to the carboxy-terminus of a secreted protein (e.g. Gaussia luciferase, or GLuc) such that secretion is triggered by ER calcium depletion, thus creating a robust reporter of ER calcium dysregulation12. The expression of GLuc-SERCaMP via transgenic methods enables biological fluids including cell culture medium and plasma to be analyzed for changes in GLuc activity as an indicator of ER calcium homeostasis. The method has applications for the longitudinal study of progressive alterations in the ER calcium store both in vitro and in vivo. The following protocol is written as a general outline for using GLuc-based SERCaMP to study ER calcium homeostasis, but the protocol can serve as a guide for alternative reporter SERCaMPs.
Protocol
1. In Vitro Assay: Detecting SERCaMP Release from a Stable SH-SY5Y Cell Line
- Plate SH-SY5Y-GLuc-ASARTDL (SERCaMP) in tissue culture treated plates at 150,000 cells per cm2 of surface area. For 96 well plates, for example, seed 50,000 cells per well (Figure 1A). Grow SH-SY5Y cells in DMEM (high glucose, GlutaMAX, pyruvate) + 10% bovine growth serum + 1x penicillin/streptomycin.
- Passage cells up to 15 times (Figure 1B). Higher passage number has not been tested.
- Return cells to humidified incubator at 37 °C with 5.5% CO2 and incubate overnight.
Before experimental treatment(s), collect a baseline sample for each well by transferring 5 µl of culture supernatant to an opaque walled 96 well plate. Before collecting, gently tap the plate on all sides and swirl to avoid gradient effects. Seal the opaque plate with an adhesive sealing sheet and store at 4 °C until time of enzymatic assay. Note: Secreted GLuc-SERCaMP is very stable in cell culture medium. We previously reported approximately 5-10% of GLuc activity was lost after a 72 hr incubation at 37 °C (incubated on SH-SY5Y cells)12.
- Treat cells as desired to examine ER calcium depletion (e.g. environmental, pharmacologic, genetic manipulations). Avoid long exposure to ambient environment (outside of the controlled incubator) as pH changes will rapidly occur at atmospheric CO2. Add HEPES to the culture medium at 20 mM, to stabilize pH14, if prolonged manipulations are required. Avoid exposure to light when using HEPES in culture medium15.
- Positive control: Treat cells with 100 nM thapsigargin (Tg) or 50 µM cyclopiazonic acid (CPA) for 4-6 hr for experiments in SH-SY5Y cells. Maximal response in other cell lines may require longer incubations or different concentrations of compounds.
- Negative control: Collect culture medium from parental SH-SY5Y cells. In our experience, the background luminescence for this assay is less than 0.05% of basal secretion from stable SH-SY5Y-GLuc-SERCaMP cells.
Collect and store 5 µl samples of conditioned media at the desired timepoints, as outlined in step 1.2.
Assess enzymatic activity in the medium as outlined in Section 5.
- Examine intracellular GLuc by immunoblot or luminescence assay.
- For immunoblot: lyse cells in modified RIPA buffer containing 50 mM Tris (pH 7.4), 150 mM NaCl, 0.25% sodium deoxycholate, 1 mM EDTA, 1% NP40, and protease inhibitors. Separate on SDS-polyacrylamide gel and transfer to 0.20 µm PVDF membrane. Incubate membrane with GLuc antibody (1:2,000 dilution) overnight at 4 °C. Perform secondary antibody incubation and membrane washes as per user-defined protocol for detection reagent of choice.
- For luminescence assay (Figure 2): perform the following steps on ice:
- Remove all medium from wells of the tissue culture plate and rinse with 200 µl of cold PBS.
- Add 75 µl of lysis buffer containing 50 mM Tris (pH 7.5), 150 mM NaCl, 1% NP40 and protease inhibitors to each well.
- Rotate the plate on an orbital shaker (120 rpm) at 4 °C for 20 min.
- Gently pipette the lysate up and down using a multichannel pipettor, avoiding air bubbles. Transfer 5 µl of lysate to an opaque plate and assess luminescence as outlined in Section 5.
2. In Vitro Assay: Transient Transfection of Immortalized Cells with SERCaMP
Note: We have observed that transient transfection procedures can induce cellular stress and blunt the subsequent GLuc-SERCaMP response. The following approach was developed to minimize transfection effects in SH-SY5Y cells. Optimization of this procedure (including choice of transfection reagent) for alternate cell lines may be required. When possible, it is recommended to use stable cell lines or viral transduction methods outlined in Sections 1 and 3 respectively.
Plate SH-SY5Y cells in a 100 mm dish at 4 x 10⁶ cells. This dish will be sufficient to re-seed approximately 300 wells (96 well plate format) following the transfection procedure.
Transfect cells with Xfect reagent using 20 µg of plasmid DNA (encoding GLuc-SERCaMP) and 6 µl of Xfect reagent. Scale DNA and Xfect reagent accordingly for larger or smaller culture vessels.
Return cells to incubator for 48 hr.
Trypsinize cells and reseed to 96 well plates at 60,000 cells per well. Follow subsequent steps outlined in Section 1.
3. In Vitro Assay: Viral Vector-mediated Expression of GLuc-SERCaMP
Note: Adeno-associated viral (AAV) vector packaging16 and purification12 and lentivirus production13 have been previously reported.
- Titer GLuc-SERCaMP AAV using the following primers and probes: forward primer, 5′-CACGCCCAAGATGAAGAAGT-3′; reverse primer, 5′-GAACCCAGGAATCTCAGGAATG-3′; probe (5′-6-FAM/3′-BHQ-1 labeled), 5′-TACGAAGGCGACAAAGAGTCCGC-3’ for quantitative PCR.
- Prepare the standard curve by linearizing a plasmid containing GLuc and purifying the DNA using a spin-column (e.g. Machery-Nagel NucleoSpin Gel and PCR cleanup). Quantitate the DNA by separating on an agarose gel alongside a mass ladder. Prepare 1:10 dilutions of DNA from 100 pg/ml to 10 fg/ml in PBS. Calculate the copies/ml of GLuc plasmid DNA at each of the concentrations based on the molecular weight of the plasmid.
- Dilute the AAV stocks in PBS (appropriate dilution will be dependent on parameters of viral preparation and determined empirically).
- Run the PCR reaction in a real-time PCR system using the following conditions: 95 °C × 5 min, 94 °C × 20 sec, and 60 °C × 1 min for 41 cycles. Calculate copies/mL using the standard curve.
- Titer lentivirus with a p24 Lenti-X rapid titer kit. Thaw lentiviral aliquots on ice and dilute the p24 control protein in SH-SY5Y medium.
- Dilute the lentivirus such that it will fall on the standard curve (e.g. 1:20,000 or 1:100,000). The dilution factor required will vary based on the lentiviral preparation parameters and must be determined empirically. Follow the manufacturer’s instructions for all subsequent steps.
Plate cells to 96 well plates. For SH-SY5Y cells, plating procedures outlined in Section 1 can be followed. For rat primary cortical neurons, cells should be isolated and seeded on appropriately coated plates as previously described16. Maintain rat primary cortical neurons in Neurobasal medium supplemented with 1x B27 and 500 µM L-glutamine. Perform half medium exchanges every other day.
- Transduce the cells with virus. The goal of viral transduction is to achieve low level expression, as Gaussia luciferase provides robust signal.
- AAV transduction SH-SY5Y cells: Transduce the day following plating. Dilute AAV to 6.0 x 10⁷ vg/µl in AAV dilution buffer (PBS + 0.5mM MgCl2). Add 5 µl of diluted AAV (3.0 x 10⁸ vg; MOI of approximately 6,000) per well of 96 well plate (Figure 3A). Use 10% bleach to inactivate viral vector waste.
- AAV transduction of rat primary cortical neurons: Transduce 6-8 days after plating. Dilute AAV to 4.0 x 10⁶ vg/µl in AAV dilution buffer. Add 5 µl of diluted AAV (2.0 x 10⁷ vg; MOI of approximately 350) per well of 96 well plate (Figure 3B). The optimal MOI should be determined empirically for other cell types. Use 10% bleach to inactivate viral vector waste.
- Lentiviral transduction of SH-SY5Y cells: Transduce the day following plating. Dilute lentivirus to 20 pg/µl p24 (concentration determined using titering kit) in Hank’s balanced salt solution. Add 5µl of the diluted virus per well (100 pg of p24, equivalent to 1,250,000 lentiviral particles, or ~1,250 IFUs) of a 96 well plate containing 100 µl volume. Scale accordingly for larger formats. Use 10% bleach to inactivate viral waste.
Collect a pre-treatment sample of medium and begin experimental treatments 48 hr (SH-SY5Y) or 5-7 days (rat primary cortical neurons) after transduction.
4. In Vivo SERCaMP Assay
Note: Before conducting any animal procedures be sure to obtain proper approval through your institution. All survival surgeries are to be done under sterile conditions with adequate anesthesia. All procedures described below have been approved and are in compliance with NIH ACUC guidelines.
Autoclave surgical instruments prior to start of surgery (121 °C, 30 min sterilization, 20 min dry time). Clean all instruments in an ultrasonicator immediately following all procedures and prior to autoclaving. Maintain sterile conditions during survival surgery. For surgeries requiring multiple animals, wipe surgical instruments with 70% alcohol, ultrasonicate and bead sterilize between rats. Refer to Materials List for necessary instruments.
- Prepare rat for surgery. Here we use male Sprague-Dawley (180-200 g).
- Anesthetize rats using gas isoflurane for 3 min (4-5% Isoflurane delivered at 1,000 cc/min) followed by intraperitoneal injections of xylazine (8 mg/kg) and ketamine (80 mg/kg). Apply ophthalmic ointment to protect corneas from drying out. Begin surgery once the rat is deeply anesthetized as demonstrated by lack of withdrawal reflex following tail or foot pinch.
- Shave the region of abdomen slightly below the ribs (low thoracic region) to the mid abdominal region. Scrub the surgical area three times, alternating 70% alcohol and Betadine scrub. Place rat in supine position on sterile surgical area with sterile surgical drapes.
- Dilute AAV-GLuc-SERCaMP to 7.6 x 10⁹ vg/ml (final concentration). Mix well by inverting the tube. Note: Range of viral concentration can vary (Figure 4).
- Pipet 105 µl of diluted AAV into a sterile dish. Use a 30-gauge needle to collect the virus into a syringe.
- Perform surgery to expose the liver and inject AAV-GLuc-SERCaMP.
- Prior to making an incision in the abdomen, apply 0.25% bupivacaine to the incision area. Using a scalpel, make a horizontal incision below rib cage (approximately 2-3 cm). Blunt dissect to separate connective tissue from hypodermis.
- Cut abdominal muscle, exposing the right medial lobe of liver. Note: additional lobes may be injected based on end application.
- Place animal under surgical microscope and adjust to get right medial lobe of liver in the field of view. Inject virus into parenchyma of the medial lobe; 3 separate sites, approximately 33 µl per site. Note: Leave needle in tissue for 5-10 sec following injection to ensure delivery of the entire injection volume.
- Suture the abdominal muscle and skin separately and add Neosporin using cotton tipped applicator. Place rat in a recovery chamber until consciousness is regained and rat is able to maintain upright position. Do not leave rat(s) unattended until it has regained sufficient consciousness to maintain sternal recumbency. House singly until the incision has healed and sutures have been removed (7-14 days). Note: As per NIH post-surgical guidelines, maintain surgical record. Annotate cage card with procedure, date, experiment identifier, body weight, and day of surgery. Pain/distress, feces production, activity, and food and water consumption are to be monitored and recorded 3 days post- surgery. Post-operative analgesia is provided by adding acetaminophen to the drinking water (450 mg/100 cc) although we do not typically observe signs of pain or distress following surgery.
Begin tail blood collection 4-7 days after injection. Prepare blood collection tubes by labeling and pre-weighing. Add 50 µl heparin (1,000 U/ml) to each tube.
- Place rat in isoflurane anesthesia chamber for 3 min (4-5% Isoflurane delivered at 1,000 cc/min). Remove rat from chamber and place in nose cone (2-3% Isoflurane delivered at 500 cc/min). Blood collection can begin once the rat is deeply anesthetized as demonstrated by lack of withdrawal reflex following tail pinch.
- Using sterile scissors cut tip of tail (1-2 mm) and collect blood drop-wise into pre-filled heparin tube. Collect blood until volume reaches greater than 2:1 blood to heparin ratio (>100 µl blood/50 µl heparin). Blood collection volumes can be adjusted based on experimental design. Use a wet cotton applicator to apply styptic powder to the tail to stop bleeding.
- Store blood tubes at 4 °C if collecting subsequent samples. Wipe scissors with ethanol pad and bead sterilize between collections.
- Weigh collection tubes and adjust with heparin to obtain 2:1 ratio (blood:heparin). This step will normalize the amount of heparin in each sample (Table 1).
- Centrifuge tubes at 2,000 x g for 5 min at 4 °C. Transfer the supernatant (plasma) to a fresh tube and store at -80 °C until time of luciferase assay (section 5). Note: Storage of samples at 4 °C up to 72 hr prior to enzymatic assay has minimal effect on luminescence (Figure 5A). Up to 3 freeze-thaw cycles of plasma samples have no effect on luminescence (Figure 5B).
- Thapsigargin administration (positive control):
- Prepare thapsigargin by diluting in ethanol to a final concentration of 2.5 mg/ml. Inject thapsigargin at 1 mg/kg i.p. into the lower abdomen. Note: Thapsigargin increases thrombin-induced platelet coagulation17 and can make blood collection from tail more difficult.
- Gaussia luciferase assay:
- Thaw the plasma samples on ice. Note: For longitudinal studies, thaw and perform luminescence assay for all timepoint samples on the same day (using single preparation of substrate).
- Transfer 10 µl of plasma to an opaque walled plate and measure enzymatic activity as described in section 5. Run 3-4 technical replicates of each plasma sample.
Euthanasia Note: The advantage of SERCaMP technology is the ability to longitudinally monitor ER calcium. Depending on experimental parameters and endpoint analyses, animals are to be euthanized by measures appropriate for endpoint analyses and in accordance with institutional ACUC guidelines.
5. Luminescence Assay
Prepare coelenterazine (CTZ) stock solutions by diluting the compound in acidified methanol (30 µl of 10 N HCl to 3 ml of methanol) to 20 mM. Prepare single use aliquots and store at -80 °C.
- Prepare the working substrate on the day of assay.
- For in vitro assays, dilute coelenterazine to 8 µM in PBS, e.g. add 10 µl of 20 mM CTZ stock to 25 ml of PBS (Figure 6A, B).
- For in vivo assays, dilute coelenterazine to 100 µM in PBS, 500 mM ascorbic acid, 5 mM NaCl.
Incubate prepared CTZ for at least 30 min at room temperature before beginning the assay. Note: This step is often included in Gaussia luciferase assays as there are reports of rapid substrate decay during first 30 min after preparing. We have not observed this effect in our system (Figure 6C); however, we often include the incubation step as we have found no negative impact on the assay.
Use a plate reader that is capable of monitoring bioluminescence and equipped with a substrate injector. Prime the lines with substrate. Note: The initial substrate through the lines can be prone to degradation. To avoid artificially low readings for early samples, inject 20-30 empty wells (loading an empty plate on the reader) before measuring experimental samples.
Inject 100 µl of substrate into well, shake medium speed for 5 sec, and measure light emission. For the Biotek Synergy II plate reader, integrate light emission over 0.5 sec (in vitro samples) and 5 sec (in vivo samples) for the read step. Optimize plate reader parameters for ideal assay performance. Note: Gaussia luciferase exhibits flash kinetics with rapid signal decay (compared to glow kinetics observed with other luciferases). The flash kinetics of GLuc is influenced by serum in cell culture medium (Figure 7A), highlighting the importance of controlling for medium composition across samples. Due to the rapid decay of luminescence after adding substrate (flash kinetics), the time between inject and read steps must be uniform for all samples. The plate reader should be set to inject substrate to a well, wait a fixed time (e.g. we use a 5 sec shake step), and read that well. Adding substrate to an entire plate before reading poses a significant challenge unless substrate can be added to all wells simultaneously. If an injector is not available, the issue can be partially circumvented by incubating the plate for 10 min between substrate addition and measurement (thus avoiding the steep part of the decay curve) (Figure 7B).
Repeat the injection, wait time, and read steps for each well on the plate.
Representative Results
The GLuc-SERCaMP method allows for assessment of ER calcium homeostasis by sampling extracellular fluids. Several controls can be included in the experimental design to enhance interpretation of results. First, use of a constitutively secreted reporter (e.g. GLuc without the C-terminal ASARTDL or “GLuc-No Tag”) can be employed to assess the effects of experimental treatments on the secretory pathway (global cellular secretion) and transgene expression. For instance, an increase in the extracellular levels of both GLuc-SERCaMP and GLuc-No Tag would be considered an ambiguous result. Alternatively, an increase in GLuc-SERCaMP secretion with a corresponding lack of GLuc-No Tag response supports an ER calcium dependent event (Figure 8). The secretion of GLuc-SERCaMP in response to ER calcium depletion can be further assessed by measuring intracellular GLuc, although this is limited to a single timepoint as lysis is required. Intracellular GLuc-SERCaMP will decrease in response to ER calcium depletion, as it is progressively secreted, and the extracellular:intracellular ratio (calculated for each individual well) will increase (Figure 2B). The extracellular:intracellular ratio is useful to control for changes in transgene expression.
Pharmacologic modulators of the ER calcium store can be utilized to confirm the contribution of ER calcium to SERCaMP release in novel paradigms. Dantrolene, a RyR antagonist, is known to stabilize ER calcium, which should reduce or inhibit the release of SERCaMP in response to Tg (Figure 8B). It is recommended, when possible, to test additional compounds that affect ER calcium flux (e.g. Xestospongin C, 4-chloro-m-cresol) in novel experimental paradigms employing SERCaMP. These studies are often challenging in vivo, but may be feasible in corresponding tissue culture models.
For in vitro studies using GLuc-based SERCaMP, is recommended to calculate responses on individual plates relative to the control(s). The ‘treatment-induced’ response can be assessed over the timecourse by tracking changes in relative response versus control (for between-plate comparisons). It is not advisable to compare raw numbers across multiple plates, owing to decay of substrate, which can lead to changes in the raw values between timepoints (Figure 6C). Making relative comparisons within a plate minimizes this effect (Figure 6D). An example of data analysis for an in vitro Tg-induced SERCaMP release experiment is presented in Figure 9.
For in vivo studies using GLuc-SERCaMP, data should be assessed independently for each animal, with every animal serving as its own ‘pre-treatment’ control. This is necessary to account for variability in transgene delivery and expression between animals (Figure 4A).
The magnitude of SERCaMP responses will be affected by a variety of factors, many of which are related to baseline health of the cells and can be directly controlled by the investigator. For maximal SERCaMP responsiveness, it is imperative to optimize conditions that favor basal ER calcium homeostasis. This includes seeding cells at optimal density and using low viral titers. Different cell and tissue types may have additional requirements, which should be determined empirically.
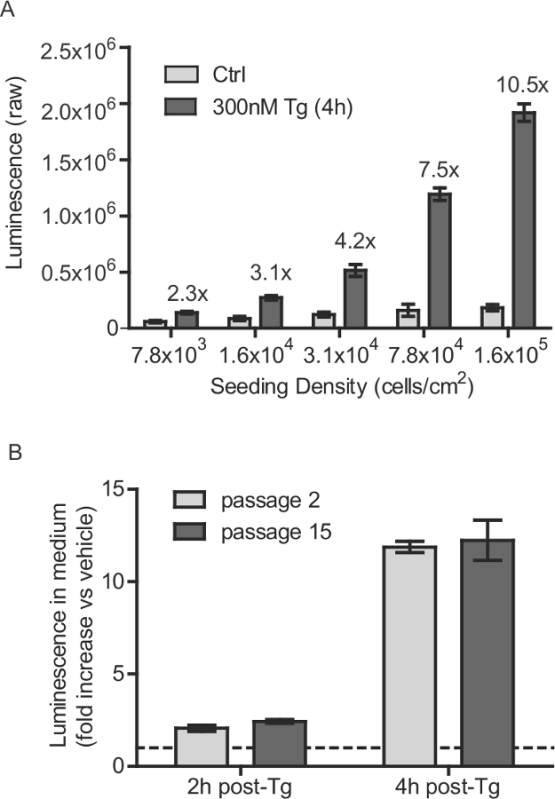 Figure 1: Stable SH-SY5Y cell line seeding density and passage number considerations. (A) SH-SY5Y-GLuc-SERCaMP cells were seeded at various densities and incubated for 40 hr. Secreted GLuc-SERCaMP was measured 4 hr after treatment with 300 nM Tg or vehicle control (mean ± SD, n = 6). Thapsigargin-induced increase in GLuc-SERCaMP secretion is indicated for each cell density. (B) SH-SY5Y-GLuc-SERCaMP cells at passage number 2 and 15 were examined for thapsigargin-induced secretion. Cells were treated with 100 nM Tg for 2 hr or 4 hr, and secreted GLuc activity was normalized to vehicle treated controls (mean ± SD, n = 4, no significant effect of passage-factor, 2-way ANOVA). Dashed line indicates y = 1. Please click here to view a larger version of this figure.
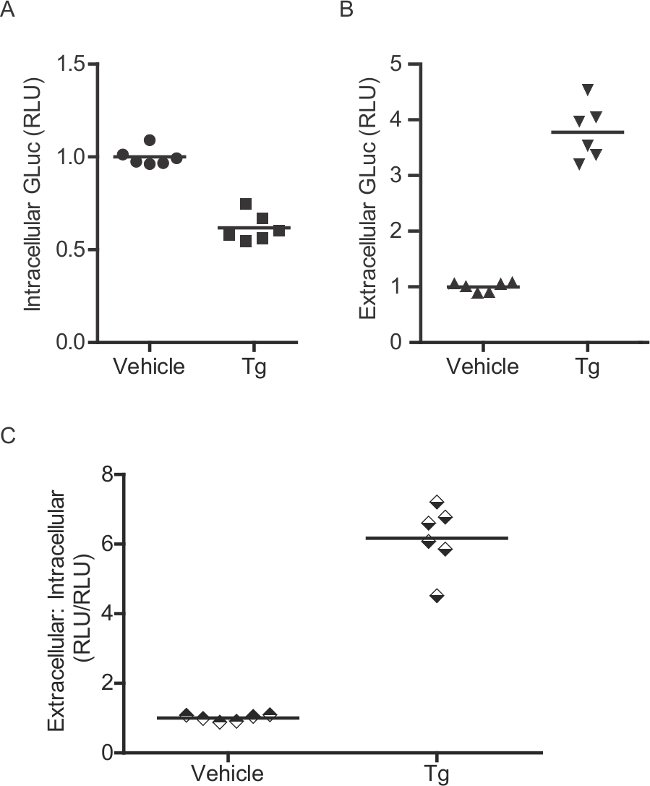 Figure 2: Enzymatic assay for measurement of intracellular GLuc-SERCaMP. (A) Intracellular and (B) extracellular GLuc enzymatic activity was assessed in rat primary cortical neurons (transduced with AAV-GLuc-SERCaMP). Six days after transduction, cells were treated with 60 nM thapsigargin for 4 hr. As GLuc-ASARTDL accumulates in the medium, corresponding decreases in intracellular levels are observed. (C) A ratio of extracellular: intracellular GLuc activity can be calculated for each individual well.
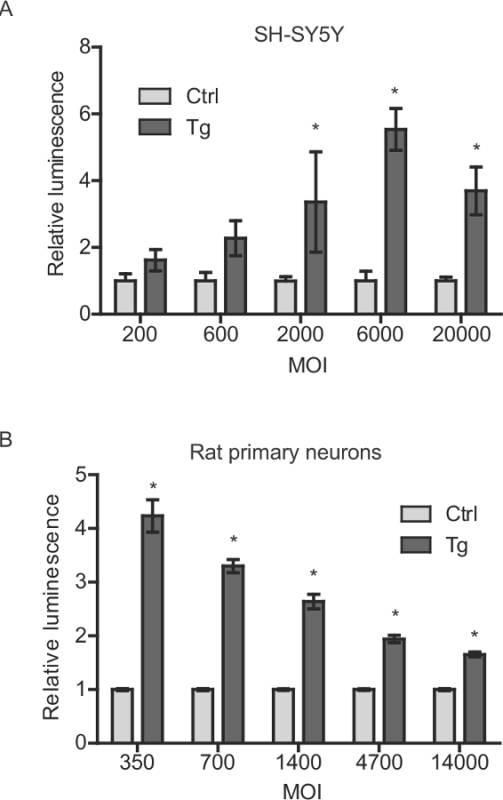 Figure 3: AAV-GLuc-ASARTDL titer versus thapsigargin-induced response for SH-SY5Y cells and rat primary cortical neurons. (A) SH-SY5Y cells were seeded in 96 well plates at 5 x 10⁴ cells per well and allowed to adhere overnight. Cells were transduced at the indicated multiplicity of infection (MOI), incubated for 48 hr and then treated with 300 nM Tg or vehicle. Luminescence was measured in the medium after 8 hr (mean ± SEM, n = 3). * p <0.05, multiple t-tests (Holm-Sidak correction). (B) Rat primary cortical neurons were transduced on DIV8 with AAV-GLuc-ASARTDL at the indicated MOI (calculated using 60,000 cells per well approximation at time of transduction). Five days after transduction, cells were treated with 100 nM Tg or vehicle control and luminescence in the medium was measured after 8 hr (mean ± SEM, n = 6). * p <0.05, multiple t-tests (Holm-Sidak correction).
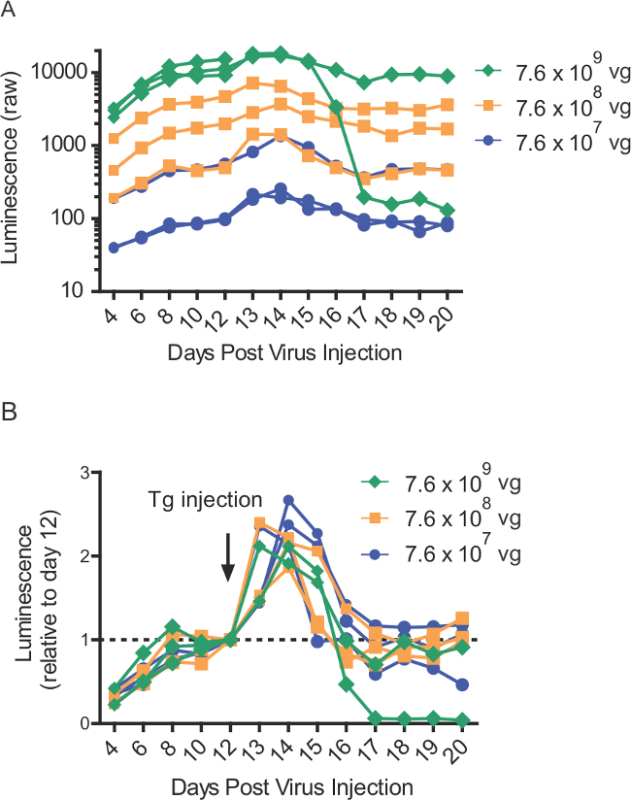 Figure 4: Thapsigargin-induced GLuc-SERCaMP release into blood following intrahepatic injections over range of viral titers. (A) Raw luminescence values from rats (n = 8) intrahepatically injected with different AAV-GLuc-ASARTDL titers. Thapsigargin (1 mg/kg) injection (i.p.) was administered on day 12. Blood was collected at indicated time points and stored at -80 °C until time of assay. (B) Normalized luminescence values from panel A, demonstrating thapsigargin-induced SERCaMP response in rats (n = 8) expressing various amounts of AAV-GLuc-ASARTDL.
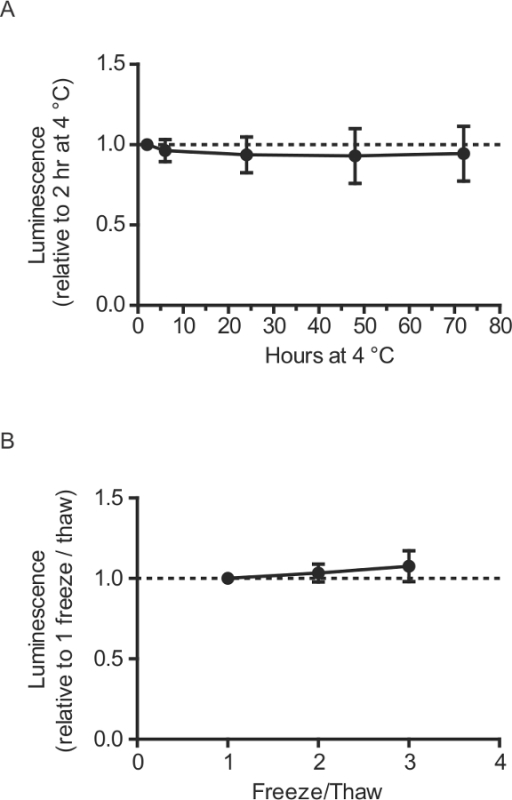 Figure 5: Handling and storage of GLuc-SERCaMP plasma samples (in vivo). (A) Plasma was collected from rats intrahepatically expressing GLuc-SERCaMP (n = 10), aliquoted and stored at -80 °C until time of assays. Tubes were removed from -80 °C and stored at 4 °C for indicated times prior to luminescence measurement (mean ± SD). (B) Effect of multiple freeze/thaws of plasma samples on GLuc enzymatic activity. Plasma samples collected from rats intrahepatically expressing AAV-GLuc-SERCaMP (n = 10) were subjected to the indicated number of freeze-thaw cycles and assayed for luminescence (mean ± SD).
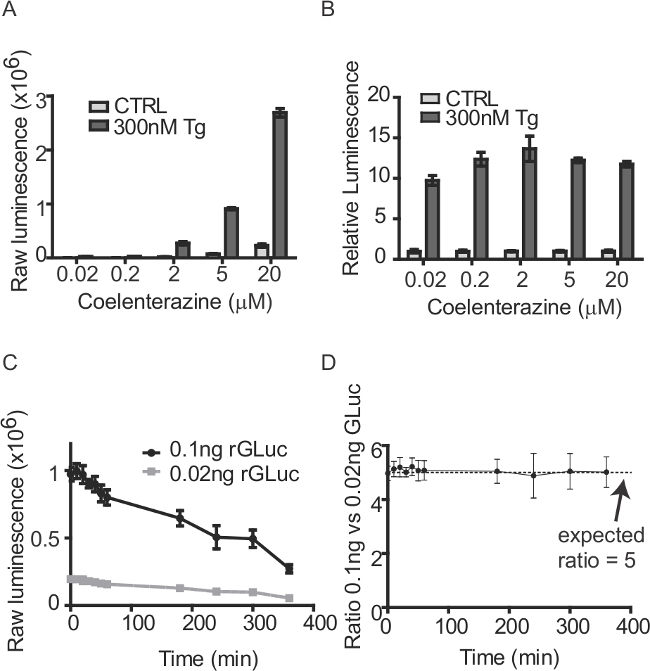 Figure 6: Preparing coelenterazine substrate for GLuc-SERCaMP assays. (A) Culture medium was collected from SH-SY5Y-GLuc-SERCaMP cells lines treated with 300 nM Tg (or vehicle control) for 5 hr. GLuc activity in the medium was assessed by injecting PBS + various concentrations of coelenterazine (mean ± SD, n = 6). (B) Luminescence values from panel A were normalized to vehicle treated control at each substrate concentration to assess the thapsigargin-induced effect. (C) Substrate decay over several hours. Luminescence from a known amount of recombinant GLuc (0.1 ng or 0.02 ng) was measured over several hours after preparing substrate (mean ± SD, n = 4). (D) While the raw luminescence for the recombinant GLuc decreased over time due to substrate decay, the fold difference in the samples (as determined by luminescence) was maintained.
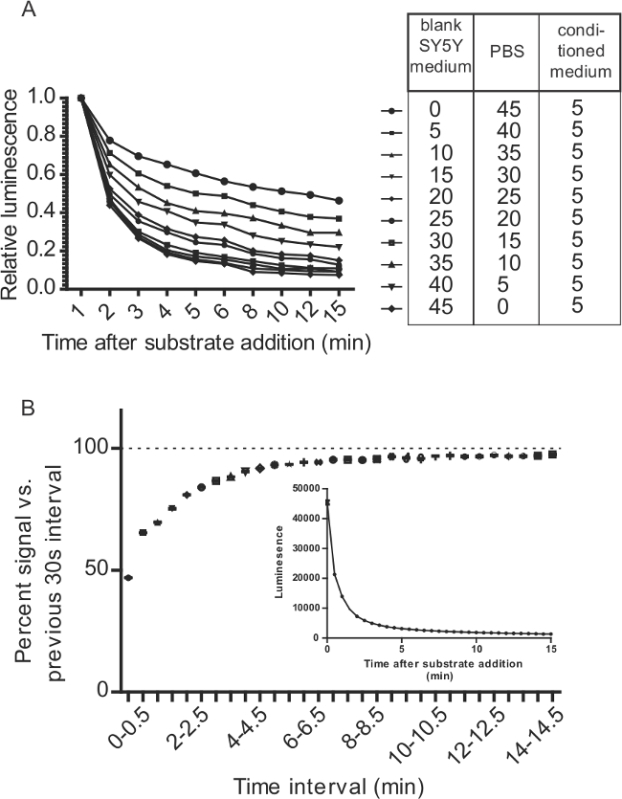 Figure 7: Considerations for GLuc-SERCaMP assays related to kinetics of GLuc/CTZ reaction. (A) Culture medium alters the decay of GLuc/CTZ signal. 5 µl of supernatant containing GLuc-SERCaMP was mixed with varying ratios of PBS and culture medium. 100 µl of substrate (15 µM CTZ in PBS + 500 mM ascorbic acid) was added to 50 µl of sample that was diluted as outlined in the table. Light emission was monitored over 15 min. (B) 5 µl of medium was collected from SH-SY5Y-GLuc-ASARTDL cells and 100 µl substrate (8 µM CTZ in PBS + 5 mM NaCl) was added. Luminescence was measured immediately after adding substrate (T = 0) and every 30 sec over the course of 15 min (± SD, n = 12). Data is plotted as the percent signal relative to the previous 30 sec interval to assess the rate of decay. The inset shows the raw luminescence data.
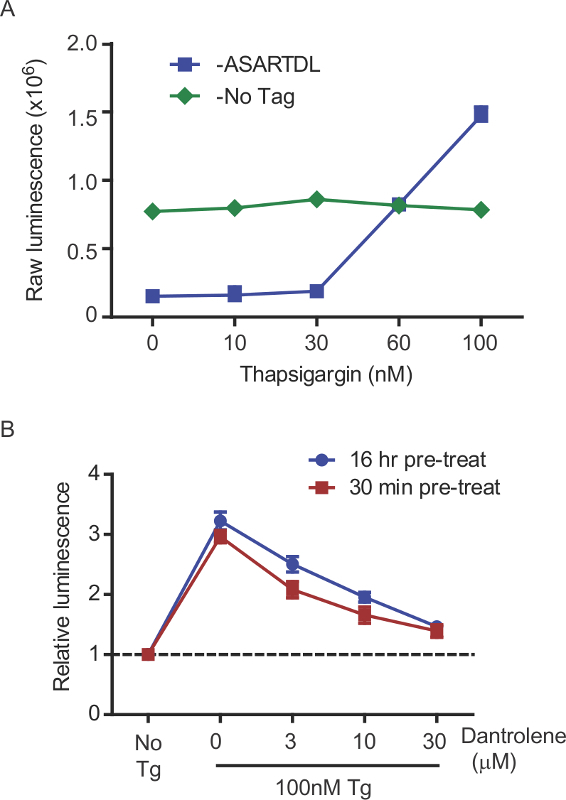 Figure 8: Pharmacologic corroboration of ER calcium depletion. (A) Effect of 100 nM thapsigargin on GLuc secretion was examined for GLuc-ASARTDL and GLuc-No Tag control (mean ± SD, n = 6). (B) Stabilizing ER calcium with dantrolene (RyR antagonist) inhibits Tg-induced SERCaMP release. Cells were pre-treated with the indicated concentrations of dantrolene for 30 min or 16 hr before addition of 100 nM thapsigargin. GLuc activity in the medium was measured after 4 hr (mean ± SD, n = 6).
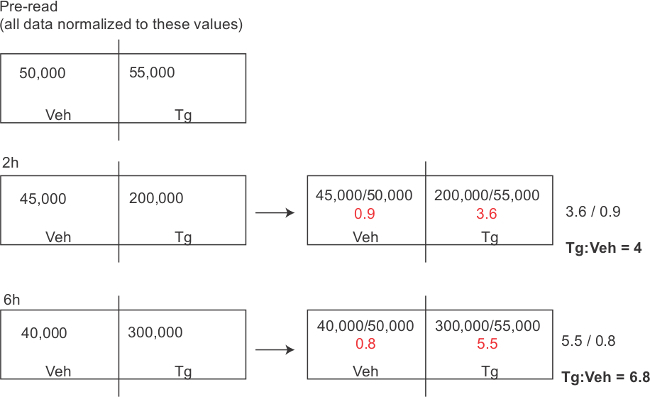 Figure 9: Mock representative results for the GLuc-SERCaMP assay. Note the vehicle treated values may decrease between plates, due to substrate breakdown (dependent on time interval between reading individual plates). To account for this effect, the treatment specific effect is calculated independently for each plate and this ratio is compared across plates.
| Date | Rat | Tube mass (mg) | Heparin volume (ml) | Heparin density (g/ml) | heparin mass (mg) | Mass of tube + heparin (mg) | Total mass after blood collection (mg) | Mass of collected blood (mg) | Density blood (g/ml) | Calculated volume blood (ul) | Volume of heparin needed for 2:1 ratio | ml additional heparin to add before spin |
| 01.01.15 | SD Male | 1135.9 | 50 | 1.117 | 55.83 | 1191.73 | 1317.70 | 125.97 | 1.05 | 119.97 | 59.98 | 9.98 |
Table 1: Blood collection table. Example of blood collection log for SERCaMP studies.
Discussion
This protocol highlights the in vitro and in vivo utility of GLuc-SERCaMP to monitor depletion of ER calcium. Although the protein modification to generate SERCaMP appears to generalize to other reporter proteins12, we chose Gaussia luciferase for its robust (200-1,000 fold greater) bioluminescence compared to other luciferases18. We demonstrate detectable thapsigargin-induced GLuc-SERCaMP release across a 100-fold dose range of GLuc-SERCaMP virus delivered to primary rat cortical neurons, SH-SY5Y cells, and rat liver (Figures 3 and 4). We previously described the generation of a stably transfected cell line expressing GLuc-ASARTDL and demonstrated that as few as 20 cells in a population of 5 x 10⁴ unlabeled cells can report a thapsigargin induced response12. Here we show that the stable cell line can consistently report Tg-induced response out to 15 passages, the most analyzed, indicating that continuous expression of the reporter over time does not impact its ability to be released in response to ER calcium depletion (Figure 1). Our data indicate that GLuc-SERCaMP is primarily held within the ER of a cell until a time of ER calcium depletion when it is secreted. Under “normal” conditions, there is a low basal secretion that allows the establishment of baseline ER calcium homeostasis12. Following ER calcium depletion by thapsigargin, levels of intracellular and extracellular luminescence change in opposite directions. This can be expressed as a ratio to indicate a shift in steady state distribution of the sensor (Figure 2). Importantly, as SERCaMP release is modulated by KDEL receptor expression12, the magnitude of release may vary depending on cell type. We envision that substituting ‘ASARTDL’ with alternate KDEL-like carboxy-terminal sequences may be required to achieve maximal SERCaMP response in a specific cell or tissue type.
For in vitro assays, levels of extracellular GLuc-SERCaMP will accumulate over time due to the stability of the secreted reporter; we reported an approximate 5-10% decrease in activity after 72 hr12. As such, exchanging medium prior to initiating a pharmacologic or genetic challenge to ER calcium homeostasis may be necessary to reduce background signal due to sensor accumulation. In contrast, the half-life of GLuc-SERCAMP in vivo is 3.5-4.7 min12 indicating signal in plasma represents a recent release of the reporter into circulating blood. Once blood is ex vivo and processed to plasma, however, GLuc-SERCaMP is very stable (Figure 5).
For the methodologies described, medium or plasma is transferred to opaque 96-well plates before enzymatic assays. Two important factors to consider when using GLuc-based reporters are the enzyme’s flash kinetics and breakdown of the coelenterazine substrate. Plate readers equipped with injectors are best suited for running GLuc enzymatic assays to normalize the time between substrate addition and luminescence measurements. The chemical properties of coelenterazine make it prone to decay, which precludes comparing raw luminescence values measured at different times after substrate preparation. Fold differences among samples, however, are maintained (Figure 6), allowing the relative difference between control and experimental samples to be tracked over the duration of experiments (Figure 9).
The ability to monitor ER calcium fluctuations in vivo is advantageous when investigating progressive diseases. While other methods, such as fluorescent cytoplasmic dyes, are suitable for acute in vitro studies, a SERCaMP reporter is the first to allow longitudinal ER calcium monitoring. Our protocol outlines direct hepatic injections of AAV-GLuc-SERCaMP. We have detected steady levels of GLuc-SERCaMP in circulation of unchallenged animals for 56 days post-injection (latest timepoint tested thus far) and predict longer experiments are possible12. AAV vectors are small in size, measuring approximately 20 nm in diameter, and pose minimal biosafety requirements19. To circumvent the conversion of AAV single-stranded genome to double-stranded DNA, AAV-SERCaMP was packaged as an AAV serotype-1 double-stranded vector20. AAV serotype-1 has been shown to effectively transduce rat livers 19,21; however, the caveat of our injection technique is the potential for virus to travel to other tissues throughout the body. Although the vector was directly injected into the liver, our methodology as presented cannot discern the source of SERCaMP release, and therefore it is possible that tissues other than the liver may contribute to the GLuc-SERCaMP signal. Future genetic manipulations will restrict expression to target tissue types. For example, tissue-specific Cre driver lines crossed with a Cre-dependent GLuc-SERCaMP will allow for tissue-specific monitoring of ER calcium via plasma sampling.
The described in vivo technique uses low viral titers due to the robust nature of the reporter. GLuc-SERCaMP release can be detected from a viral range of 7.6 x 10⁷ vg to 7.6 x 10⁹ vg (Figure 4). This range is 4-400 times lower than reported in previous work utilizing firefly luciferase-based viral injections of the liver19. At higher concentrations, we observed a loss of detectable expression over time, which is possibly due to an immune response of the animal to the transgene22. Higher titers of virus should be avoided when possible due to increased likelihood of signal loss. Lower titers than those presented have not been tested. This protocol outlines injections of AAV-GLuc-SERCaMP into liver; similar approaches are in theory feasible for other tissue types. Parameters such as viral concentration and serotype must be optimized for sufficient expression in other tissues.
Due to the robust nature of the reporter, small volumes of blood (100-150 µl) can be collected from tail clippings, allowing for repeated collections throughout experiments. This was useful for longitudinal characterization of GLuc-SERCaMP release in response to thapsigargin, where we observed elevated levels after thapsigargin administration followed by a return to baseline levels (Figure 4). Proper handling of the plasma samples following blood collection is also important. As such, we have demonstrated that SERCaMP is stable in plasma stored at 4 °C up to 72 hr prior to enzymatic assay (Figure 5). Furthermore, plasma samples can undergo at least three freeze/thaw cycles with minimal effect on luminescence (Figure 5). In practice, we store all samples at -80 °C, avoid unnecessary freeze-thaw cycles prior to assessing enzymatic assay, and analyze all samples for an experiment at the same time.
ER calcium depletion is implicated in the pathogenesis of a variety of diseases. It is often thought to be an upstream event that hinders cellular functions and leads to the activation of the unfolded protein response (UPR). The UPR is an adaptive response employed by the ER to reestablish homeostatic conditions5. Chronic states of ER stress exceed the capacity of the UPR to restore homeostasis, ultimately leading to cell death. ER stress and ER calcium dysregulation are observed in diseases such as type 1 diabetes, diabetic nephropathy, neurodegenerative diseases and cardiovascular dieases5. The relationship between calcium dysregulation and disease pathogenesis, however, is difficult to delineate. The SERCaMP technology has the potential to track this process over the lifespan of an animal, thus providing insight into disease development and progression. Moreover, the evaluation of potential therapeutics designed to prevent or correct ER calcium dysregulation can be assessed through the use of SERCaMP. Lastly, identifying diseases where GLuc-SERCaMP release occurs offers the opportunity to engineer and employ secreted therapeutic proteins or peptides as SERCaMPs as a means of disease regulated gene therapy.
Disclosures
The authors have nothing to disclose.
Acknowledgments
This work was supported by the Intramural Research Program at the National Institute on Drug Abuse. We thank Doug Howard, Chris Richie, Lowella Fortuno, and Josh Hinkle for their contributions to developing this method.
References
- Sitia R, Braakman I. Quality control in the endoplasmic reticulum protein factory. Nature. 2003;426(6968):891–894. doi: 10.1038/nature02262. [DOI] [PubMed] [Google Scholar]
- Burdakov D, Petersen OH, Verkhratsky A. Intraluminal calcium as a primary regulator of endoplasmic reticulum function. Cell Calcium. 2005;38(3-4):303–310. doi: 10.1016/j.ceca.2005.06.010. [DOI] [PubMed] [Google Scholar]
- Fu S, et al. Aberrant lipid metabolism disrupts calcium homeostasis causing liver endoplasmic reticulum stress in obesity. Nature. 2011;473(7348):528–531. doi: 10.1038/nature09968. [DOI] [PMC free article] [PubMed] [Google Scholar]
- Micaroni M. The role of calcium in intracellular trafficking. Curr Mol Med. 2010;10(8):763–773. doi: 10.2174/156652410793384204. [DOI] [PubMed] [Google Scholar]
- Mekahli D, Bultynck G, Parys JB, De Smedt H, Missiaen L. Endoplasmic-reticulum calcium depletion and disease. Cold Spring Harb Perspect Biol. 2011;3(6) doi: 10.1101/cshperspect.a004317. [DOI] [PMC free article] [PubMed] [Google Scholar]
- Paredes RM, Etzler JC, Watts LT, Zheng W, Lechleiter JD. Chemical calcium indicators. Methods. 2008;46(3):143–151. doi: 10.1016/j.ymeth.2008.09.025. [DOI] [PMC free article] [PubMed] [Google Scholar]
- Whitaker M. Genetically encoded probes for measurement of intracellular calcium. Methods Cell Biol. 2010;99:153–182. doi: 10.1016/B978-0-12-374841-6.00006-2. [DOI] [PMC free article] [PubMed] [Google Scholar]
- Tang S, et al. Design and application of a class of sensors to monitor Ca2+ dynamics in high Ca2+ concentration cellular compartments. Proc Natl Acad Sci U S A. 2011;108(39):16265–16270. doi: 10.1073/pnas.1103015108. [DOI] [PMC free article] [PubMed] [Google Scholar]
- Palmer AE, Jin C, Reed JC, Tsien RY. Bcl-2-mediated alterations in endoplasmic reticulum Ca2+ analyzed with an improved genetically encoded fluorescent sensor. Proc Natl Acad Sci U S A. 2004;101(50):17404–17409. doi: 10.1073/pnas.0408030101. [DOI] [PMC free article] [PubMed] [Google Scholar]
- Suzuki J, et al. Imaging intraorganellar Ca2+ at subcellular resolution using CEPIA. Nat Commun. 2014;5:4153. doi: 10.1038/ncomms5153. [DOI] [PMC free article] [PubMed] [Google Scholar]
- Rehberg M, Lepier A, Solchenberger B, Osten P, Blum R. A new non-disruptive strategy to target calcium indicator dyes to the endoplasmic reticulum. Cell Calcium. 2008;44(4):386–399. doi: 10.1016/j.ceca.2008.02.002. [DOI] [PubMed] [Google Scholar]
- Henderson MJ, Wires ES, Trychta KA, Richie CT, Harvey BK. SERCaMP: a carboxy-terminal protein modification that enables monitoring of ER calcium homeostasis. Mol Biol Cell. 2014;25(18):2828–2839. doi: 10.1091/mbc.E14-06-1141. [DOI] [PMC free article] [PubMed] [Google Scholar]
- Henderson MJ, Richie CT, Airavaara M, Wang Y, Harvey BK. Mesencephalic astrocyte-derived neurotrophic factor (MANF) secretion and cell surface binding are modulated by KDEL receptors. J Biol Chem. 2013;288(6):4209–4225. doi: 10.1074/jbc.M112.400648. [DOI] [PMC free article] [PubMed] [Google Scholar]
- Shipman C. Evaluation of 4-(2-hydroxyethyl)-1-piperazineëthanesulfonic acid (HEPES) as a tissue culture buffer. Proc Soc Exp Biol Med. 1969;130(1):305–310. doi: 10.3181/00379727-130-33543. [DOI] [PubMed] [Google Scholar]
- Zigler JS, Lepe-Zuniga JL, Vistica B, Gery I. Analysis of the cytotoxic effects of light-exposed HEPES-containing culture medium. In Vitro Cell Dev Biol. 1985;21(5):282–287. doi: 10.1007/BF02620943. [DOI] [PubMed] [Google Scholar]
- Howard DB, Powers K, Wang Y, Harvey BK. Tropism and toxicity of adeno-associated viral vector serotypes 1, 2, 5, 6, 7, 8, and 9 in rat neurons and glia in vitro. Virology. 2008;372(1):24–34. doi: 10.1016/j.virol.2007.10.007. [DOI] [PMC free article] [PubMed] [Google Scholar]
- Smeets EF, Heemskerk JW, Comfurius P, Bevers EM, Zwaal RF. Thapsigargin amplifies the platelet procoagulant response caused by thrombin. Thromb Haemost. 1993;70(6):1024–1029. [PubMed] [Google Scholar]
- Tannous BA. Gaussia luciferase reporter assay for monitoring biological processes in culture and in vivo. Nat Protoc. 2009;4(4):582–591. doi: 10.1038/nprot.2009.28. [DOI] [PMC free article] [PubMed] [Google Scholar]
- Sobrevals L, et al. AAV vectors transduce hepatocytes in vivo as efficiently in cirrhotic as in healthy rat livers. Gene Ther. 2012;19(4):411–417. doi: 10.1038/gt.2011.119. [DOI] [PubMed] [Google Scholar]
- Wang Z, et al. Rapid and highly efficient transduction by double-stranded adeno-associated virus vectors in vitro and in vivo. Gene Ther. 2003;10(26):2105–2111. doi: 10.1038/sj.gt.3302133. [DOI] [PubMed] [Google Scholar]
- Seppen J, et al. Adeno-associated virus vector serotypes mediate sustained correction of bilirubin UDP glucuronosyltransferase deficiency in rats. Mol Ther. 2006;13(6):1085–1092. doi: 10.1016/j.ymthe.2006.01.014. [DOI] [PubMed] [Google Scholar]
- Hareendran S, et al. Adeno-associated virus (AAV) vectors in gene therapy: immune challenges and strategies to circumvent them. Rev Med Virol. 2013;23(6):399–413. doi: 10.1002/rmv.1762. [DOI] [PubMed] [Google Scholar]


