Abstract
The obligate intracellular bacterium Chlamydia elicits a great burden on global public health. C. trachomatis is the leading bacterial cause of sexually transmitted infection and also the primary cause of preventable blindness in the world. An essential determinant for successful infection of host cells by Chlamydia is the bacterium's ability to manipulate host cell signaling from within a novel, vacuolar compartment called the inclusion. From within the inclusion, Chlamydia acquire nutrients required for their 2-3 day developmental growth, and they additionally secrete a panel of effector proteins onto the cytosolic face of the vacuole membrane and into the host cytosol. Gaps in our understanding of Chlamydia biology, however, present significant challenges for visualizing and analyzing this intracellular compartment. Recently, a reverse-imaging strategy for visualizing the inclusion using GFP expressing host cells was described. This approach rationally exploits the intrinsic impermeability of the inclusion membrane to large molecules such as GFP. In this work, we describe how GFP- or mCherry-expressing host cells are generated for subsequent visualization of chlamydial inclusions. Furthermore, this method is shown to effectively substitute for costly antibody-based enumeration methods, can be used in tandem with other fluorescent labels, such as GFP-expressing Chlamydia, and can be exploited to derive key quantitative data about inclusion membrane growth from a range of Chlamydia species and strains.
Keywords: Infection, Issue 104, Chlamydia, inclusion, vacuole, GFP, mCherry, fluorescence, live-cell imaging, microbiology
Introduction
Infectious diseases caused by species of the intracellular bacterium Chlamydia elicit a major burden on global health, including sexually transmitted disease, pelvic inflammatory disease, blindness, pneumonia and possibly atherosclerosis1-4. The ability of Chlamydia to interact with the host cell, from within a vacuole (termed the inclusion), is a critical determinant for their successful infection of cells and the host. The inclusion is a novel pathogenic compartment that enables chlamydial growth and is dynamically modified throughout the entire 2–3 day developmental cycle of Chlamydia5. The obligate intracellular nature of chlamydiae presents numerous challenges to the research community, in particular for directly studying the unique biology of the inclusion. A major handicap has been the inability to efficiently visualize either intracellular Chlamydia or their inclusion by fluorescent approaches in living cells. A recent discovery has finally revealed the means to generate GFP expressing C. trachomatis6; however, this finding has not yet led to specific labeling of the inclusion. Some techniques have been described for labeling of bacteria and inclusions7,8, but they suffer from shortcomings such as non-specificity, transiency and susceptibility to photobleaching. A key discovery by our group established a new strategy for illuminating the inclusion using GFP expressing host cells9. This strategy rationally exploits the intrinsic impermeability of the inclusion membrane to molecules greater than 520 Da10. When cells are engineered to stably express a particular cytosolic fluorescent protein (e.g., GFP or mCherry), Chlamydia inclusions are visible with remarkable clarity by their complete exclusion of fluorescence. This reverse imaging strategy enables immediate visualization of inclusions for all Chlamydia species and it can be easily adapted for most host cells of interest. As a demonstration of its utility, this method was used previously to reveal and define the cellular exit pathways for Chlamydia spp9.
Here, we further demonstrate how this method is performed, and can be exploited to derive key quantitative data about inclusion growth dynamics. Furthermore, it can effectively substitute for costly antibody-based enumeration methods and can be used in tandem with other fluorescent labels, such as mKate2-expressing Chlamydia11. This powerful combination of tools enables exploration of the physical properties of the chlamydial inclusion membrane inside living host cells.
Protocol
1. Generation of Fluorescent Host Cell Lines
Day 1. Plate 293T cells (or other retroviral packaging line) on 6-well plates at 2 x 10⁶ cells/well, to be ~75% confluent the next day. If desired, plate duplicate wells for each retrovirus to be used.
Day 2. Aspirate cells and add 2 ml fresh growth medium (DMEM + 10% FBS + 2 mM L-glutamine). Transfect cells with 5–8 µg each of retroviral vector (containing GFP) and packaging vector (e.g., pVSVg) using Lipofectamine 2000 or similar reagent and following the manufacturer’s instructions.
Incubate cells with DNA for 4–6 hr in a 37 °C CO2 incubator, and subsequently replace medium with 1 ml growth medium.
Incubate cells for 48 hr in 37 °C CO2 incubator.
Day 3. Plate target cells (e.g., HeLa) on 6-well plates at an approximate density of 105 cells/well, to be ~50% confluent the next day. Verify positive transfection in 293T cells by monitoring GFP fluorescence on an inverted microscope.
Day 4. Collect retrovirus-containing supernatants off 293T cells using a pipette and filter the supernatant through a 0.45 µm cellulose acetate syringe filter.
Remove medium from HeLa cells and add 0.5 ml growth medium containing 16 µg/ml polybrene. Add ~0.5 ml of filtered retrovirus to cells drop-wise and incubate cells in a 37 °C CO2 incubator for 24 hr. Store any remaining retrovirus (i.e., from the duplicate well) at 4 °C.
Day 5. If duplicate wells were made to generate extra retrovirus, repeat step 1.7 to serially infect with the remaining retroviral particles.
Day 6. Passage transfected HeLa cells 1:1 into a 10 cm dish containing selection antibiotic (e.g., 500 µg/ml neomycin).
Wait sufficient time for transduced cells to grow back in presence of selection antibiotic, after which cells can be propagated by standard techniques with a lower concentration of selection antibiotic (e.g., 200 µg/ml neomycin). Note: Cells may also be clonally selected for ideal brightness at this time, if necessary.
2. Generation of GFP-expressing Chlamydia trachomatis
Prepare 2x CaCl2 buffer (20 mM Tris pH 7.4, 100 mM CaCl2) and 4SP buffer (0.4 M sucrose, 16 mM Na2HPO4).
Day 1. Thaw frozen C. trachomatis stock on ice and immediately dilute 10 µl bacteria into 50 µl 2x CaCl2 buffer. Add 3 µg plasmid DNA (e.g., pASK-GFP-mKate2-L2), mix well and incubate for 30 min at 25 °C.
During this step, prepare host cells by trypsinizing a T-75 flask of McCoy cells into a centrifuge tube. Centrifuge the cell suspension at 50 x g for 5 min and discard the supernatant. Resuspend cell pellet in appropriate volume of 1x CaCl2 buffer to give a final concentration of 4 x 10⁷ cells/ml.
After the 30 min incubation (from step 2.2), add 100 µl prepared McCoy cells to transformation mixture tube (total volume 200 µl) and incubate an additional 20 min at 25 °C. Add 100 µl of this transformed cell mixture to a single well from a 6-well plate and overlay with 2 ml growth medium. Incubate at 37 °C in a CO2 incubator for 2 days.
Day 3. Lyse McCoy cells infected with C. trachomatis by replacing medium with 1 ml dH2O and scraping cells with a bent 1,000 µl pipet tip. Add 1 ml 4SP buffer and pass suspension through a 27.5 G needle ~5 times for efficient cell lysis and release of C. trachomatis.
Transfer 2 ml of the cell lysate containing C. trachomatis to a T-75 flask containing a confluent monolayer of freshly plated McCoy cells; add 8 ml DMEM (without FBS) and incubate for 2 hr at 25 °C to allow C. trachomatis to adhere to cells.
Aspirate cells and add fresh growth medium supplemented with 10 U/ml penicillin G and 1 µg/ml cycloheximide. Incubate flask for 48 h in a 37 °C CO2 incubator.
Day 4. Verify by light microscopy that cells are infected and inclusions contain aberrant Chlamydia. Identify inclusions as bright vacuoles on a standard light microscope, and aberrant Chlamydia bodies as ring-like objects within inclusions that are greater than 2 µm diameter.
Day 5. Lyse culture by replacing medium with 2 ml dH2O and scrape cells into a suspension. Add 2 ml 4SP buffer and pass suspension through a 27.5 G needle ~5 times.
Use 2 ml of cell lysate to infect a fresh monolayer of McCoy cells in a single well in a 6-well plate. Incubate cells with lysate for 2 hr at 25 °C, aspirate and add fresh growth medium containing penicillin G and cycloheximide.
Incubate cells in a 37 °C CO2 incubator for 3–5 days, depending on general health of cells.
Repeat steps 2.9–2.10 one or more times, as necessary, passaging cultures into fresh wells in a 6-well plate until normal looking inclusions (devoid of aberrant bodies) have emerged. At this time use an inverted fluorescence microscope to check that C. trachomatis express mKate2 (red).
Scale up infected cultures for generation of high titer chlamydial stocks, for example by harvesting Chlamydia transformants from infected McCoy or HeLa cells grown in T-150 flasks.
3. Infecting Cells with Chlamydia
Plate GFP-HeLa cells on desired culture vessel, for example glass bottom dishes or chamber slides for high resolution imaging, or 24-well plates for IFU determination and multiwell screening.
Thaw frozen tube containing C. trachomatis, C. muridarum, or C. pneumoniae on ice and dilute in HBSS to desired multiplicity of infection (MOI), for example MOI = 1.
- Perform either static or centrifugation-aided infections based on the particular Chlamydia strain that will be used.
- For infections with C. trachomatis LGV serovar L2 or C. muridarum, wash GFP-HeLa cells with HBSS and incubate with diluted bacteria for 2 hr at 25 °C. Aspirate and wash cells with HBSS, and incubate cells in growth medium in 37 °C CO2 incubator.
- For infections with C. trachomatis serovar D or C. pneumoniae, wash GFP-HeLa cells with HBSS and add diluted bacteria to cells. Place multiwell plate or glass bottom dish (secured by tape in a multiwell plate lid) in a multiwell plate holder of a swinging bucket rotor attachment in a benchtop centrifuge.
- Centrifuge cells at 900 x g at 25 °C for 1 hr.
- Remove culture vessels from centrifuge and place in a 37 °C CO2 incubator for 1 hr.
- Aspirate cells in a biosafety cabinet, wash cells twice with HBSS, and add fresh growth medium. Place cells in a 37 °C CO2 incubator.
4. Live Cell Visualization of Chlamydia Inclusions
Remove Chlamydia infected GFP-HeLa cells from CO2 incubator and replace medium with RPMI without phenol red + 5% FBS.
Mount cells on an inverted fluorescence microscope (Nikon Eclipse Ti-E or similar) using a 20X or higher oil objective.
Using imaging software (Volocity 6 or similar), focus on and identify Chlamydia infected GFP-HeLa cells: green cells containing large black holes (Chlamydia inclusions).
Mark the xyz locations of regions containing Chlamydia-infected cells of interest using imaging software (Volocity 6 or similar). Perform this by manually ‘Adding Points’ while in the XY Stage view mode. In this manner, xyz coordinates are saved for each marked location.
In the Acquisition Setup dialog box, configure software to acquire green (GFP, HeLa cytosol) and red (mKate2, C. trachomatis) channels, and at a rate of new frames per channel every 5 min.
Acquire the image sequence using the acquisition protocol entered above by clicking the “Capture/Record” button.
5. Quantitation of Inclusion Growth Parameters in Live Cells
At desired times post-infection (e.g., 24, 48 hpi) remove Chlamydia infected GFP-HeLa cells from incubator and mount on an inverted fluorescence microscope. Note: A 20X or 40X air objective with a high NA is best-suited for 24-well plates, and a 40X oil objective is recommended for chamber slides. Grow cells on either substrate for this assay.
Focus on midplanes of cells, where inclusions are at their maximum diameter and yield crisp edges.
Acquire images for many fields in each well (at least 10 per well); wells typically represent replicates or experimental variables.
- Enumerate the number of inclusions manually, by eye (inclusions are black compartments in GFP-HeLa cells) or use imaging software algorithms to automatically identify and count inclusions.
- Find GFP-HeLa cells by fluorescence intensity (‘Find Objects’ command) and adjust fluorescence threshold intensity based on relative intensities of cells.
- Filter selected objects using size guidelines of keeping those only greater than 5 µm2. This is ‘population 1’.
- Apply ‘Fill Holes in Objects’ command using ‘population 1’ as the input. This step generates ‘population 2’.
- Subtract ‘population 1’ from ‘population 2’ to yield positively marked Chlamydia inclusions, designated as ‘population 3’.
- Apply size filter to ‘population 3’ (‘Filter Population’ command), for example keeping objects greater than 25 µm2 for inclusions in cells infected for 24 hr or longer. For early infection times, such as prior to 18 hr, set size filter to keep objects greater than 4 µm2, as these inclusions are much smaller. Size filtering results in a population of objects designated as ‘inclusions’.
- Calculate quantitative data from images, for example, inclusion number, inclusion size, and inclusion circumference, using imaging software.
Representative Results
Mammalian cells expressing cytosolic fluorescent proteins (e.g., GFP) can be engineered to enable illumination of Chlamydia inclusions in live, infected cell cultures. Upon infection with Chlamydia, inclusions are readily visible as black spots in the host cells (Figure 1). The clarity of fluorescence-lacking inclusions can be exploited for the automated identification of inclusions across numerous fields of view and/or treatments (Figure 1). Once fluorescent host cells have been generated, a powerful new workflow is enabled for rapid, quantitative analysis of chlamydial infection levels in experimental samples. One major application is determination of Chlamydia inclusion forming units (IFU) in live, infected cells (Figure 2). This experimental strategy obviates the need for immunofluorescence procedures that are routinely used in the field, which are both time-consuming and costly.
Another key feature of the described imaging approach is that it can be readily applied to any Chlamydia species or strain, and, furthermore, can be exploited for derivation of important biological characteristics of chlamydial inclusions. As an example, a time course analysis of GFP-HeLa cells infected with C. trachomatis LGV serovar L2, C. trachomatis serovar D, C. muridarum, and C. pneumoniae was performed at 16, 24, and 48 hpi (Figure 3). For each of these Chlamydia species and strains, inclusions were marked and analyzed to calculate their average area, perimeter length, and number per cell at times indicated (Figure 4). These attributes provide important information about the biology of chlamydial inclusions and inform how they interact with the host cell. The described method provides a facile approach for accessing this information in a manner that surpasses what can be accomplished by other experimental techniques. A final utility of the reverse labeling strategy is for real-time imaging of Chlamydia inclusions in living cells. An example of this is shown in Movie 1.
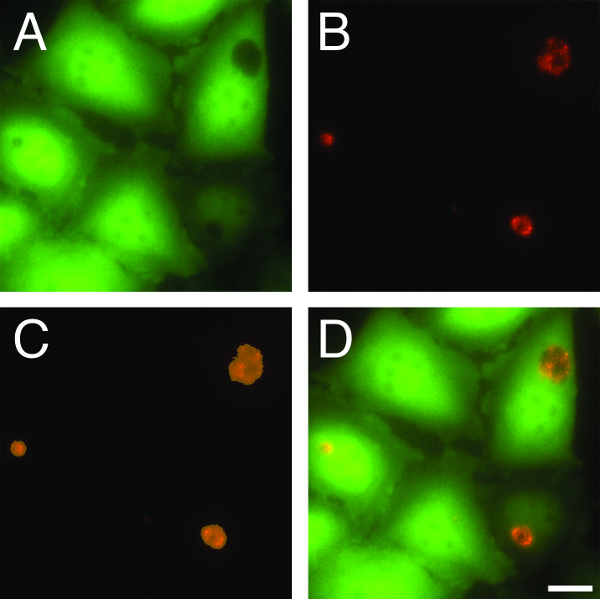 Figure 1. Automated detection of C. trachomatis inclusions. (A) GFP–HeLa cells were infected with (B) mKate2-expressing C. trachomatis L2 and imaged live at 24 hpi. An imaging software based algorithm was used to automatically identify chlamydial inclusions by (C) selecting black holes in GFP-HeLa cells, marked in orange. (D) A composite image of infected cells from panels A and B is also shown. Scale bar = 20 µm. Please click here to view a larger version of this figure.
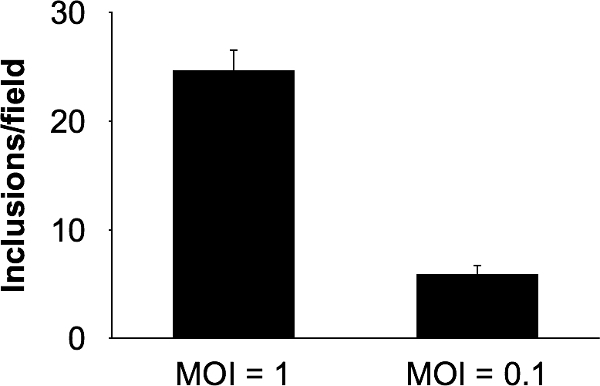 Figure 2. Quantitation of Chlamydia inclusion forming units (IFU) in GFP-HeLa cells. GFP-HeLa cells were infected with C. trachomatis L2 at two different multiplicities of infection and imaged at 24 hpi. Inclusions for 10 fields per infection were detected and enumerated using automated software and results are given (n = 3). Error bars represent the standard error of the mean. Please click here to view a larger version of this figure.
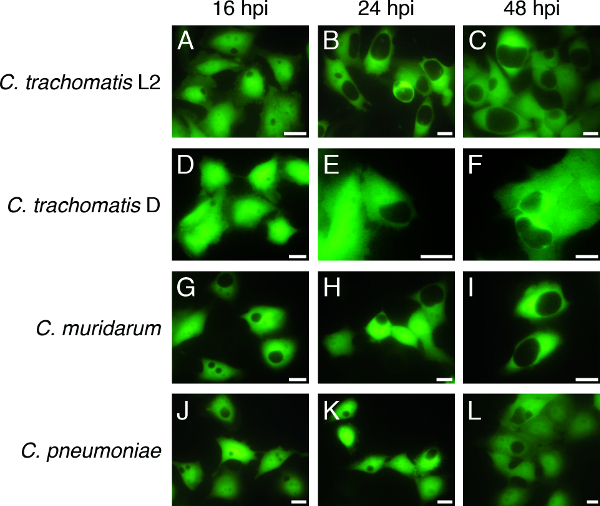 Figure 3. Time course of C. trachomatis serovar L2, C. trachomatis serovar D, C. muridarum, and C. pneumoniae infection in GFP-HeLa cells. GFP–HeLa cells were infected with C. trachomatis LGV serovar L2 and imaged by live fluorescence microscopy at (A) 16 hpi, (B) 24 hpi, and (C) 48 hpi. GFP–HeLa cells infected with C. trachomatis serovar D were imaged at (D) 16 hpi, (E) 24 hpi, and (F) 48 hpi. GFP–HeLa cells infected with C. muridarum were imaged at (G) 16 hpi, (H) 24 hpi, and (I) 48 hpi. GFP–HeLa cells infected with C. pneumoniae were imaged at (J) 16 hpi, (K) 24 hpi, and (L) 48 hpi. Representative images are shown for all infections and times. Scale bars = 20 µm. Please click here to view a larger version of this figure.
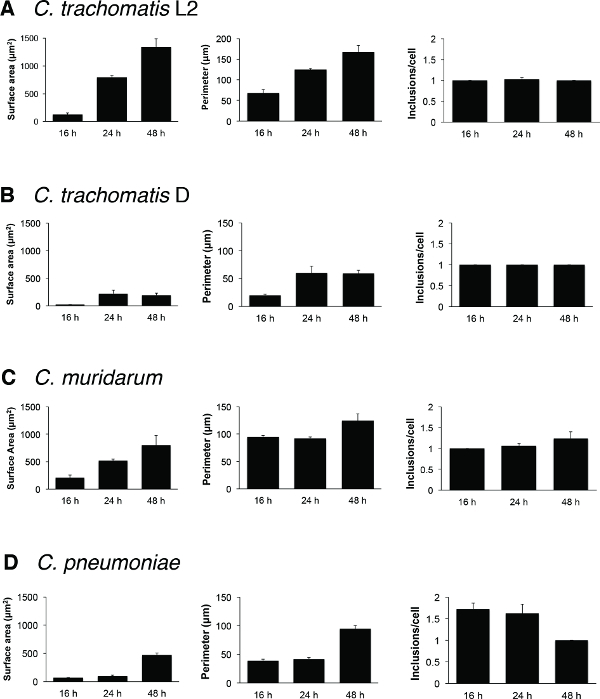 Figure 4. Representative quantitative data derived from time course experiments. Inclusions from GFP-HeLa cells infected with (A) C. trachomatis LGV serovar L2, (B) C. trachomatis serovar D, (C) C. muridarum, and (D) C. pneumoniae were detected and enumerated at 16, 24, and 48 hpi (5 fields per time interval, n = 3). Physical characteristics of chlamydial inclusions were quantified for inclusion surface area, inclusion perimeter length, and number of inclusions per cell. Error bars represent the SEM. Please click here to view a larger version of this figure.
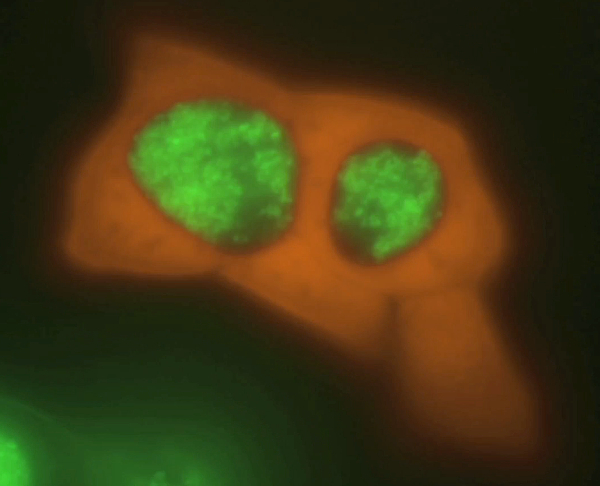 Please click here to view this video. Movie 1. Time lapse video of mCherry-HeLa cells infected with GFP C. trachomatis L2, taken at 48 hpi. Video was compiled from a series of time-lapse images taken at 5 min intervals for 125 min. Looped video alternates across mCherry-HeLa cells (red), C. trachomatis L2 (green) and a merge of both fields.
Discussion
Here we describe the experimental strategy for generating fluorescent host cells for real time visualization and analysis of Chlamydia inclusions. This vacuole visualization approach confers the powerful ability to illuminate, track and quantitatively measure the dynamic properties of chlamydial inclusions across populations of cells or in single cells over time. Chlamydia inclusions in fluorescent protein labeled cells are strikingly well defined, such that they are easily identified without the need for additional immunofluorescent processing. Furthermore, this approach is sensitive enough to resolve signature morphological differences that different Chlamydia species and strains possess, such as numbers of vacuoles per cell and inclusion curvature. In addition, we demonstrate how imaging software can be adapted to automatically identify inclusions in GFP expressing host cells. The obviation of immunofluorescent labeling steps for illumination of chlamydial inclusions results in significant time and cost savings to the user for endpoint assays such as the determination of inclusion forming units (IFU). Furthermore, the ability to image inclusions in live cells allows for the same population of infected cells to be analyzed at precise times over the chlamydial developmental cycle, thereby reducing the number of wells or plates necessary for time course studies. Cytosolic GFP, mCherry, etc., yield a bright, stable signal that does not suffer from photobleaching; this feature is critical for lengthy time-lapse imaging experiments. Finally, because the technique is independent of Chlamydia developmental gene expression, it is equally effective at all stages of cellular infection by Chlamydia.
Compared to existing strategies for labeling intracellular Chlamydia and membranes7,8, this technique offers simplicity and flexibility for experimental applications. Fluorescent host cells infected with Chlamydia can be imaged immediately, without any need for dye loading, labeling or other cellular manipulations. This approach clearly illuminates and defines the edges of the inclusion while keeping the luminal space of the inclusion (and the bacteria) unlabeled. For the purpose of illuminating and enumerating Chlamydia infected cells, the advantage of this approach primarily lies in its compatibility with live cultures, and therefore the significant time savings it provides. However, for labeling and derivation of quantitative parameters of the Chlamydia containing vacuole itself, commercial antibodies for this compartment are not widely available. Consequently, the inverted GFP approach remains the most facile and direct means for demarcating the membrane of this pathogen compartment.
There are key considerations for applying this imaging method to a Chlamydia visualization workflow. It is important that host cell lines with stable expression of GFP, mCherry, etc, are generated in advance. Although chlamydial inclusions are easily detected in host cells that are transiently transfected with fluorescent proteins, cells prepared in this manner suffer from incomplete transfection across the population as well as variable expression levels. In addition, transfection adds unnecessary steps to the overall procedure. Another limitation of the described method is that inclusions derived from different Chlamydia spp. can be strikingly different in their morphological appearance and the manner in which they interact with the host cell. This imaging approach is quite robust for detecting and imaging inclusions containing C. trachomatis, C. muridarum or C. pneumoniae; however, for a few Chlamydia species (most notably C. psittaci and C. caviae) inclusions are less capable of excluding GFP from their luminal space. Inclusions containing C. psittaci or C. caviae are readily visible in GFP-HeLa cells, but the intrusion of some GFP into these inclusions increases the error rate of software based detection of inclusions.
Once the overall experimental strategy has been properly implemented, new opportunities are created for quantitative analysis of Chlamydia inclusions in living cells. We demonstrate how this technique allows for a streamlined workflow for inclusion enumeration - either in an automated manner using imaging software, or by manual scoring. A novel application of this approach is for derivation of meaningful quantitative data about the inclusion, for example inclusion area, volume and shape. Finally, this visualization method is highly adaptable and can be used in combination with other fluorescent markers to reveal additional insight into the biology of Chlamydia infected host cells, for example GFP- or mKate2-expressing Chlamydia6,11, fluorescent actin12or GFP tagged Inc proteins13.
Disclosures
The authors declare that they have no competing financial interests.
Acknowledgments
The authors thank Ian Clarke and P. Scott Hefty for the pGFP-SW2 and pASK-GFP-mKate2-L2 plasmids, respectively. We thank Paul Miller for technical assistance and Richard Stephens for other resources. This work was funded by NIH grant AI095603 (KH).
References
- Stamm WE. Chlamydia trachomatis infections: progress and problems. The Journal of Infectious Diseases. 1999;179(Suppl 2):S380–S383. doi: 10.1086/513844. [DOI] [PubMed] [Google Scholar]
- Schachter J. Infection and disease epidemiology. In: Stephens RS, editor. Chlamydia: Intracellular Biology, Pathogenesis, and Immunity. ASM Press; 1999. pp. 139–169. [Google Scholar]
- Campbell LA, Kuo CC. Chlamydia pneumoniae--an infectious risk factor for atherosclerosis. Nature Reviews Microbiology. 2004;2(1):23–32. doi: 10.1038/nrmicro796. [DOI] [PubMed] [Google Scholar]
- Darville T, Hiltke TJ. Pathogenesis of genital tract disease due to Chlamydia trachomatis. The Journal of Infectious Diseases. 2010;201(Suppl 2):S114–S125. doi: 10.1086/652397. [DOI] [PMC free article] [PubMed] [Google Scholar]
- Hackstadt T. Cell biology. In: Stephens RS, editor. Chlamydia: Intracellular Biology, Pathogenesis, and Immunity. ASM Press; 1999. pp. 101–138. [Google Scholar]
- Wang Y, Kahane S, Cutcliffe LT, Skilton RJ, Lambden PR, Clarke IN. Development of a transformation system for Chlamydia trachomatis: restoration of glycogen biosynthesis by acquisition of a plasmid shuttle vector) PLoS Pathogens. 2011;7(9):e1002258. doi: 10.1371/journal.ppat.1002258. [DOI] [PMC free article] [PubMed] [Google Scholar]
- Hackstadt T, Scidmore MA, Rockey DD. Lipid metabolism in Chlamydia trachomatis-infected cells: directed trafficking of Golgi-derived sphingolipids to the chlamydial inclusion. Proceedings of the National Academy of Sciences of the United States of America. 1995;92(11):4877–4881. doi: 10.1073/pnas.92.11.4877. [DOI] [PMC free article] [PubMed] [Google Scholar]
- Boleti H, Ojcius DM, Dautry-Varsat A. Fluorescent labelling of intracellular bacteria in living host cells. Journal of Microbiological Methods. 2000;40(3):265–274. doi: 10.1016/s0167-7012(00)00132-9. [DOI] [PubMed] [Google Scholar]
- Hybiske K, Stephens RS. Mechanisms of host cell exit by the intracellular bacterium Chlamydia. Proceedings of the National Academy of Sciences of the United States of America. 2007;104(27):11430–11435. doi: 10.1073/pnas.0703218104. [DOI] [PMC free article] [PubMed] [Google Scholar]
- Heinzen RA, Hackstadt T. The Chlamydia trachomatis parasitophorous vacuolar membrane is not passively permeable to low-molecular-weight compounds. Infection and Immunity. 1997;65(3):1088–1094. doi: 10.1128/iai.65.3.1088-1094.1997. [DOI] [PMC free article] [PubMed] [Google Scholar]
- Wickstrum J, Sammons LR, Restivo KN, Hefty PS. Conditional gene expression in Chlamydia trachomatis using the tet system. PLoS One. 2013;8(10):10–1371. doi: 10.1371/journal.pone.0076743. [DOI] [PMC free article] [PubMed] [Google Scholar]
- Chin E, Kirker K, Zuck M, James G, Hybiske K. Actin recruitment to the Chlamydia inclusion is spatiotemporally regulated by a mechanism that requires host and bacterial factors. PLoS One. 2012;7(10):e46949. doi: 10.1371/journal.pone.0046949. [DOI] [PMC free article] [PubMed] [Google Scholar]
- Agaisse H, Derré I. A C. trachomatis cloning vector and the generation of C. trachomatis strains expressing fluorescent proteins under the control of a C. trachomatis promoter. PLoS One. 2013;8(2):e57090. doi: 10.1371/journal.pone.0057090. [DOI] [PMC free article] [PubMed] [Google Scholar]


