Abstract
Terrestrial plants produce extracellular aliphatic biopolyesters that modify cell walls of specific tissues. Epidermal cells synthesize cutin, a polyester of glycerol and modified fatty acids that constitutes the framework of the cuticle that covers aerial plant surfaces. Suberin is a related lipid polyester that is deposited on the cell walls of certain tissues, including the root endodermis and the periderm of tubers, tree bark and roots. These lipid polymers are highly variable in composition among plant species, and often differ among tissues within a single species. Here, we describe a detailed protocol to study the monomer composition of cutin in Arabidopsis thaliana leaves by sodium methoxide (NaOMe)-catalyzed depolymerisation, derivatization, and subsequent gas chromatography-mass spectrometry (GC/MS) analysis. This method can be used to investigate the monomers of insoluble polyesters isolated from whole delipidated plant tissues bearing either cutin or suberin. The method can by applied not only to characterize the composition of lipid polymers in species not previously analyzed, but also as an analytical tool in forward and reverse genetic approaches to assess candidate gene function.
Keywords: Plant Biology, Issue 105, Arabidopsis thaliana, lipid polyesters, cuticle, cutin, aliphatic monomers, mutants, suberin, gas chromatography/mass spectrometry
Introduction
Vascular plants rely on extracellular layers that function as waterproof barriers between plant tissues and the external environment. These lipophilic cell wall-associated structures restrict pathogenic infection and regulate the passive transport of gases, water, and dissolved substances in and out of plant tissues1. Such barriers are the plant cuticle, a synapomorphic structure unique to plants2, and different suberin-containing diffusion barriers. The cuticle is an oleophilic layer synthesized by epidermal cells and bound to them via a pectinaceous layer on the extracellular side of the cell wall3-5. It encases the primary aerial organs of higher plants, functioning as a vital interface between plant tissues and the environment.
Cutin, the structural matrix of the cuticle, and suberin are two insoluble glycerolipid polyesters associated with solvent-extractable waxes2,4. These polymeric lipids are composed of saturated and unsaturated fatty acid derivatives and are both structurally and functionally similar. However, they are distinguishable by characteristic differences in chemical composition and deposition sites.
Suberin is an aliphatic polyester located inside the cell walls of certain external and internal tissues forming a secondary wall. Suberized tissues include periderms of roots, tubers and tree bark, root endodermis, seed coat layers, and healed wounds2. Unlike cutin, the suberin polyester typically contains alcohols, saturated and mono-unsaturated dicarboxylic acids, and a large proportion of very-long-chain monomers (C≥20).
Cutin is the most abundant lipid polyester in vascular plants6, and is composed of glycerol and C16-C18 interesterified fatty acid derivatives, such as hydroxy and hydroxy-epoxy substituted fatty acids4. While the composition of cutin polymers varies across tracheophyte species, the most predominant primary monomers are 10, 16-dihydroxy 16:0, 18-hydroxy-9,10-epoxy 18:0, and 9,10,18-trihydroxy 18:0 fatty acids. Interestingly, Arabidopsis leaf and stem cutin is mainly composed of 18:2 dicarboxylic acid 7,8.
Plant cuticles also present a considerable variability in thickness, ranging from a few nanometers to several micrometers9. Since cuticle isolation is a laborious and time-consuming step, particularly for very thin leaf cuticles such as those of Arabidopsis thaliana8, methods that bypass cuticle isolation have been developed and validated7,8. Here, we describe a detailed protocol to study the monomer composition of cutin in Arabidopsis thaliana leaves by sodium methoxide (NaOMe)-catalyzed depolymerization and subsequent gas chromatography/mass spectrometry (GC/MS) analysis. This protocol offers a robust method for assaying the composition of plant lipid polyesters in whole delipidated tissues, and has been adapted from previously reported protocols7,10,11. Whole tissue samples are first homogenized and exhaustively delipidated, removing solvent-extractable lipids including cuticular and epicuticular waxes, membrane lipids, and triacylglycerols. Cell wall-enriched residues are then depolymerized into their constituent methyl ester monomers by sodium methoxide-catalyzed methanolysis. Fatty acid methyl esters are extracted upon acidification, and derivatized to obtain their corresponding trimethylsilyl or acetyl derivatives. Derivatized residues are highly volatile, and can be eluted from a gas chromatography column at a reasonable temperature without altering their structural conformation during GC/MS analysis.
Protocol
Note: This protocol was adapted from Bonaventure et al. (2004), Molina et al. (2006), Li et al. (2013)7,10,11. Steps 1-5 are summarized in Figure 1.
1. Tissue Delipidation
Note: Always rinse all glassware and caps with chloroform, letting dry under fume hood, before using.
CAUTION: Perform tissue homogenization and all solvent transfer steps under fume hood; always wear lab coat, gloves and splash safety goggles to avoid direct contact with chemicals and to protect the samples from contamination.
Preheat water bath and heat block to 85 °C.
Weigh approximately 0.5 g of each leaf sample into pre-weighed 20 mm x 125 mm glass test tubes with polytetrafluoroethylene (PTFE)-faced screw caps. Include four replicates per sample.
Place 2-propanol in an Erlenmeyer flask (approximately 125 ml; 25 ml per g of sample). Add 2,6-di-tert-butyl-4-methylphenol (also known as butylated hydroxytoluene, BHT) to a final concentration of 0.01% (w/v). Note: Add BHT from a 5% (w/v) stock solution in methanol (BHT helps minimize oxidation of unsaturated fatty acids).
Preheat 2-propanol solution to 85 °C in water bath.
Add 12 ml hot 2-propanol solvent to each sample tube and heat for 15 min at 85 °C in heat block. This step inactivates lipases that may be released from disrupted cells.
Let tubes cool down to room temperature and grind tissue thoroughly with homogenizer until a homogeneous suspension is obtained.
Place the samples in an orbital shaker and shake for 1-2 hours at 100 rpm and room temperature.
Centrifuge for 10 min at 800 x g and discard supernatant.
Add an equal volume of 2-propanol and shake for 12 hours at room temperature.
Centrifuge for 10 min at 800 x g and discard supernatant.
Add 12 ml CHCl3:CH3OH (2:1, v/v) to residue (25 ml per g of sample) and shake overnight at 100 rpm and room temperature.
Centrifuge for 10 min at 800 x g and discard supernatant.
Add 12 ml CHCl3:CH3OH (1:2, v/v) to residue and shake overnight at 100 rpm and room temperature.
Centrifuge for 10 min at 800 x g and remove solvent.
Let samples dry under fume hood overnight at room temperature.
Air-dry the residue and then place in a vacuum desiccator over anhydrous CaCl2 or CaSO4 until constant weight is reached (3-5 days).
2. Depolymerization: Methanolysis with Sodium Methoxide (Figure 2)
CAUTION: Perform steps 2.3 – 2.4, 2.7 – 2.8, 2.10 – 2.11, 2.13 – 2.15 and 2.17 – 2.18 under fume hood; always wear lab coat, gloves and splash safety goggles.
Preheat heat block to 60 °C.
Weigh test tubes containing the dry residue (important for further calculations).
Add internal standards to each tube: 25 ωL methyl heptadecanoate (1 mg/ml stock) and 25 µl ω-pentadecalactone (1 mg/ml stock).
Add 0.9 ml methyl acetate, 1.5 ml sodium methoxide, and 3.6 ml methanol to each tube and cap them. Alternatively, prepare a reaction mix with these three reagents and add 6-ml aliquots to each sample.
Heat samples for 2 hours at 60 °C and vortex periodically in 15 min intervals.
Let samples cool down to room temperature.
Add 10 ml of methylene dichloride (CH2Cl2) and 1.5 ml of glacial acetic acid to extract the fatty acid methyl esters.
Add saline solution (0.5 M NaCl) to fill each tube and cap.
Vortex samples for 1 min and centrifuge for 10 min at 800 x g.
Transfer the organic phase (lower) to clean medium size tubes (16 x 125 mm glass test tubes with polytetrafluoroethylene (PTFE)-faced screw cap).
Add saline solution (0.5 M NaCl) to fill each tube and cap.
Vortex samples for 1 min and centrifuge for 10 min at 800 x g.
Remove aqueous (upper) phase and repeat steps 2.11-2.12.
Remove all aqueous (upper) phase.
Add anhydrous sodium sulfate (Na2SO4) to the solvent, cap the tubes, and vortex for 1 min; samples may now be left until the following day. At this point samples can be left overnight under the fume hood.
Centrifuge for 2 min at 800 x g to compact the Na2SO4 salt in the bottom.
Transfer the organic phase to a small glass disposable tube (13 x 100 mm glass test tubes with polytetrafluoroethylene (PTFE)-faced screw cap).
Evaporate the solvent to dryness under nitrogen and proceed to the derivatization step. If not processed immediately, store evaporated samples at -20 °C (samples can be also stored before the evaporation step).
3. Preparation of Derivatives for Gas Chromatography
CAUTION: Perform steps 3.1.2 and 3.1.5 – 3.1.8 under a fume hood; always wear lab coat, gloves and splash safety goggles.
- Trimethylsilyl derivatives
- Preheat heat block to 100 °C.
- Add 100 µl of pyridine and 100 µl of BSTFA (N,O Bis-trimethylsilyl-trifluoroacetamide) to each tube and cap them.
- Heat samples at 100 °C for 10 min.
- Let samples cool down to room temperature.
- Evaporate samples under nitrogen at room temperature. Avoid applying heat to samples, monomers are highly volatile at this stage.
- Add 500 µl of 1:1 (v/v) heptane:toluene.
- Vortex samples for 1 min and centrifuge for 2 min at 800 x g.
- Add samples to GC vials and proceed to GC/MS analysis.
- Acetyl derivatives Note: For acetylation, modify steps 3.1.1-3.1.3 above as follows (not shown in video); steps 3.1.4-3.1.8 are the same:
- Preheat heat block to 60 °C.
- Add 100 µl of pyridine and 100 µl of acetic anhydride (Ac2O) to the tubes.
- Heat samples 1 hour at 60 °C.
4. GC/MS Analysis
Use a HP-5 capillary column (30 m x 0.25 mm x 0.25 µm film thickness) or equivalent (i.e., 5% diphenyl, 95% dimethyl polysiloxane). Program the GC with helium carrier gas flow set at 1.5 ml/min and oven temperature programmed from 150 to 300 °C at 3 °C/min.
Use split injection (split ratio 1:10) and set mass spectrometer to scan mode over 40-600 amu (electron impact ionization).
Create a sequence table including solvent (blank), WT and mutant replicates, each using the indicated cutin analysis method.
Load solvent and sample vials on the carrousel, add hexane to syringe-rinsing vials in the autosampler if necessary, and start the sequence. After the sequence is completed, total ion chromatogram traces are available for all samples.
5. Data Analysis
Identify lipid polyester monomers by comparing each peak’s mass spectrum to published mass spectra or by searching a commercial library if available.
For each identified peak in the total ion current chromatogram, use their respective retention times to find the areas on the integration results table from the GC/MS software (Supplemental Figure 1).
For each monomer (columns A-B), add the area values found in the integration table (Supplemental Figure 1, column D) to the corresponding column for every replicate sample in the Excel table of monomers (Supplemental File 2, columns C-F), which is a spreadsheet to quantify Arabidopsis cutin TMSi derivatives. Use Supplemental File 3 if acetylated derivatives are prepared instead.
Add the areas of the internal standards (IS) to the IS columns (H-K). For those monomers that are not derivatized, namely fatty acid methyl esters (FAMEs), and dicarboxylic acid dimethyl esters (DCA DMEs), use 17:0 FAME (IS1) as IS for quantification (purple-shaded cells in the monomer table; Supplemental Files 2/3). For hydroxylated monomers, including primary alcohols, ferulic acid and ω-hydroxy acids, use 15:0 15-hydroxy FAME (IS2) as IS of choice for compound quantification (green-shadded cells in the monomer table; Supplemental Files 2/3).
Add dry leaf weight for each replicate to columns AX-BA (Supplemental File 2) or AQ-AT (Supplemental File 3); alternatively, scan leaves to calculate surface areas and add area values to the monomer table to express monomer loads per unit of surface area.
Representative Results
The protocol described in this manuscript is set up to determine lipid polyester monomers (i.e., cutin or suberin), minimizing the contributions of non-cutin lipids10. Figure 1 presents an overview of the assay, which altogether takes between 8 – 10 days (from initial tissue harvesting to obtaining GC data), depending on how long samples are allowed to dry.
The selected base-catalyzed methanolysis (Figure 2) method to depolymerize polyesters was previously validated for Arabidopsis seeds, which contain both cutin and suberin. Tissues are first homogenized and exhaustively delipidated to remove solvent-extractable lipids. The residue yield after extraction, as percentage of initial fresh weight, is usually 6% for A. thaliana Col-0 leaves. Cell wall-enriched residues are dried in a vacuum desiccator and then depolymerized into their constituent methyl ester monomers by base-catalyzed transmethylation. Two-hour incubation was chosen as the critical time required for proper depolymerization and recovery of lipid polyester components. Longer incubation times resulted in increase in 2-hydroxy acids; these potentially derive from membrane sphingolipids10.
A typical chromatogram if Arabidopsis wild type leaf cutin is shown in Figure 3, for O-TMSi ether derivatives (Figure 3A) and O-acetyl derivatives (Figure 3B). Each peak was identified by comparison to mass spectra from the literature7,8 and a public database12.Our video protocol shows how to prepare TMSi derivatives, but samples can alternatively be acetylated to derivatize hydroxyl groups. Silylated derivatives are good for identification purposes because they give diagnostic mass spectra. However, acetylated derivatives are more stable and a good alternative to silylation once monomers have been identified 10. To help implement this protocol in laboratories that only have GC coupled to flame ionization detector (FID), GC/FID traces corresponding to acetylated derivatives of WT leaf cutin monomers and to a homolog series of fatty acid methyl ester standards are also shown (Supplemental Figure 4).
This method is qualitative and detects quantitative differences between samples, hence its value for mutant analysis. The amounts of individual monomers are determined using the internal standard method of quantification, enabling comparisons of monomer abundance between samples. It should be clarified, however, that the peak size (total ion counts) may not reflect the molar ratios of the monomers in the polyester. We are including editable tables of monomers to calculate monomer amounts in Arabidopsis leaf cutin as fatty acid methyl esters and TMSi derivatives (Supplemental File 1), or acetyl derivatives (Supplemental File 2) of alcohols. These tables may need to be adapted if samples are extracted from different organs or plant species.
As an example, we have analyzed Arabidopsis thaliana Columbia (Col-0) wild type leaves and two previously characterized null-mutant alleles of the CYP86A2/ATT1 gene, att1-1 (m-1) and att1-2 (m-2)13,14. Cytochrome P450 monooxygenases of the CYP86A subfamily encode putative ω-oxydases and participate in suberin and cutin monomer biosynthesis. Our results (Figure 4) demonstrate significant reductions in the loads of three major lipid monomers in the mutant leaves compared to WT leaves. Consistent with the enzyme’s predicted function, 16:0, 18:2, and 18:1 dicarboxylates were specifically affected in att1 mutants.
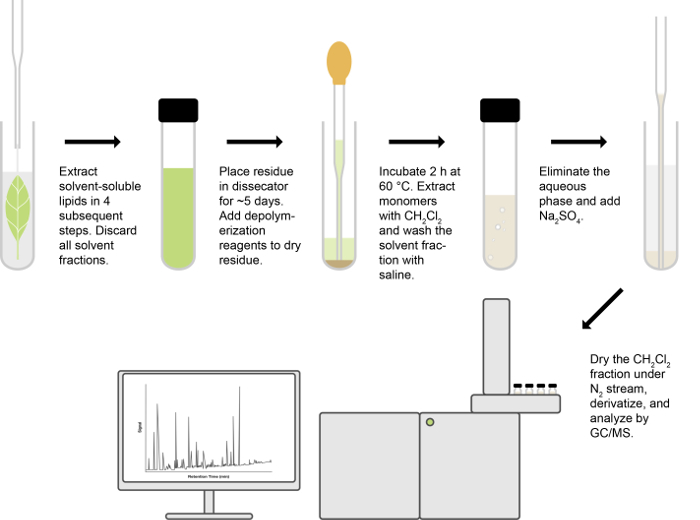 Figure 1.
Overview of lipid polyester analysis.
Please click here to view a larger version of this figure.
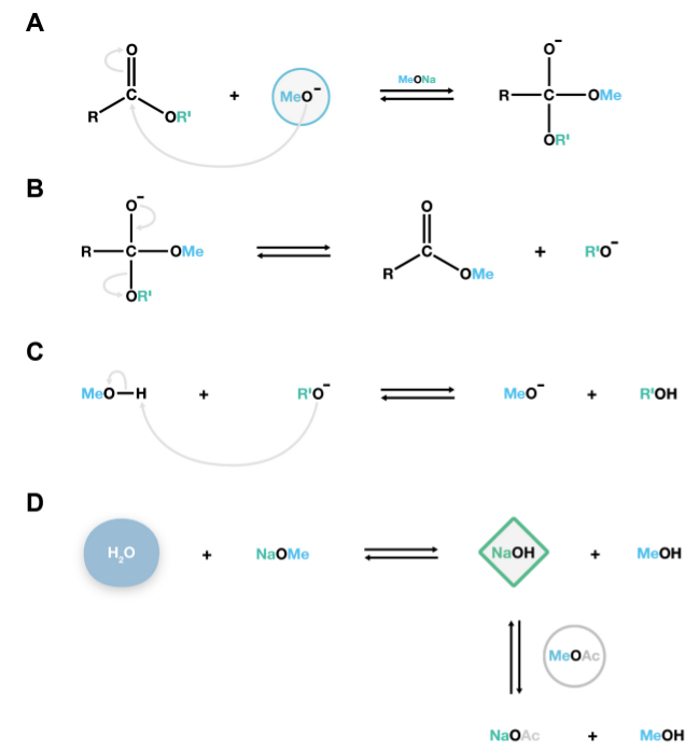 Figure 2. Mechanism of the NaOMe-catalyzed transmethylation reaction. The nucleophilic methoxide anions attack the cabonyl carbon of lipid polyesters to form an unstable tetrahedral intermediate (A), which readily dissociates into fatty acid methyl esters and alkoxide anions (B). These alkoxides are conjugate bases, and react with methanol, regenerating the catalytically active methoxide anions, thereby sustaining additional depolymerization reactions (C). If water is present in the system, it will react with sodium methoxide to form sodium hydroxide, a strong base that irreversibly hydrolyses esters to produce undesirable free fatty acids. Methyl acetate is added as a co-solvent15 to remove small amounts of sodium hydroxide within the system (D). Please click here to view a larger version of this figure.
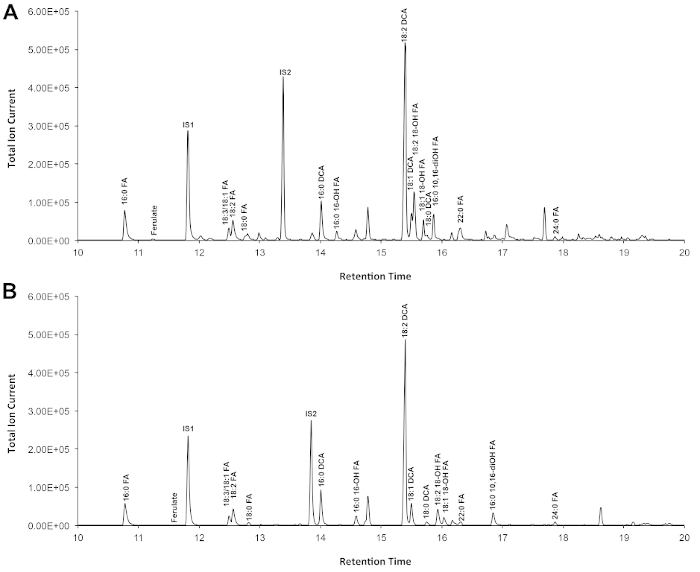 Figure 3. Representative total ion chromatogram of wild-type Arabidopsis thaliana leaf cutin monomers.(A)O-trimethylsilyl (TMSi) ether and (B) acetate hydroxyl derivatives. Please click here to view a larger version of this figure.
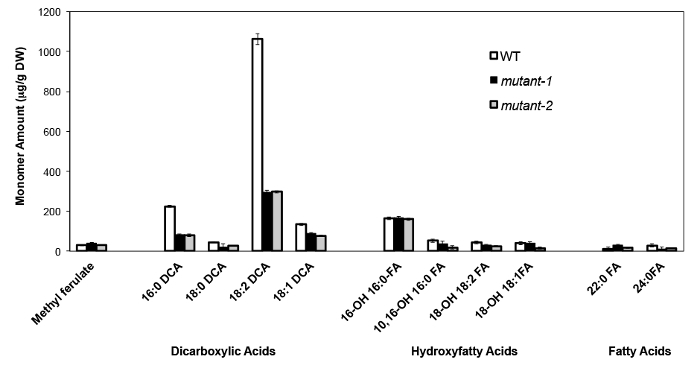 Figure 4. Cutin monomer composition of Arabidopsis thaliana WT and two null mutant alleles of the CYP86A2 gene (mutant-1=att1-1; mutant-2=att1-2). Error bars represent standard deviation of the mean (n = 4). Adapted from 13, with permission of © Blackwell Publishing (2007). Please click here to view a larger version of this figure.
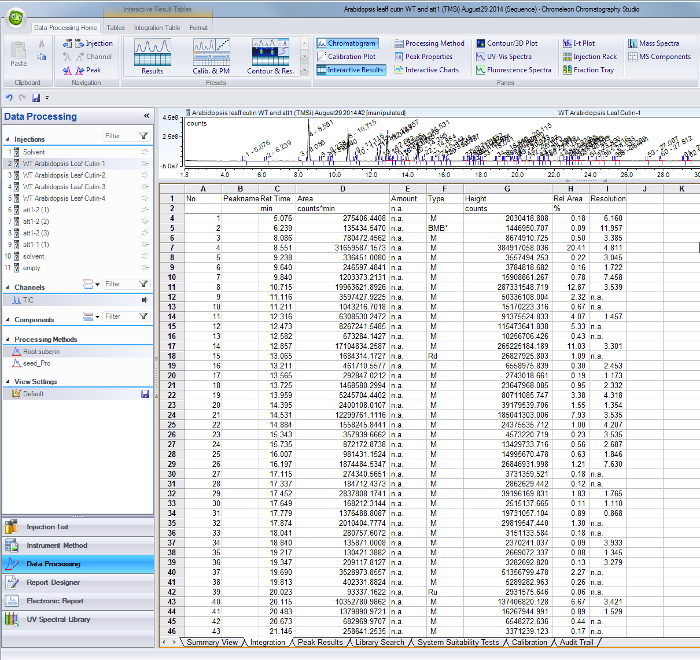 Supplemental Figure 1. Peak integration results table from the GC/MS software. Peaks corresponding to identified monomers and internal standards are identified by their retention time (column C) and area values are tabulated in column D. Please click here to download this file.
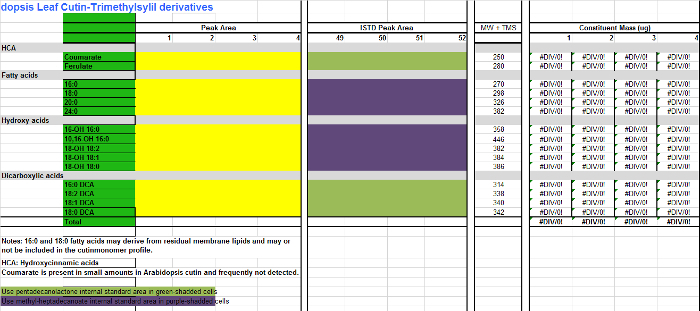 Supplemental File 2.
Table of Arabidopsis cutin monomers (trimethylsilyl ether derivatives of hydroxy fatty acid methyl esters).
Please click here to download this file.
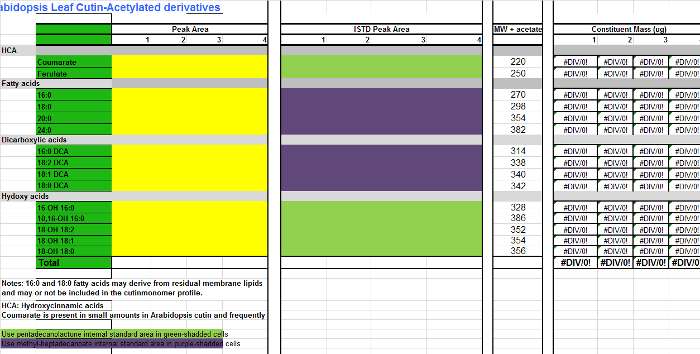 Supplemental File 3.
Table of Arabidopsis cutin monomers (O-acetyl derivatives of hydroxy fatty acid methyl esters).
Please click here to download this file.
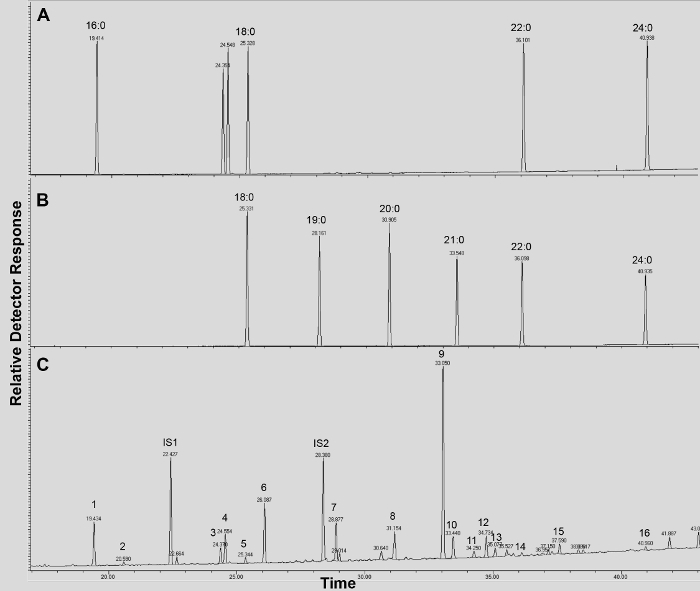 Supplemental Figure 4. GC/FID traces of (A-B) fatty acid methyl ester (FAME) retention index standards (peaks are labeled with each saturated FAME chain length); and (C) acetylated A. thaliana WT leaf cutin monomers. Numbers on peak correspond to: 16:0 FAME (1), ferulate (2), 18:3 FAME (3), 18:1/18:2 FAMEs (4), 18:0 FAME (5), sinapate (6), 16:0 DCA (7), 16-OH 16:0 FAME (8), 18:2 DCA (9), 18:1 DCA (10) 18:0 DCA (11), 18-OH 18:2 FAME (12), 18-OH 18:1 FAME (13), 20:0 FAME (14), 10,16-diOH 16:0 FAME (15), 24:0 FAME (16). DCA: dicarboxylic acid dimethyl ester; FAME: fatty acid methyl ester; IS1: internal standard 1, 17:0 FAME; IS2: internal standard 2, 15-OH 15:0 FAME. Please click here to download this file.
Discussion
Unlike other biopolymers such as DNA and proteins, plant lipid polyesters are not made from a template. Instead, their compositions depend on the specificity of the enzymes present in the tissues that make these extracellular polymers. As such, chemical analyses of the constituent components are critical to understand lipid polyester composition.
Chemical methods to cleave ester bonds include saponification, hydrogenolysis, acid-catalyzed transmethylation, and base-catalyzed transmethylation2. Each of them has advantages and disadvantages. Saponification produces free fatty hydroxy acids that can undergo secondary reactions. Hydrogenolysis with lithium aluminum hydride (LiAlH4)16 has been used for cutin analysis7. Hydrogenolysis reduces functionalized carbons to alcohols and the original structures need to be inferred by deuteriolysis with lithium aluminum deuteride (LiAlD4). The disadvantage of this approach is the requirement of high resolution GC/MS to compare the degree of deuteriation of the fatty polyols obtained to make assignments of their structures. Acid-catalyzed transesterification with methanolic boron trifluoride (BF3) has been frequently used in cutin and suberin depolymerizations8,17,18, but the reagent has a limited shelf life and may introduce artefacts due to side reactions15. Methanolic sulphuric acid also yields methyl esters of the monomers but with larger proportions of 2-hydroxy fatty acids, which presumably are not true lipid polyester components, compared to other methods10.
The NaOMe-catalyzed transesterification method described in this protocol produces fatty acid methyl esters that are derivatized by silylation of hydroxyl groups, providing characteristic mass spectra for identification, or by acetylation to provide more stable derivatives of hydroxyl groups for quantification. One drawback of this technique is that hydrolysis competes with transesterification when water is present in the reaction. Water reacts with NaOMe (the catalyst) and produces NaOH, which in turn hydrolyses fatty acid methyl esters to yield free acids (Figure 2D). This is an undesirable side reaction because two peaks will be present for each fatty acid: a methyl ester and a TMSi ester derivative, thus complicating the analysis. Using anhydrous reagents and adding methyl acetate as a co-solvent to compete with saponification are thus crucial steps to prevent hydrolysis (Figure 2D).
Cutin and suberin contain between 1 and 26% glycerol4. However, this monomer will not be detected by the experimental conditions described in this protocol. Glycerol is highly hydrophilic and, unlike the fatty acid methyl ester monomers, will be eliminated during the aqueous solvent-washing steps. This limitation also applies to other cutin depolymerization methods, but glycerol can be determined in the aqueous layer obtained after transesterification using an enzymatic method. Alternatively, it can be quantified using milder conditions (e.g., 0.05 M NaOMe) without further water extraction to detect all monomers, including glycerol19,20.Although useful for the purpose of glycerol quantification, mild conditions usually give incomplete depolymerization of cutin and suberin.
If a GC coupled to a flame ionization detector (FID) is available, all replicates can be analyzed in this instrument for quantitative purposes, after peaks of a representative sample have been identified by GC/MS. Alternatively, monomers in the GC/FID traces can be identified if their retention indices are known. The flame ionization detector has especially high sensitivity and a broad range of proportionality, which is critical for quantification of major and minor sample components in single runs. In addition, it is robust and easy to maintain and operate15.
The described protocol allows for the reliable and reproducible isolation, identification, and quantification of plant lipid polyester monomers, allowing the chemical characterization of mutants that differ in the composition of one or more lipid polyester monomers. The procedure is scalable, it can be easily adapted to process both small and bulk quantities of various plant materials, including roots, seeds, leaves, stems and flowers. Mass spectral data of lipid polyester monomers from many species have been publishede.g.,21-26 and constitute valuable resources to identify unknown monomers when adapting this protocol to other tissues and/or species. This method is applicable to investigations of the biosynthesis, regulation, and distribution of lipid polyesters in higher plants.
Disclosures
No conflicts of interest declared.
Acknowledgments
This work was supported by a Natural Sciences and Engineering Research (NSERC)-USRA grant to S.J., and by an NSERC-Discovery Grant to I.M. We thank Richard Bourgault, Meghan Rains, and Amanda Fluke for technical assistance. Seeds of att1-1 and att1-2 mutants were kindly provided by Dr. Jian-Min Zhou, Institute of Genetics and Developmental Biology, Beijing, China.
References
- Kolattukudy P. Biopolyester membranes of plants: cutin and suberin. Science. 1980;208(4447):990–1000. doi: 10.1126/science.208.4447.990. [DOI] [PubMed] [Google Scholar]
- Kolattukudy PE. Polyesters in higher plants. Adv. Biochem. Eng. Biot. 2001;71:1–49. doi: 10.1007/3-540-40021-4_1. [DOI] [PubMed] [Google Scholar]
- Yeats TH, Rose JKC. The formation and function of plant cuticles. Plant Physiol. 2013;163(1):5–20. doi: 10.1104/pp.113.222737. [DOI] [PMC free article] [PubMed] [Google Scholar]
- Pollard M, Beisson F, Li Y, Ohlrogge JB. Building lipid barriers: biosynthesis of cutin and suberin. Trends Plant Sci. 2008;13(5):236–246. doi: 10.1016/j.tplants.2008.03.003. [DOI] [PubMed] [Google Scholar]
- Beisson F, Li-Beisson Y, Pollard M. Solving the puzzles of cutin and suberin polymer biosynthesis. Curr. Opin. Plant Biol. 2012;15(3):329–337. doi: 10.1016/j.pbi.2012.03.003. [DOI] [PubMed] [Google Scholar]
- Heredia A. Biophysical and biochemical characteristics of cutin, a plant barrier biopolymer. Biochim. Biophys. Acta. 2003;1620(1-3):1–7. doi: 10.1016/s0304-4165(02)00510-x. [DOI] [PubMed] [Google Scholar]
- Bonaventure G, Beisson F, Ohlrogge J, Pollard M. Analysis of the aliphatic monomer composition of polyesters associated with Arabidopsis epidermis: occurrence of octadeca-cis-6, cis-9-diene-1, 18-dioate as the major component. Plant J. 2004;40(6):920–930. doi: 10.1111/j.1365-313X.2004.02258.x. [DOI] [PubMed] [Google Scholar]
- Franke R, et al. Apoplastic polyesters in Arabidopsis surface tissues - A typical suberin and a particular cutin. Phytochemistry. 2005;66(22):2643–2658. doi: 10.1016/j.phytochem.2005.09.027. [DOI] [PubMed] [Google Scholar]
- Vogg G, et al. Tomato fruit cuticular waxes and their effects on transpiration barrier properties: functional characterization of a mutant deficient in a very-long-chain fatty acid -ketoacyl-CoA synthase. J. Exp. Bot. 2004;55(401):1401–1410. doi: 10.1093/jxb/erh149. [DOI] [PubMed] [Google Scholar]
- Molina I, Bonaventure G, Ohlrogge J, Pollard M. The lipid polyester composition of Arabidopsis thaliana and Brassica napus seeds. Phytochemistry. 2006;67(23):2597–2610. doi: 10.1016/j.phytochem.2006.09.011. [DOI] [PubMed] [Google Scholar]
- Li-Beisson Y, et al. Acyl-lipid metabolism. The Arabidopsis Book. 2013;11:e0161. doi: 10.1199/tab.0161. [DOI] [PMC free article] [PubMed] [Google Scholar]
- Christie WW. Mass Spectrometry of Fatty Acid Derivatives. LipidHome; 2015. Available from: http://www.lipidhome.co.uk/ms/masspec.html. [Google Scholar]
- Molina I, Ohlrogge JB, Pollard M. Deposition and localization of lipid polyester in developing seeds of Brassica napus and Arabidopsis thaliana. Plant J. 2008;53(3):437–449. doi: 10.1111/j.1365-313X.2007.03348.x. [DOI] [PubMed] [Google Scholar]
- Xiao F, et al. Arabidopsis CYP86A2 represses Pseudomonas syringae type III genes and is required for cuticle development. EMBO J. 2004;23(14):2903–2913. doi: 10.1038/sj.emboj.7600290. [DOI] [PMC free article] [PubMed] [Google Scholar]
- Christie WW, Han X. Lipid Analysis - Isolation, Separation, Identification and Lipidomic Analysis. 4th edition. Bridgwater, U.K: Oily Press; 2010. p. 446. [Google Scholar]
- Walton TJ, Kolattukudy PE. Determination of the structures of cutin monomers by a novel depolymerization procedure and combined gas chromatography and mass spectrometry. Biochemistry. 1972;11(10):1885–1896. doi: 10.1021/bi00760a025. [DOI] [PubMed] [Google Scholar]
- Matzke K, Riederer M. A comparative study into the chemical constitution of cutins and suberins from Picea abies (L.) Karst., Quercus robur L., and Fagus sylvatica L. Planta. 1991;185(2):233–245. doi: 10.1007/BF00194066. [DOI] [PubMed] [Google Scholar]
- Riederer M, Schönherr J. Quantitative gas chromatographic analysis of methyl esters of hydroxy fatty acids derived from plant cutin. J. Chromatogr. 1986;360:151–161. [Google Scholar]
- Moire L, Schmutz A, Buchala A, Yan B, Stark R, Ryser U. Glycerol Is a Suberin Monomer. New Experimental Evidence for an Old Hypothesis. Plant Physiol. 1999;119(3):1137–1146. doi: 10.1104/pp.119.3.1137. [DOI] [PMC free article] [PubMed] [Google Scholar]
- Graça J, Schreiber L, Rodrigues J, Pereira H. Glycerol and glyceryl esters of omega-hydroxyacids in cutins. Phytochemistry. 2002;61(2):205–215. doi: 10.1016/s0031-9422(02)00212-1. [DOI] [PubMed] [Google Scholar]
- Eglinton G, Hunneman DH. Gas chromatographic-mass spectrometric studies of long chain hydroxy acids-I: The constituent cutin acids of apple cuticle. Phytochemistry. 1968;7(2):313–322. [Google Scholar]
- Espelie KE, Köller W, Kolattukudy PE. 9,16-dihydroxy-10-oxo-hexadecanoic acid, a novel component in citrus cutin. Chem. Phys. Lipids. 1983;32(1):13–26. [Google Scholar]
- Holloway PJ. Intracuticular lipids of spinach leaves. Phytochemistry. 1974;13(10):2201–2207. [Google Scholar]
- Holloway PJ, Deas AHB. Epoxyoctadecanoic acids in plant cutins and suberins. Phytochemistry. 1973;12(7):1721–1735. [Google Scholar]
- Holloway PJ. In: The chemical constitution of plant cutins. Cutler DF, Alvin KL, Price CE, editors. London: Academic Press; 1982. pp. 45–85. [Google Scholar]
- Croteau R, Fagerson IS. The constituent cutin acids of cranberry cuticle. Phytochemistry. 1972;11(1):353–363. [Google Scholar]


