Abstract
Dementia, caused by irreversible neurodegenerative disorders such as Alzheimer's disease or reversible non-degenerative conditions, is rapidly becoming one of the most alarming health problems in our aging society. This cognitive disorder associated with a multitude of clinical differentials with overlapping clinical, pathological, and imaging features is difficult to diagnose and treat, as it often presents late after significant neuronal damage has already occurred. Novel disease-modifying treatments being developed will have to be corroborated with innovative imaging biomarkers so that earlier reliable diagnosis can be made and treatment initiated upon. Along with new specific PET radiotracers, integrated PET/MRI with combined methodological advantage and simultaneously acquired structural-cum-functional information may help achieve this goal. The present pictorial essay details our experiences with PET/MRI in dementing disorders, along with reviewing recent advances and future scope.
Keywords: Alzheimer's disease, amyloid PET, dementia, 18F-FDG, integrated PET/MRI, vascular dementia
Introduction
The number of patients with dementia is rapidly increasing worldwide and is estimated to double every 20 years to reach 81.1 million by 2040.[1] Alzheimer's disease (AD) is the most common dementia in the elderly population,[2] whereas dementia with Lewy bodies (DLB) and frontotemporal dementia (FTD) account for approximately 15-25% of cases.[3] On the other hand, potentially reversible causes have been reported to vary from 0 to 23%.[4,5] Alcohol- and medication-related dementia, normal pressure hydrocephalus (NPH), tumors, metabolic disorders and central nervous system (CNS) infections include some of the more common causes. Vascular dementia (VaD) is another secondary dementia and is the second commonest dementia after AD.[6]
Imaging for patients with suspected dementias is routinely performed and the recent American Academy of Neurology Practice Parameter recommends the use of structural imaging, i.e., computed tomography (CT) or magnetic resonance imaging (MRI), to aid in the diagnosis of dementia as well as to specifically rule out reversible, treatable causes.[7]
In the absence of definitive therapy, the usual approach of clinicians toward dementia has so far been one of therapeutic nihilism, resulting in limited interest beyond the exclusion of the traditional reversible dementias.[8] However, improved understanding of AD pathophysiology[9] and newer target-specific drug treatments[10] have accelerated research for an early and accurate etiological diagnosis for all suspected dementia cases, with the hope for targeted management resulting in a positive prognosis.
Regional hypometabolism on 18F-FDG/PET and volume loss of specific brain regions on MRI have been described as “neuronal injury” biomarkers and used as an adjunct to clinical diagnosis for over two decades for classifying various types of dementia.[11] Recently, the finding of Aβ accumulation playing a critical role in the pathogenesis of patients with early-onset AD has put forth a structural basis of dementia and has introduced amyloid PET scan for the differential diagnosis of dementia and as a tool that may guide the design and timing of therapeutic interventions aimed at modifying the course of this illness.[12,13]
Thus, with the understanding that development of pathologic changes occurs long before the development of functional impairment, neuroimaging will have a potential role to play in the accurate as well as early (even presymptomatic) diagnosis of dementing disorders. A number of structural and functional imaging techniques including CT, MRI, PET, and SPECT are available for evaluating neurodegenerative diseases. Functional neuroimaging with radioactive tracers along with the structural and functional correlates of MRI have been the current strategy to improve the diagnostic accuracy for classifying dementias[14,15,16] and predicting mild cognitive impairment (MCI) to AD conversion.[17] With the advent of integrated PET/MRI in the clinical setting, it is expected that morphologic as well as molecular information regarding neurodegenerative disorders is obtainable in a single study with the highest attainable accuracy.
The combination of PET and MR imaging information when acquired at the same time offers several potential advantages in neurosciences as follows: (a) systematic addition of high-resolution MR imaging information to PET data provides accurate and consistent information on underlying structures with better anatomic localization and improved scan interpretation; (b) anatomical abnormalities such as arachnoidal cysts or old hemorrhage, detectable by MRI in the same setting, may influence the tracer uptake pattern helping in improved diagnostic certainty in a short time; (c) provides an opportunity to perform atrophy correction and partial volume effect correction of the PET data for both “cold spot” (FDG) and “hot spot” (amyloid PET) imaging using consistent simultaneous MR information and mathematical algorithms;[18] (d) detection and exclusion of non-neurodegenerative pathologies co-existent with neurodegenerative conditions using MRI information; (e) to aid in improved follow-up/treatment response evaluation by better quantification of PET tracer uptake using better attenuation correction sequences such as UTE sequence; and (f) reduced CT dose exposures expected if PET/MRI becomes routine investigational modality as most of these patients would require repeated follow-up evaluations, especially with the advent of newer treatment strategies.
The present study highlights the performance and clinical applicability of integrated PET/MRI in imaging patients with clinically suspected dementia. Also, we attempted to incorporate relevant images highlighting the potential of simultaneous PET/MRI in each clinical scenario with individual and complementary role played by both modalities in arriving at the diagnosis more convincingly.
Materials and Methods
Integrated PET/MRI was performed on 48 patients with suspected dementia from Jan 2013 to Dec 2014 using simultaneous hybrid PET/MRI scanner (Siemens Biograph mMR; Siemens Healthcare, Erlangen, Germany). This system consists of a 3-T MRI scanner [equipped with Total Imaging Matrix coil technology; high-performance gradient systems (45 mT/m); slew rate 200 T/m/s] with a fully functional PET system [spatial resolution 4.3 mm at 1 cm and 5.0 mm at 10 cm; sensitivity 1.47% at field of view (FOV) center and 1.38% at 10 cm] equipped with avalanche photodiode technology.[19,20]
Patients were fasted for at least 6 h before intravenous tracer injection of 290 ± 24 MBq of 18F-FDG and examination performed after a mean uptake period of 40.2 ± 11 min from the time of tracer injection in a dimly lit room, with the patient lying quiet, to avoid any interference with the distribution of the tracer.
Simultaneous PET/MRI examination was acquired over 15 min and comprised a transversal T1-weighted UTE sequence for attenuation correction (repetition time (TR)/echo time (TE1) (TE2), 11.94/0.07/22.46; excitation angle, 10°; matrix size, 192 × 192 × 192; resolution, 1.6 mm × 1.6 mm × 1.6 mm; bandwidth, 1532 Hz/pixel.
MRI sequences included transversal 2D-encoded fluid-attenuated inversion recovery (FLAIR) sequence (resolution, 1 mm × 0.9 mm × 5 mm; slice thickness, 5 mm); T2-weighted 2D-encoded turbo spin-echo sequence in axial, sagittal, and coronal orientations depending on the disease pattern (resolution, 0.7 mm × 0.4 mm × 0.5 mm; slice thickness, 5 mm); sagittal 3D-encoded magnetization-prepared rapid-acquisition gradient-echo (MPRAGE) sequence (resolution, 1.2 mm × 1 mm × 1 mm); Diffusion Weighted Imaging (DWI) (resolution, 1.4 mm × 1.4 mm × 5 mm; slice thickness, 5 mm); and susceptibility weighted imaging (SWI) (resolution, 0.8 mm × 0.7 mm × 4 mm; slice thickness, 5 mm). Another imaging sequence included in this study was post-contrast (IV gadolinium diamide, 1 mmol/kg body weight) 3D MPRAGE sequence from vortex to upper neck covering the whole head.
All PET data were acquired in sinogram/frame mode. After the scan, all coincidence data were sorted and subsequently reconstructed into transaxial slices corresponding using an iterative 3D ordered-subset expectation maximization (OSEM) algorithm with three iterations and 21 subsets. The attenuation maps were computed from UTE sequences which have been found reliable for MR attenuation correction in earlier published literature.[21,22,23]
MRI images, PET images, and fused PET/MRI images hence obtained were visually analyzed individually and together by radiologist 1 (AJ) with 10 years, radiologist 2 (ST) with 10 years, nuclear medicine physician 1 (AJ) with 10 years and nuclear medicine physician 2 (AG) with 3 years of experience. Statistical parametric mapping was performed using Scenium v. 1 brain analysis software package (Siemens), which compared the patient's scan with a normal database on a voxel-by-voxel basis for quantitative analysis, as reported earlier.[23] The software automatically correlates the current patient study with an “average” healthy brain for preliminary abnormality computation. The fusion engine produces results that are reliable and reproducible between multiple sessions and multiple users. All acquired MRI data sets provided diagnostic image quality.
PET/MRI images [Figures 1–11] yielding any abnormality (regions of hypometabolism and/or structural abnormality) on visual inspection or with the statistical data found significant by Scenium v. 1 were reported as abnormal in parallel with clinical diagnosis and follow-up.
Figure 1 (A-G).
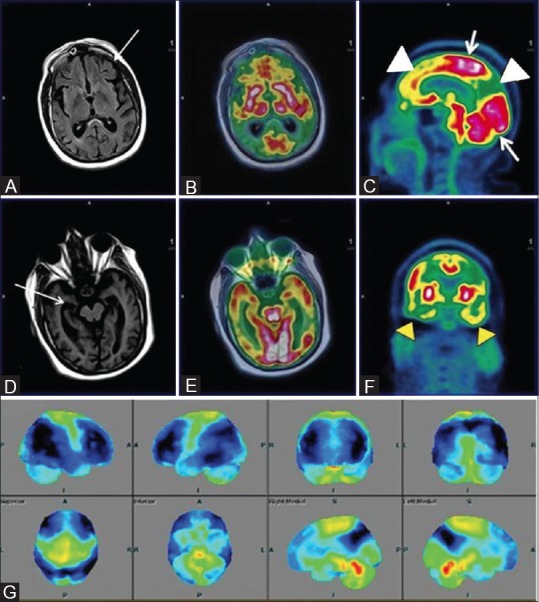
Axial FLAIR (A) Reveals prominent ventricles and sulcal spaces (white arrow)-cerebral atrophy; Axial T1wMPRAGE (D) Reveals hippocampal atrophy; Axial fused PET MRI (B and E) Sagittal (C) and coronal PET (F) Reveal bilateral fronto-temporal and parietal hypometabolism (white arrowhead). Note well preserved glucose metabolism in sensorimotor cortex and occipital lobes (white arrow) on sagittal PET images consistent with established AD. Statistical parametric map surface display (G) Shows marked hypometabolism (blue) in corresponding areas of bilateral cerebral hemispheres
Figure 11 (A-F).
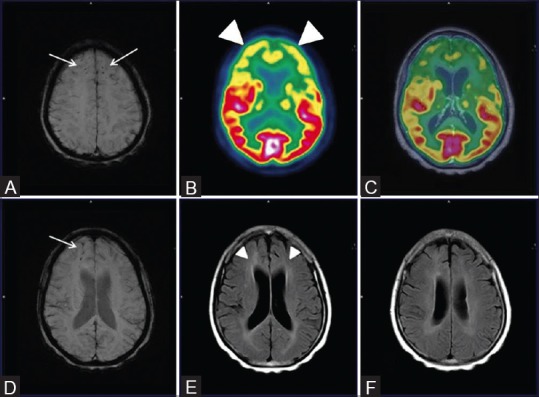
Axial SWI MRI Images (A and D) Reveal punctate old hemorrhagic residua in bilateral frontal and parietal regions (white arrows) with corresponding bilaterally symmetrical fronto-temporal hypometabolism (white arrowheads) on axial PET (B) and fused PET/MRI images (C) Also, on axial FLAIR MRI images (E and F) Ill defined non enhancing white matter changes in bilateral periventricular regions, corona radiata and centrum semiovale (white arrowheads) were also noted
The 48 patients scanned at our center using integrated FDG PET/MRI consisted of 30 cases of neurodegenerative disorders, 12 VaD, 3 cases of Creutzfeldt–Jakob disease (CJD), 2 cases of traumatic brain injury (TBI), and 1 case of HIV-associated dementia (HAD). Some of the interesting cases highlighting the potential of simultaneous PET/MRI acquisition are discussed below.
Case Examples
Alzheimer's disease
A 56-year-old female presented with gradually progressive memory loss since past 5 years with new-onset behavioral changes. On clinical examination by the neurologist, the patient was characterized as probable AD and referred for PET/MRI evaluation. The scan findings revealed [Figure 1] characteristic hypometabolism of bilateral frontal, temporal, and parietal lobes including the precuneus and posterior cingulate gyrus, with sparing of occipital and bilateral sensorimotor cortices.
Similarly, a 65-year-old female with gradually progressive forgetfulness and new-onset difficulties in comprehension was evaluated and yielded similar FDG PET findings with additional hippocampal atrophy and sclerosis on MR images [Figure 2]. Both these cases demonstrate excellent complimentary information provided by PET and MR counterparts in confirming AD. More significantly, in early AD with normal structural parameters on MRI, PET offers a considerable advantage while MR helps to rule out causes such as trauma, vascular pathologies, and coexisting benign pathologies.
Figure 2 (A-G).
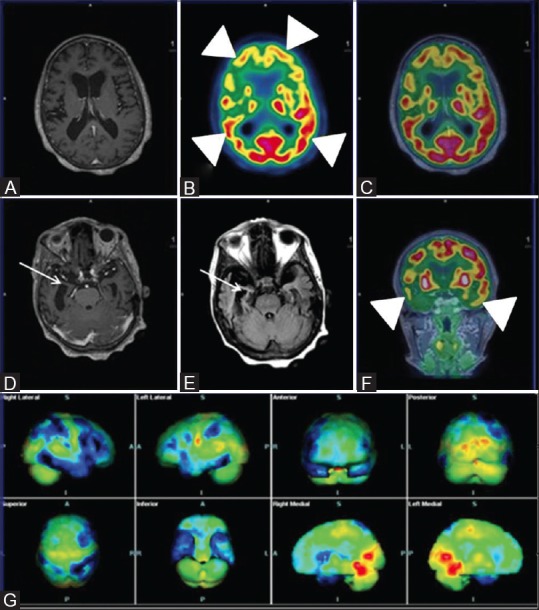
Axial T1wMPRAGE (A) Reveals cerebral atrophy and significant bilateral fronto-parietal and temporal hypometabolism (white arrowheads) on axial PET (B) Axial fused PET/MRI (C) and coronal PET (F) Consistent with established AD; Note asymmetrical glucose metabolism of right fronto-parieto-temporal region; Axial T1wMPRAGE (D) and FLAIR images (E) Reveal loss of hippocampal volume and sclerosis (white arrows) affecting the right side more than the left. Statistical parametric map surface display (G) Shows marked asymmetrical bilateral cerebral hemisphere hypometabolism (blue) (R > L)
AD, the most prevalent neurodegenerative affliction of the elderly, is caused by consistently increased production, misfolding, and pathologic aggregation of specific peptides such as β-amyloid plaques and τ-protein. Common disease models suggest that these pathologies contribute to the features of neurodegeneration, such as neuronal dysfunction and neuronal loss.[24]
As of now, treatment for AD is marred by limited therapeutic options, as with other neurodegenerative disorders. However, early diagnosis and more accurate differential diagnoses might offer greater benefit to the patients if appropriate therapies are instituted before significant neuronal damage occurs.
For AD evaluation, several suitable neuroimaging methods including MR imaging that allows the measurement of neuronal loss (atrophy),25 18F-FDG PET for assessment of neuronal dysfunction,[26] and amyloid PET imaging employing several new radiotracers (18F-florbetapir, 18F-florbetaben, 18F-flutemetamol) allow imaging of cerebral amyloid deposits.[27] It has been shown in several studies that in established AD, combinations of structural MR imaging and 18F-FDG PET or MR imaging and amyloid imaging revealed higher diagnostic accuracy as compared with either single method.[28,29]
Apart from the benefits of combined multimodal imaging described above, combination of these modalities may yield some additional benefits in MCI-AD spectrum management. For example, Karow et al.[30] reported that FDG PET has the same sensitivity as MR imaging for detecting brain degeneration in preclinical and mild AD, suggesting MR imaging to be a practical clinical biomarker for early detection of AD. Furthermore, although amyloid imaging is more sensitive,18F-FDG seems to show higher specificity with greater short-term predictive value.[31] Moreover, structural MR imaging may permit a better estimation of time to conversion in amyloid-positive subjects than the amyloid level itself.[32] Hence, a combination of amyloid imaging with MR is likely to increase the probability of AD development in preclinical and mildly cognitively impaired stages of disease, according to the current guidelines.[33] Therefore, one may infer that integrated amyloid PET/MRI may be the imaging procedure of choice in the diagnosis and management of AD spectrum of neurodegenerative disorders.
Frontotemporal lobe degeneration
Frontotemporal degeneration
A 56-year-old male presented with history of gradually worsening retrograde amnesia with past history of road traffic accident dating back to 1999. Clinically, the patient appeared to fit neurodegenerative profile, but differentiation between early AD, FTD, and TBI was needed for establishing diagnosis. Hence, an integrated PET/MRI scan was performed, which yielded evidence of [Figure 3] bilateral frontotemporal and mesiotemporal hypometabolism without any apparent loss of hippocampal volume or parietal FDG uptake. Also, gliosis and encephalomalacia in bilateral parasagittal frontoparietal cortex and a midline old falx hematoma with hemorrhagic residua was noted on SWI images, which was observed as absence of any evidence of parenchymal microangiopathy or white matter lesion and normal hippocampal volume on FLAIR images. A diagnosis of FTD was considered in this difficult case scenario. On one hand, PET provided excellent assistance in diagnosis; on the other hand, MRI evaluated the traumatic component and also ruled out AD based on normal hippocampal volume.
Figure 3 (A-I).
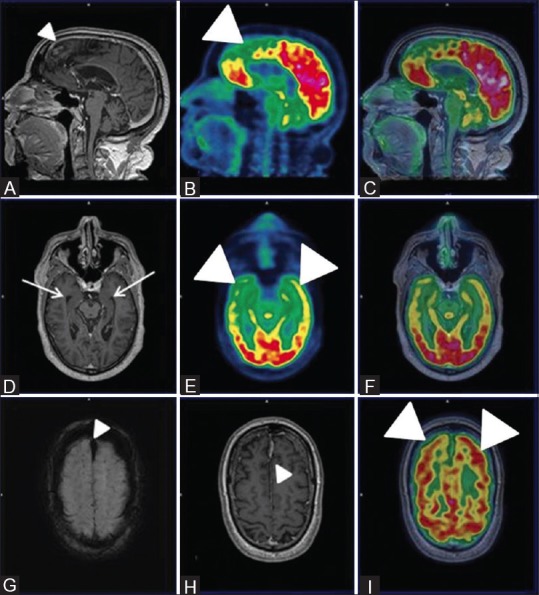
Sagittal PET (B) Fused PET/MRI (C) Axial PET (E) and axial fused PET/MRI (I and F) reveal bilateral fronto-temporal hypometabolism (white arrowheads) with apparently normal parietal FDG uptake and hippocampal volume on axial T1wMPRAGE images (white arrow) (D) Also, Sagittal and axial T1wMPRAGE MRI images (A and H) reveal features of gliosis and encephalomalacia in bilateral parasagittal frontoparietal cortex (white arrowhead) and a midline old fax hematoma (white arrowhead) and hemorrhagic residua noted on axial SWI images (white arrowhead) (G) These features favored the diagnosis of FTD
Also, we encountered a similar 57-year-old male patient with hippocampal atrophy with well-preserved parietal, precuneus, and posterior cingulate gyrus metabolism [Figure 4]. Hence, FTD was diagnosed despite features of evident hippocampal atrophy.
Figure 4 (A-D).
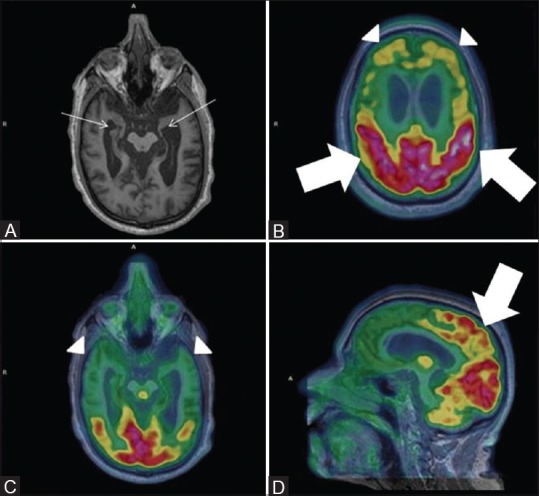
Severe bilateral hippocampal atrophy evident by severely reduced hippocampal volume (white arrows) (Left more than right) on Axial MRI images (A) With prominent bilateral frontal and temporal hypometabolism on axial fused PET MRI images (white arrowhead) (B and C). Note preserved parietal metabolism on axial and sagittal fused PET MRI images (white thick arrows) (D)
These cases represent a constantly encountered clinical situation of coexistent traumatic/vascular non-neurodegenerative conditions being evaluated simultaneously by MRI in a single session, leading to increased diagnostic confidence and earlier diagnosis while avoiding multiple inconclusive diagnostic procedures.
Semantic dementia
A 61-year-old male patient presented to the Department of Neurology with gradually worsening single word comprehension, loss of semantic memory with well-maintained episodic memory, and preserved fluent speech. These findings were suggestive of semantic dementia, a subtype of frontotemporal lobar degeneration (FTLD) group of disorders. Patient underwent PET/MRI in which the MR images typically depicted bilateral asymmetrical hippocampal atrophy (L > R) and predominant anterior temporal cortical atrophy with relatively spared frontal-parietal cortices [Figure 5]. FDG PET depicted bilateral asymmetrical hypometabolism predominantly affecting the anterior temporal cortices, more so on the left side, with fronto-parieto-occipital sparing. Both findings were equally contributory and together with typical clinical features helped in clinching diagnosis.
Figure 5 (A and B).
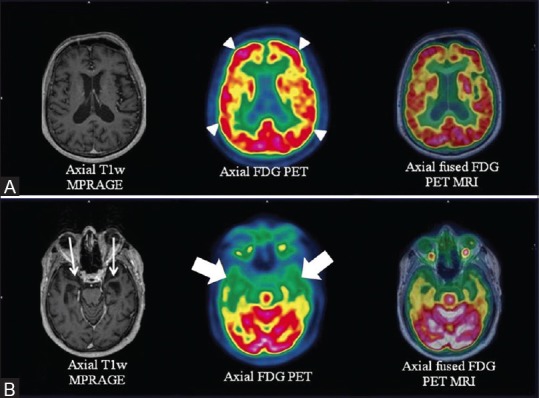
Axial T1w MPRAGE, FDG PET and fused PET/MRI images at the level of hippocampus (row B) reveals bilateral (more on left side) hippocampal atrophy with predominantly left sided anterior temporal cortex atrophy (white arrows) and corresponding anterior polar temporal hypometabolism (white thick arrows). Similar images at a higher level (row A) depict absence of any fronto-parietal atrophy or hypometabolism (white arrowheads) which in conjunction with patient's semantic memory loss confirmed diagnosis of semantic dementia
Bilateral, typically anterior, asymmetrical temporal lobe hypometabolism, as evident in this case, combined with clinical features are typical imaging hallmarks of semantic dementia.[34]
Vascular dementia
A 71-year-old male with documented evidence of previous old cerebral infarction presented to the neurologist for complaints of recurrent seizure and cognitive impairment. The patient's clinical features represented a diagnostic dilemma between AD and multi-infarct dementia, a commonly encountered clinical question. Ideally, the patient would have required a separate SWI MRI and FDG PET/CT for evaluation of possible VaD or AD. Consequentially, the patient was taken up for FDG PET/MRI, which suggested [Figure 6] cerebral atrophy, multiple chronic ischemic and hemorrhagic infarcts in bilateral cerebral hemispheres with regional matched hypometabolism and associated frontotemporal hypometabolism. Hence, PET–MRI played a significant role in differentiating the two conditions.
Figure 6 (A-F).
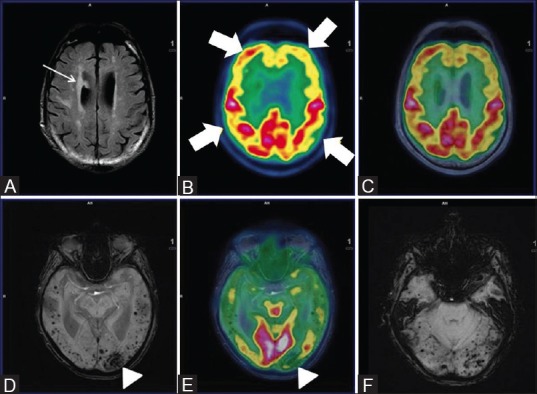
Axial FLAIR (A) reveals multiple non-enhancing white matter hyperintensities in bilateral periventricular region (white arrow) with bilateral fronto-parietal hypometabolism (white thick arrows) on axial PET (B) and fused PET/MRI (C) Axial SWI revealed multiple subcortical and deep old hemorrhagic residua in bilateral cerebral hemispheres (D) and cerebellum (F) In addition, left occipital lobe chronic infarct and gliosis was noted (white arrowhead) (D) and corresponding hypometabolism on axial fused PET/MRI image (white arrowhead) (E) These findings favored vascular dementia than AD
Another 71-year-old male, known case of left cerebellar infarct, presented with left hand weakness, resting tremors right hand, and loss of memory. PET/MRI carried out revealed [Figure 7] chronic infarct involving the right temporal lobe with encephalomalacic and gliotic changes and corresponding FDG hypometabolism along with dilatation of temporal horn of the right lateral ventricle. Asymmetrical atrophy of bilateral hippocampi was also observed significantly involving the right side (not shown). Generalized cortical atrophy, more on the right side, with relative hypometabolism of right parietal, occipital, frontal lobes, and basal ganglia was also noted. DWI MRI showed absence of any new-onset acute infarct (not shown). Matching areas of hypometabolism with cerebral infarction and cortical atrophy led to a more confident diagnosis combining causal neuropathology with resulting neurodegenerative patterns.
Figure 7 (A-G).
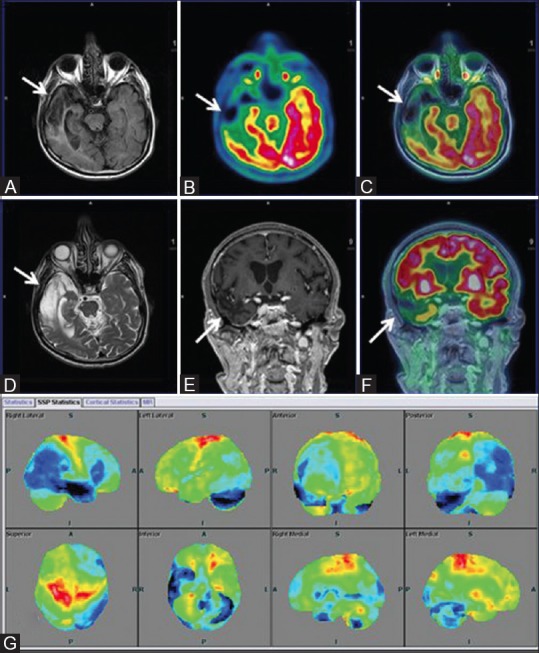
(A) Asymmetrical focal areas of hypometabolism in right temporal region (white arrow) on axial PET and T2w MRI images (B) Axial fused PET-MRI (C) Coronal T1w MPRAGE (D) Suggesting old infarcts consistent with VaD. Surface display of statistical parametric map (E) and coronal fused PET/MRI (F) with corresponding areas of encephalomalacia and gliosis (white arrow) on axial FLAIR (G) Showing marked hypometabolism (blue) in right temporal and left temporo occipital regions, compared to standard database of Scenium software
Although pure VaD is not a PET-applicable dementia, it is sometimes associated with AD or other neurodegenerative pathology, and these patients should be examined with FDG PET to determine the comorbidity of AD or other neurodegenerative pathology. Also, amyloid imaging can be used to exclude the possibility of AD when there is no amyloid deposit.
These cases typically highlight the potential of PET/MRI in differential diagnosis of neurodegenerative disorders when associated with non-neurodegenerative afflictions which are commonly encountered in the elderly. The verification of vascular abnormalities as copathology of neurodegeneration may allow therapeutic interventions (e.g., regulation of hypertension) and, thus, may lead to a better outcome.
HIV-associated dementia
A 65-year-old, recently diagnosed HIV positive male patient presented with clinical complaints of gradually worsening slurring of speech with impaired memory. The integrated FDG PET/MRI revealed [Figure 8] extensive confluent non-enhancing white matter hyperintensities in bilateral periventricular and deep white matter with features of cerebral and cerebellar atrophy. Hypometabolism of bilateral frontal, temporal, and cerebellar cortices with relative sparing of bilateral parietal (ruling out AD) and occipital lobes was evident. No focal enhancement, mass effect, or focal FDG uptake was noted, which ruled out other AIDS-related CNS conditions such as primary CNS lymphoma, progressive multifocal leukoencephalopathy (demyelinating white matter lesions on MR imaging), or toxoplasmosis (with multiple deep gray matter lesions)[35] for which imaging was primarily undertaken.
Figure 8 (A-I).
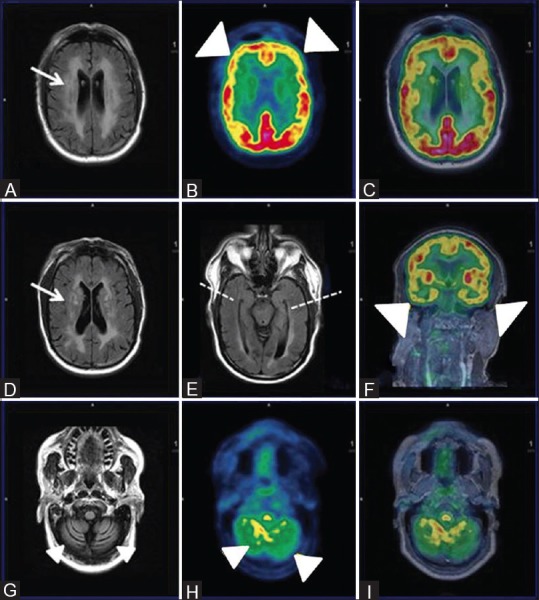
Axial FLAIR Images (A and D) Reveal extensive non-enhancing white matter hyperintensities in bilateral periventricular and deep white matter (white arrows) with cerebral and cerebellar atrophy (white arrowhead) (G) Axial PET (B and H), fused PET/MRI (C and I) and coronal fused PET MRI reveal reduced FDG uptake inbilateral frontal, temporal (R > L) and cerebellum (white arrowheads) with relatively spared bilateral parieto-occipital lobes. Axial FLAIR image showing symmetrical bilateral temporal lobes and hippocampi with apparent normal volume and signal intensity (broken white line)
The occurrence of HAD, previously referred as AIDS dementia complex (ADC), ranges from 1 in 10 to 1 in 3. Identification and establishment of an appropriate treatment regimen is of paramount importance, as successful treatment with antiretroviral therapy has the potential to ameliorate cognitive symptoms and sometimes reverse cognitive deficits in HIV dementia.[36] Cognitive decline in HIV-infected individuals has been evaluated by neuroimaging using conventional MRI-based volumetric studies showing cortical, subcortical, and hippocampal atrophy.[37] However, these changes are not generally apparent on an individual basis, as was in this case, showing no significant reduction of hippocampal volume. Advanced MRI parameters such as DTI, showing reduced fractional anisotropy,[38] and magnetic resonance spectroscopy (MRS), depicting reduced concentrations of N-acetylaspartate (NAA) and combined glutamate and glutamine, have also been evaluated.[39] FDG PET, apart from evaluating cortical glucose hypometabolism, also contributed by ruling out AD as evident by preserved parietal cortical metabolism. Patient showed significant cognitive improvement after 4 months of initiation of appropriate antiretroviral therapy.
In these clinical settings, simultaneous18F-FDG PET/MRI appears to be a potential modality for dementia evaluation and simultaneously ruling out other CNS conditions associated with HIV.
Creutzfeldt-Jakob disease
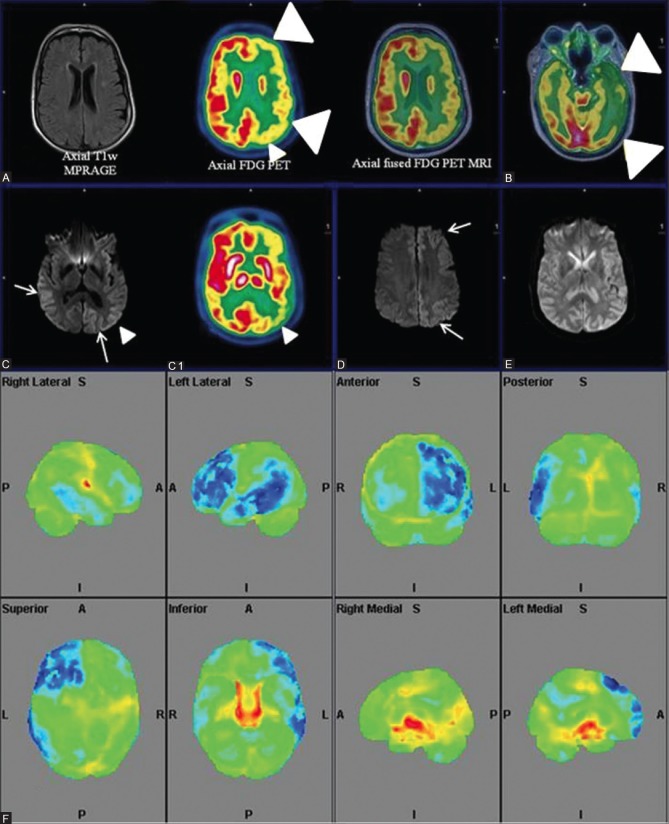
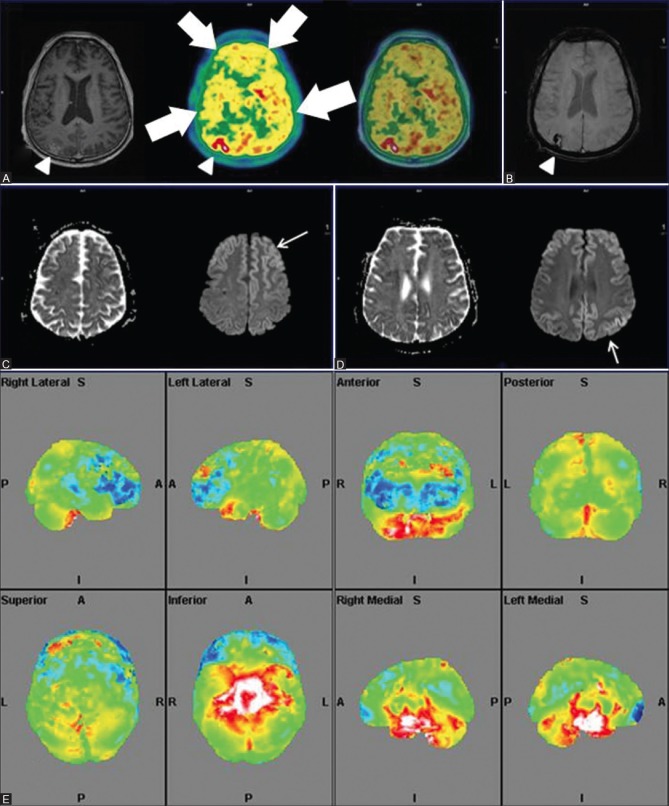
A 67-year-old female presented to the neurology department with complaints of rapidly progressive memory loss since 6 months, loss of speech 1 month prior to scan, followed by repeated vomiting culminating into altered sensorium. The patient was clinically classified as a case of rapidly progressive dementia (RPD) whose differentials included prion disease (sporadic CJD), HIV, cerebral malignancy/metastasis, and primary cerebral vasculitis, among other rare entities. To avoid repeated separate FDG PET and MRI, the patient was evaluated with a simultaneous PET/MRI. MRI findings revealed [Figure 9] “cortical ribboning” (restricted diffusion in the cerebral cortex) involving the left fronto-parieto-occipital and temporal cortices and the right parieto-occipital regions with an associated decrease of apparent diffusion coefficient (ADC) in the basal ganglia on axial DWI, a highly sensitive (91%) and specific (95%) diagnostic marker of CJD.[40] FDG PET images revealed evidence of corresponding hypometabolism consistent with literature data.[41] Similar cortical ribbon-like hyperintensity with diffuse cerebral hypometabolism [Figure 10] was noted in a 54-year-old male patient presenting with memory loss. Both the patients had rapid clinical deterioration and died within 3 months of imaging.
Figure 9 (A-F).
Axial T1wMPRAGE, PET and fused PET/MRI (right to left) (A and B) Reveal significant left fronto-parieto-occipital and temporal hypometabolism (white arrowheads). “Ribbon-like” cortico-subcortical altered intensity in left fronto-parieto-occipital and temporal cortices (white arrows) and right parieto-occipital regions in axial DWI images (C and D) with corresponding diffusion restriction (E) Corresponding “ribboning” (C) and hypometabolism (white arrowheads) (C1). Quantitative analysis (F) shows left fronto-parietal-temporal hypometabolism (blue) out of proportion to the contralateral cortex
Figure 10 (A-E).
Axial T1wMPRAGE, PET and fused PET/MRI (right to left) (A) Reveal bilateral cortical hypometabolism (white thick arrows) with loss of normal gray white matter differentiation on PET. Axial SWI (B) Depicts discrete subacute hemorrhagic infarct (white arrowhead) increased uptake and subtle gyriform post contrast enhancement (white arrowhead) in right parieto-occipital region Restricted diffusion on ADC with cortical “ribboning” on DWI images (white arrows) at multiple axial levels (C and D) Quantitative PET analysis (E) Depicts more prominent bilateral frontal hypometabolism
Characteristic MRI findings supported by 18F-FDG hypometabolism proved instrumental in classifying the cause of RPD as possibly due to CJD. Although FDG PET has been reported in literature to be more diagnostic compared to MRI for CJD, all such studies report few cases in which MRI contributed greater or equal number of lesions and, furthermore, recommend the use of MRI and/or FDG PET. In such a clinical scenario,18F-FDG PET/MRI appears to be the most ideal imaging modality suitable for initial evaluation of CJD cases.[42,43]
Traumatic brain injury
A 47-year-old female presented with complaints of forgetfulness post mild TBI (mTBI) in a road traffic accident 3 months back. The possibility of TBI-associated dementia was considered and an 18F PET/MRI study was carried out. Axial SWI on MRI showed [Figure 11] punctate old hemorrhagic residua in bilateral frontal and parietal regions with bilaterally symmetrical frontotemporal hypometabolism. Also, ill-defined non-enhancing white matter changes in bilateral periventricular regions, corona radiata and centrum semiovale, characteristic of axonal injury, were noted. Patient's memory loss was partially reversible on follow-up.
SWI, an advanced MRI technique, is used to detect the amount and localization of microhemorrhages that appear as low-signal foci after TBI. Several studies have utilized FDG PET to evaluate TBI, and though inconsistent, FDG has been considered largely useful in TBI evaluation.[44] With current reports on the use of other novel MRI techniques such as DTI, Magnetization transfer imaging (MTI), SWI, Functional magnetic resonance imaging (fMRI), and MRS, the role of FDG PET/MRI in TBI management appears to be promising and needs further detailed analysis.[45]
Conclusion
Integrated 18F-FDG PET/MRI is a budding multimodal imaging technique that has the potential to play an important role in the evaluation of neurodegenerative disorders, more specifically when associated with non-neurodegenerative afflictions, in a short examination time with higher patient comfort and compliance, while awaiting for a greater role in the evaluation of MCI–AD spectrum bearing high clinical significance with routine availability of specific β-amyloid PET tracers.
Financial support and sponsorship
Nil.
Conflicts of interest
There are no conflicts of interest.
References
- 1.Joshi S, Morley JE. Cognitive impairment. Med Clin North Am. 2006;90:769–87. doi: 10.1016/j.mcna.2006.05.014. [DOI] [PubMed] [Google Scholar]
- 2.Kung HC, Hoyert DL, Xu J, Murphy SL. Deaths: Final data for 2005. Natl Vital Stat Rep. 2008;56:1–120. [PubMed] [Google Scholar]
- 3.Gauthier S, Reisberg B, Zaudig M, Petersen RC, Ritchie K, Broich K, et al. International Psychogeriatric Association Expert Conference on mild cognitive impairment. Mild cognitive impairment. Lancet. 2006;367:1262–70. doi: 10.1016/S0140-6736(06)68542-5. [DOI] [PubMed] [Google Scholar]
- 4.Weytingh MD, Bossuyt PM, van Crevel H. Reversible dementia: More than 10% or less than 1%. A quantitative review? J Neurol. 1995;242:466–71. doi: 10.1007/BF00873551. [DOI] [PubMed] [Google Scholar]
- 5.Clarfield AM. The decreasing prevalence of reversible dementias: An updated meta-analysis. Arch Intern Med. 2003;163:2219–29. doi: 10.1001/archinte.163.18.2219. [DOI] [PubMed] [Google Scholar]
- 6.Hébert R, Brayne C. Epidemiology of vascular dementia. Neuroepidemiology. 1995;14:240–57. doi: 10.1159/000109800. [DOI] [PubMed] [Google Scholar]
- 7.Knopman DS, DeKosky ST, Cummings JL, Chui H, Corey-Bloom J, Relkin N, et al. Practice parameter: Diagnosis of dementia (an evidence-based review). Report of the Quality Standards Subcommittee of the American Academy of Neurology. Neurology. 2001;56:1143–53. doi: 10.1212/wnl.56.9.1143. [DOI] [PubMed] [Google Scholar]
- 8.Koch T, Iliffe S. EVIDEM-ED project. Rapid appraisal of barriers to the diagnosis and management of patients with dementia in primary care: A systematic review. BMC Fam Pract. 2010;11:52. doi: 10.1186/1471-2296-11-52. [DOI] [PMC free article] [PubMed] [Google Scholar]
- 9.Jain P, Wadhwa PK, Jadhav HR. Reactive astrogliosis: Role in Alzheimer's disease. CNS Neurol Disord Drug Targets. 2015;14:872–9. doi: 10.2174/1871527314666150713104738. [DOI] [PubMed] [Google Scholar]
- 10.Pérez DI, Martínez A, Gil C, Campillo NE. From bitopic inhibitors to multitarget drugs for Alzheimer's disease future treatment. Curr Med Chem. 2015 doi: 10.2174/0929867322666150812145825. Epub ahead of print. [DOI] [PubMed] [Google Scholar]
- 11.Tartaglia MC, Rosen HJ, Miller BL. Neuroimaging in dementia. Neurotherapeutics. 2011;8:82–92. doi: 10.1007/s13311-010-0012-2. [DOI] [PMC free article] [PubMed] [Google Scholar]
- 12.Villemagne VL, Burnham S, Bourgeat P, Brown B, Ellis KA, Salvado O, et al. Australian Imaging Biomarkers and Lifestyle (AIBL) Research Group. Amyloid β deposition, neurodegeneration, and cognitive decline in sporadic Alzheimer's disease: A prospective cohort study. Lancet Neurol. 2013;12:357–67. doi: 10.1016/S1474-4422(13)70044-9. [DOI] [PubMed] [Google Scholar]
- 13.Vercher-Conejero JL, Rubbert C, Kohan AA, Partovi S, O’Donnell JK. Amyloid PET/MRI in the differential diagnosis of dementia. Clin Nucl Med. 2014;39:e336–9. doi: 10.1097/RLU.0b013e31829b9e5f. [DOI] [PubMed] [Google Scholar]
- 14.Unschuld PG. Possibilities of modern imaging technologies in early diagnosis of Alzheimer disease. Ther Umsch. 2015;72:261–9. doi: 10.1024/0040-5930/a000674. [DOI] [PubMed] [Google Scholar]
- 15.Dukart J, Mueller K, Horstmann A, Barthel H, Möller HE, Villringer A, et al. Combined evaluation of FDG-PET and MRI improves detection and differentiation of dementia. PLoS One. 2011;6:e18111. doi: 10.1371/journal.pone.0018111. [DOI] [PMC free article] [PubMed] [Google Scholar]
- 16.Shim H, Ly MJ, Tighe SK. Brain imaging in the differential diagnosis of young-onset dementias. Psychiatr Clin North Am. 2015;38:281–94. doi: 10.1016/j.psc.2015.01.007. [DOI] [PubMed] [Google Scholar]
- 17.Teipel SJ, Kurth J, Krause B, Grothe MJ. Alzheimer's Disease Neuroimaging Initiative. The relative importance of imaging markers for the prediction of Alzheimer's disease dementia in mild cognitive impairment - Beyond classical regression. Neuroimage Clin. 2015;8:583–93. doi: 10.1016/j.nicl.2015.05.006. [DOI] [PMC free article] [PubMed] [Google Scholar]
- 18.Yanase D, Matsunari I, Yajima K, Chen W, Fujikawa A, Nishimura S, et al. Brain FDG PET study of normal aging in Japanese: Effect of atrophy correction. Eur J Nucl Med Mol Imaging. 2005;32:794–805. doi: 10.1007/s00259-005-1767-2. [DOI] [PubMed] [Google Scholar]
- 19.Pichler BJ, Judenhofer MS, Catana C, Walton JH, Kneilling M, Nutt RE, et al. Performance test of an LSO-APD detector in a 7-T MRI scanner for simultaneous PET/MRI. J Nucl Med. 2006;47:639–47. [PubMed] [Google Scholar]
- 20.Delso G, Fürst S, Jakoby B, Ladebeck R, Ganter C, Nekolla SG, et al. Performance measurements of the Siemens mMR integrated whole-body PET/MR scanner. J Nucl Med. 2011;52:1914–22. doi: 10.2967/jnumed.111.092726. [DOI] [PubMed] [Google Scholar]
- 21.Catani C, van der Kouwe A, Benner T, Michel CJ, Hamm M, Fenchel M, et al. Toward Implementing an MRI-based PET attenuation-correction method for neurologic studies on the MR-PET brain prototype. J Nucl Med. 2010;51:1431–8. doi: 10.2967/jnumed.109.069112. [DOI] [PMC free article] [PubMed] [Google Scholar]
- 22.Keereman V, Fierens Y, Broux T, De Deene Y, Lonneux M, Vandenberghe S. MRI-based attenuation correction for PET/MRI using ultrashort echo time sequences. J Nucl Med. 2010;51:812–8. doi: 10.2967/jnumed.109.065425. [DOI] [PubMed] [Google Scholar]
- 23.Jena A, Taneja S, Goel R, Renjen P, Negi P. Reliability of semiquantitative 18 F-FDG PET parameters derived from simultaneous brain PET/MRI: A feasibility study. Eur J Radiol. 2014;83:1269–74. doi: 10.1016/j.ejrad.2014.04.008. [DOI] [PubMed] [Google Scholar]
- 24.Jack CR, Jr, Knopman DS, Jagust WJ, Shaw LM, Aisen PS, Weiner MW, et al. Hypothetical model of dynamic biomarkers of the Alzheimer's pathological cascade. Lancet Neurol. 2010;9:119–28. doi: 10.1016/S1474-4422(09)70299-6. [DOI] [PMC free article] [PubMed] [Google Scholar]
- 25.Scheltens PH. Structural neuroimaging of Alzheimer's disease and other dementias. Aging (Milano) 2001;13:203–9. doi: 10.1007/BF03351478. [DOI] [PubMed] [Google Scholar]
- 26.Chen Z, Zhong C. Decoding Alzheimer's disease from perturbed cerebral glucose metabolism: Implications for diagnostic and therapeutic strategies. Prog Neurobiol. 2013;108:21–43. doi: 10.1016/j.pneurobio.2013.06.004. [DOI] [PubMed] [Google Scholar]
- 27.Landau SM, Thomas BA, Thurfjell L, Schmidt M, Margolin R, Mintun M, et al. Alzheimer's Disease Neuroimaging Initiative. Amyloid PET imaging in Alzheimer's disease: A comparison of three radiotracers. Eur J Nucl Med Mol Imaging. 2014;41:1398–407. doi: 10.1007/s00259-014-2753-3. [DOI] [PMC free article] [PubMed] [Google Scholar]
- 28.Kawachi T, Ishii K, Sakamoto S, Sasaki M, Mori T, Yamashita F, et al. Comparison of the diagnostic performance of FDG-PET and VBM-MRI in very mild Alzheimer's disease. Eur J Nucl Med Mol Imaging. 2006;33:801–9. doi: 10.1007/s00259-005-0050-x. [DOI] [PubMed] [Google Scholar]
- 29.Jack CR, Jr, Lowe VJ, Senjem ML, Weigand SD, Kemp BJ, Shiung MM, et al. 11C PiB and structural MRI provide complementary information in imaging of Alzheimer's disease and amnestic mild cognitive impairment. Brain. 2008;131:665–80. doi: 10.1093/brain/awm336. [DOI] [PMC free article] [PubMed] [Google Scholar]
- 30.Karow DS, McEvoy LK, Fennema-Notestine C, Hagler DJ, Jr, Jennings RG, Brewer JB, et al. Alzheimer's Disease Neuroimaging Initiative. Relative capability of MR imaging and FDG PET to depict changes associated with prodromal and early Alzheimer disease. Radiology. 2010;256:932–42. doi: 10.1148/radiol.10091402. [DOI] [PMC free article] [PubMed] [Google Scholar]
- 31.Zhang D, Shen D. Alzheimer's Disease Neuroimaging Initiative. Predicting future clinical changes of MCI patients using longitudinal and multimodal biomarkers. PLoS One. 2012;7:e33182. doi: 10.1371/journal.pone.0033182. [DOI] [PMC free article] [PubMed] [Google Scholar]
- 32.Jack CR, Jr, Wiste HJ, Vemuri P, Weigand SD, Senjem ML, Zeng G, et al. Alzheimer's Disease Neuroimaging Initiative. Brain beta-amyloid measures and magnetic resonance imaging atrophy both predict time-to-progression from mild cognitive impairment to Alzheimer's disease. Brain. 2010;133:3336–8. doi: 10.1093/brain/awq277. [DOI] [PMC free article] [PubMed] [Google Scholar]
- 33.Albert MS, DeKosky ST, Dickson D, Dubois B, Feldman HH, Fox NC, et al. The diagnosis of mild cognitive impairment due to Alzheimer's disease: Recommendations from the National Institute on Aging-Alzheimer's Association workgroups on diagnostic guidelines for Alzheimer's disease. Alzheimers Dement. 2011;7:270–9. doi: 10.1016/j.jalz.2011.03.008. [DOI] [PMC free article] [PubMed] [Google Scholar]
- 34.Kanda T, Ishii K, Uemura T, Miyamoto N, Yoshikawa T, Kono AK, et al. Comparison of grey matter and metabolic reductions in frontotemporal dementia using FDG-PET and voxel-based morphometric MR studies. Eur J Nucl Med Mol Imaging. 2008;35:2227–34. doi: 10.1007/s00259-008-0871-5. [DOI] [PubMed] [Google Scholar]
- 35.Satishchandra P, Sinha S. Relevance of neuroimaging in the diagnosis and management of tropical neurologic disorders. Neuroimaging Clin N Am. 2011;21:737–56, vii. doi: 10.1016/j.nic.2011.07.002. [DOI] [PubMed] [Google Scholar]
- 36.Heinemann U, Gawinecka J, Schmidt C, Zerr I. Differential diagnosis of rapid progressive dementia. Eur Neurol Rev. 2010;5:21–8. [Google Scholar]
- 37.Tucker KA, Robertson KR, Lin W, Smith JK, An H, Chen Y, et al. Neuroimaging in human immunodeficiency virus infection. J Neuroimmunol. 2004;157:153–62. doi: 10.1016/j.jneuroim.2004.08.036. [DOI] [PubMed] [Google Scholar]
- 38.Ragin AB, Storey P, Cohen BA, Epstein LG, Edelman RR. Whole brain diffusion tensor imaging in HIV-associated cognitive impairment. AJNR Am J Neuroradiol. 2004;25:195–200. [PMC free article] [PubMed] [Google Scholar]
- 39.Ernst T, Jiang CS, Nakama H, Buchthal S, Chang L. Lower brain glutamate is associated with cognitive deficits in HIV patients: A new mechanism for HIV-associated neurocognitive disorder. J Magn Reson Imaging. 2010;32:1045–53. doi: 10.1002/jmri.22366. [DOI] [PMC free article] [PubMed] [Google Scholar]
- 40.Young GS, Geschwind MD, Fischbein NJ, Martindale JL, Henry RG, Liu S, et al. Diffusion-weighted and fluid-attenuated inversion recovery imaging in Creutzfeldt-Jakob disease: High sensitivity and specificity for diagnosis. AJNR Am J Neuroradiol. 2005;26:1551–62. [PMC free article] [PubMed] [Google Scholar]
- 41.Henkel K, Zerr I, Hertel A, Gratz KF, Schröter A, Tschampa HJ, et al. Positron emission tomography with [(18) F] FDG in the diagnosis of Creutzfeldt-Jakob disease (CJD) J Neurol. 2002;249:699–705. doi: 10.1007/s00415-002-0695-3. [DOI] [PubMed] [Google Scholar]
- 42.Zhao W, Zhang JT, Xing XW, Huang DH, Tian CL, Jia WQ, et al. Chinese specific characteristics of sporadic Creutzfeldt-Jakob disease: A retrospective analysis of 57 cases. PLoS One. 2013;8:e58442. doi: 10.1371/journal.pone.0058442. [DOI] [PMC free article] [PubMed] [Google Scholar]
- 43.Ortega-Cubero S, Pagola I, Luquin MR, Viteri C, Pastor P, Gállego Pérez-Larraya J, et al. Clinical and neuroimaging characteristics of 14 patients with prionopathy: A descriptive study. Neurologia. 2015;30:144–52. doi: 10.1016/j.nrl.2013.12.004. [DOI] [PubMed] [Google Scholar]
- 44.Byrnes KR, Wilson CM, Brabazon F, von Leden R, Jurgens JS, Oakes TR, et al. FDG-PET imaging in mild traumatic brain injury: A critical review. Front Neuroenergetics. 2014;5:13. doi: 10.3389/fnene.2013.00013. [DOI] [PMC free article] [PubMed] [Google Scholar]
- 45.Lu L, Wei X, Li M, Li Y, Li W. Emerging MRI and metabolic neuroimaging techniques in mild traumatic brain injury. Neurol India. 2014;62:487–91. doi: 10.4103/0028-3886.144434. [DOI] [PubMed] [Google Scholar]


