Abstract
Purpose:
To evaluate breast parenchymal density using QUANTRA software and to correlate numerical breast density values obtained from QUANTRA with ACR BI-RADS breast density categories.
Materials and Methods:
Two-view digital mammograms of 545 consecutive women (mean age - 47.7 years) were categorized visually by three independent radiologists into one of the four ACR BI-RADS categories (D1-D4). Numerical breast density values as obtained by QUANTRA software were then used to establish the cutoff values for each category using receiver operator characteristic (ROC) analysis.
Results:
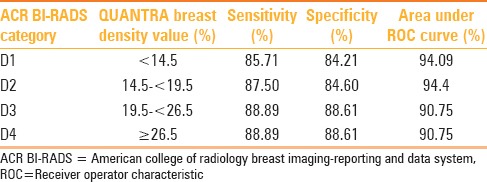
Numerical breast density values obtained by QUANTRA (range - 7-42%) were systematically lower than visual estimates. QUANTRA breast density value of less than 14.5% could accurately differentiate category D1 from the categories D2, D3, and D4 [area under curve (AUC) on ROC analysis - 94.09%, sensitivity - 85.71%, specificity - 84.21%]. QUANTRA density values of <19.5% accurately differentiated categories D1 and D2 from D3 and D4 (AUC - 94.4%, sensitivity - 87.50%, specificity - 84.60%); QUANTRA density values of <26.5% accurately differentiated categories D1, D2, and D3 from category D4 (AUC - 90.75%, sensitivity - 88.89%, specificity - 88.621%).
Conclusions:
Breast density values obtained by QUANTRA software can be used to obtain objective cutoff values for each ACR BI-RADS breast density category. Although the numerical density values obtained by QUANTRA are lower than visual estimates, they correlate well with the BI-RADS breast density categories assigned visually to the mammograms.
Keywords: BI-RADS breast density categories, breast parenchymal density, computer assessment, mammographic density, QUANTRA software
Introduction
Breast cancer is one of the most common types of cancer among women of all races and ethnic origins.[1] It is well established that increased density of breast parenchyma correlates with an increased incidence of breast cancer,[2,3,4] not only at an individual level but also at a familial level.[5,6] The most widely accepted quantitative classification of mammographic breast density was proposed in the BI-RADS system by the American College of Radiology (ACR),[7] which describes four grades-D1, D2, D3, D4 -on the basis of visual assessment. It is not possible to objectively determine the exact breast density visually, and hence, the BI-RADS category allotted to a mammogram may vary from radiologist to radiologist, especially for categories D2 and D3. It is important to objectively distinguish between these BI-RADS categories as high-density breast parenchyma may obscure small neoplasms.
Attempts have been made to replace the visual assessment by computerized assessment of breast densities.[8,9,10,11,12,13] However, breast density measurements as estimated by these methods are essentially two dimensional, not taking into account breast parenchymal thickness or exposure factors. QUANTRA is a fully automated, third-party software developed by the Hologic, Inc (USA). It is FDA approved and takes into account filter and target materials, imaging parameters as kV, mAs, and breast parenchymal thickness to calculate breast density. It automatically segments the breast region from the background and determines the energy deposited at the detector in each pixel in the image. From this calculation, it estimates the thickness of the fibroglandular tissue above each image pixel. Further, it calculates the total volume of breast and the total volume of fibroglandular tissue from the estimated breast thickness. A ratio of volume of fibroglandular tissue and total breast volume gives the value of percentage volumetric breast density. Breast density value as percentage, volume of fibroglandular tissue and the total breast volume are displayed on the operating console with a single click.
Ciatto et al. reported promising results using QUANTRA software in assessment of breast parenchymal density, although the numerical breast density values obtained by QUANTRA were systematically lower than visual assessment.[14] However, they did not propose the cutoff numerical breast density values for each ACR BI-RADS category.
In the current study, we have correlated QUANTRA software with the visual classification by radiologists for assessment of breast parenchymal density and proposed the cutoff breast density values, as obtained by QUANTRA, for each ACR BI-RADS breast density category.
Materials and Methods
The requirement for written informed consent was waived off by the institute ethical clearance committee as this study was retrospective in nature. No employee of the Hologic corporation was involved in or responsible for data collection, analysis, and information submitted for publication. Two-view (craniocaudal and mediolateral oblique views) digital mammograms of 545 women (age range 34-78 years; mean age 47.7 years) presenting to the Breast Clinic of our tertiary care institute from Jan 2011 to Feb 2012 were analyzed. Hence, 430 symptomatic women (presenting with complaints such as pain, lump, nipple discharge, or referred from outside hospitals) were included in the study. Only 115 asymptomatic women, who were aware of carcinoma breast and were self-referring for screening mammography, were included in the study.
Thus, our study population was mixed and composed of both symptomatic and disease-free subjects. The purpose of this study was twofold: To look for inter-observer agreement amongst radiologists for assessing breast parenchymal density and to evaluate how the breast parenchymal density, assessed with QUANTRA correlates with BI-RADS density categories as assigned by the radiologists. We recorded the breast density separately for each breast in every subject. The density for diseased and non-diseased breasts in every patient was recorded separately by the radiologists as well as by QUANTRA software. Moreover, we excluded mammograms with large breast masses (completely occupying more than one quadrant of the breast) from the study.
The mammograms were performed on Hologic Selenia Dimensions and were visually assessed independently by three radiologists: Radiologist 1 (SP) with 5 years of experience, Radiologist 2 (SH) with 15 years of experience, Radiologist 3 (ST) with 20 years of experience of reporting mammogram studies, each well versed with the BI-RADS system of classification of breast density. Mammograms were assigned into one of four categories: D1 (percentage of fibroglandular tissue < 25%)[Figure 1A], D2 (percentage of fibroglandular tissue 25-50%)[Figure 1B], D3 (percentage of fibroglandular tissue 50-75%)[Figure 1C], and D4) (percentage of fibroglandular tissue > 75%)[Figure 1D].
Figure 1.
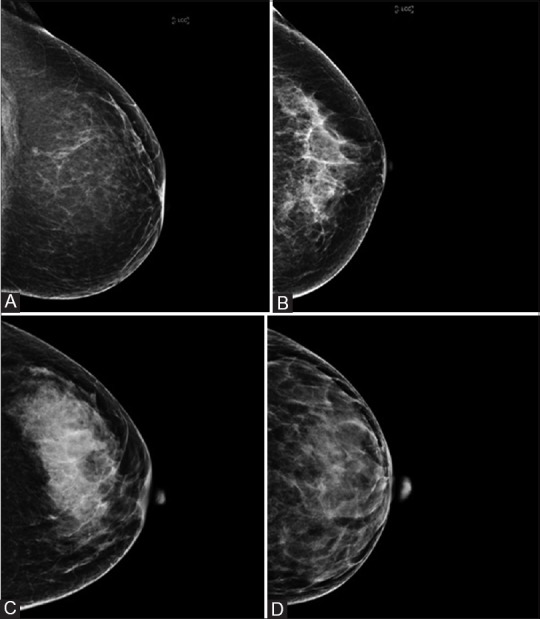
Craniocaudal views of mammograms of different patients showing ACR BI-RADS categories of breast density with QUANTRA numerical breast density values in parentheses: (A) D1(12%), (B) D2 (17%), (C) D3 (22%), and (D) D4 (33%)
Parenchymal density assessment with QUANTRA
Determination of breast parenchymal density using QUANTRA algorithm is based on a validated methodology[15] that takes into account imaging parameters as kVp, mAs, as well as target and filter materials. The software depicts density of both the breasts separately, but an average of the density of two breasts was used in this study. This percentage was correlated with the ACR breast density grade assigned by the radiologists visually.
Statistical analysis
Kappa statistics was used to calculate inter-observer agreement between the radiologists across all breast density categories (D1-D4). Conventionally, a kappa value of 0.00-0.20 indicates minimal agreement, 0.21-0.40 indicates fair agreement, 0.41-0.60 indicates moderate agreement, 0.61-0.80 indicates substantial agreement, and 0.81-1.00 indicates almost perfect agreement.
Receiver operator characteristic (ROC) analysis with Stata 13 software was used to arrive at cutoff values of numerical breast density percentage, as determined by QUANTRA, for each ACR BI-RADS category. We also tried to separate mammograms into non-dense (categories D1 and D2) and dense (categories D3 and D4), as suggested by Ciatto et al.,[14] and establish a cutoff breast density percentage value for this purpose.
Furthermore, for the purpose of internal validation of the study, we randomly divided the data into two sets: A test data set of 400 mammograms and a validation data set of 145 mammograms. Patients in validation data set were assigned BI-RADS breast density categories according to the cutoff values obtained from the test data set. These categories were then correlated with the categories assigned visually by radiologists in the same patients.
Results
Table 1 depicts the distribution of visual mammographic density across ACR BI-RADS categories as determined by three radiologists. The inter-observer agreement for the three radiologists was variable: Kappa value for readers A (SP) and B (ST) was 0.6314 (substantial agreement), for readers B (ST) and C (SH) was 0.5162 (moderate agreement), and for readers A and C was 0.4085 (moderate agreement).
Table 1.
Distribution of visual mammographic density across ACR BI-RADS categories as determined by three radiologists

QUANTRA breast density values were obtained for all patients, and these fell in the range of 7-42%. QUANTRA breast density cutoff values established for various ACR BI-RADS categories using ROC analysis are depicted in Table 2 and Graphs 1–3. A QUANTRA density cutoff value of less than 14.5% identified patients in category D1 with a sensitivity of 85.71% and specificity of 84.21% (AUC 94.09%; confidence interval: 92.318, 95.867). QUANTRA density value less than 19.5% separated patients in categories D1 and D2 from patients in categories D3 and D4 with a sensitivity of 87.50% and specificity of 84.60% (AUC 94.4%; confidence interval: 92.2, 96.6). QUANTRA density values less than 26.5% accurately differentiated patients in categories D1, D2, and D3 from category D4 patients with a sensitivity of 88.89% and specificity of 88.61% (AUC 90.75%; confidence interval: 83.5, 97.9). Using a QUANTRA breast density value of less than 19.5%, mammograms could be classified as non-dense (categories D1 and D2) with a sensitivity of 87.50% and specificity of 84.60%.
Table 2.
Breast density cutoff values for each ACR BI-RADS category as determined using receiver operator characteristic analysis
Graph 1.
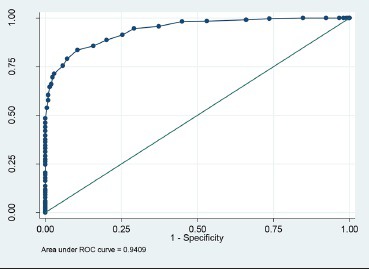
ROC analysis for QUANTRA breast density values less than 14.5%
Graph 3.
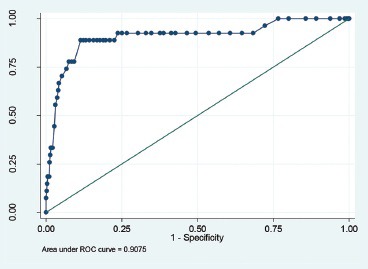
ROC analysis for QUANTRA breast density values less than 26.5%
Graph 2.
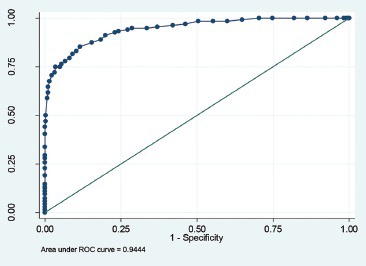
ROC analysis for QUANTRA breast density values less than 19.5%
On applying ROC analysis to the test data set of 400 patients, we again reached the cutoff breast density value of 19.5% to separate the mammograms into dense and non-dense. Applying this value to the validation data set, we were able to separate the mammograms into dense and non-dense categories with a sensitivity of 87.5% and specificity of 88.68%[Table 3].
Table 3.
Separation of mammograms into non-dense (ACR BI-RADS categories D1 and D2) and dense (ACR BI-RADS categories D3 and D4) categories using a QUANTRA value of 19.5%, as derived from test data set and applied to validation data set

Discussion
Mammographic breast density is the percentage of mammogram occupied by radiologically dense breast tissue. The role of mammographic breast density as a risk factor for carcinoma breast has been a matter of much speculation, intense research, as well as heated debates amongst breast radiologists and surgeons alike, ever since Wolfe first described the breast parenchymal patterns in 1976.[3] A high mammographic breast density may not only obscure an early cancer, but is itself an independent risk factor for carcinoma breast, carrying a relative risk that comes behind only age and BRCA status; and it carries the highest attributable risk amongst all risk factors, because it is very common.[2,16,17,18,19,20,21] An odds ratio of 4-6 has been reported for development of carcinoma breast in women with extremely dense breasts, irrespective of age, menopausal status, and use of hormone replacement therapy.[17,21] Hence, modified screening protocols [more frequent screening, screening with USG and magnetic resonance imaging (MRI)] may be required for women with a higher breast density. Objective measurement of breast density can not only help develop individualised screeing protocols, but also better individual breast cancer risk prediction models. Breast density may also be used as a surrogate marker in breast cancer prevention trials. Therefore, it is it is of vital importance that the radiologist records mammographic breast density in a report, and also educates the patient about the need for any additional investigations (USG or MRI) in women with dense breasts. The state of Connecticut in USA has passed a legislation that makes it mandatory for the radiologist to report mammographic density and to communicate its implications to the patient.[22] Although it is premature to speculate, but this legislation may be a harbinger of a paradigm shift in breast imaging with emphasis on individualised imaging and management protocols depending on the patient's breast density.
In an attempt to objectivize reporting of breast density, the ACR introduced the quantitative system of reporting mammographic density in 2004.[7] However, this assessment is subjective and studies have shown significant variations in inter-observer agreement with kappa values showing minimal to substantial agreement.[23,24] In our study, the variation in inter-observer agreement was significant with kappa values showing only moderate agreement between radiologists A and C, and radiologists B and C; there was substantial inter-observer agreement between radiologists A and B.
Earlier attempts to determine breast density made use of computer-assisted planimetry in one form or the other.[25,26,27] More recently, computer-assisted planimetry has been applied on digital mammograms whereby dense and fatty areas in the mammogram are separated either manually[28,29] or with segmentation techniques.[8,10,11,12,13] However, there are some important limitations in these methods. They measure breast density in a binary fashion only, separating the mammographic densities into either fat or breast parenchyma. They do not take into account exposure values, half value layer details, and thickness of the breast parenchyma. Hence, their accuracy has been questioned.[30] QUANTRA overcomes these limitations as it takes into account kVp, mAs, target and filter materials, and energy deposited at the image detector in each pixel (as a surrogate for the thickness of breast tissue traversed) to calculate the volume of the entire breast, fibroglandular tissue, and the resultant mammographic density.
We found numerical breast density as measured by QUANTRA in the range of 7-42% in 545 mammograms. These values are lower compared to those obtained by visual classification, and are similar to the results obtained with QUANTRA in earlier studies.[14,31,32] Ciatto et al. (418 patients) reported that a QUANTRA density value of less than 22% is the best cutoff value to separate mammograms into dense (categories D3 and D4) and non-dense (categories D1 and D2),[14] whereas Rafferty et al. (264 patients) reported 13% as the best cutoff value for this purpose.[31] Our results were closer to those of Ciatto et al. and we found that a QUANTRA cutoff value of 19.5% was the most accurate in classifying mammograms into dense and non-dense. We were able to establish the cutoff values for each BI-RADS category and assign mammograms to appropriate categories using QUANTRA values.
Conclusion
QUANTRA is a robust volumetric computerized method available for measuring breast density and is easy to use. Breast density values as obtained by QUANTRA are systematically lower than those obtained by subjective visual assessment. We were able to establish cutoff breast density values as obtained by QUANTRA, to assign ACR BI-RADS categories to mammograms. This assessment correlated well with the visual assessment by radiologists. More studies are required to compare evaluation of breast parenchymal density using QUANTRA to validate the reliability and application of this method in routine clinical practice.
Acknowledgements
We thank Dr. Pooja Abbey, Assistant Professor, Lady Hardinge Medical College, New Delhi, India, for reviewing the manuscript and providing valuable inputs.
Footnotes
Source of Support: Nil
Conflict of Interest: No.
References
- 1.Siegel R, Naishadham D, Jemal A. Cancer statistics, 2013. CA Cancer J Clin. 2013;63:11–30. doi: 10.3322/caac.21166. [DOI] [PubMed] [Google Scholar]
- 2.Harvey JA, Bovbjerg VE. Quantitative assessment of mammographic breast density: Relationship with breast cancer risk. Radiology. 2004;230:29–41. doi: 10.1148/radiol.2301020870. [DOI] [PubMed] [Google Scholar]
- 3.Wolfe JN. Risk for breast cancer development determined by mammographic parenchymal pattern. Cancer. 1976;37:2486–92. doi: 10.1002/1097-0142(197605)37:5<2486::aid-cncr2820370542>3.0.co;2-8. [DOI] [PubMed] [Google Scholar]
- 4.Ciatto S, Zappa M. A prospective study of the value of mammographic patterns as indicators of breast cancer risk in a screening experience. Eur J Radiol. 1993;17:122–5. doi: 10.1016/0720-048x(93)90048-r. [DOI] [PubMed] [Google Scholar]
- 5.Boyd NF, Dite GS, Stone J, Gunasekara A, English DR, McCredie MR, et al. Heritability of mammographic density, a risk factorfor breast cancer. New Engl J Med. 2002;347:886–94. doi: 10.1056/NEJMoa013390. [DOI] [PubMed] [Google Scholar]
- 6.Chen Z, Wuy AH, Gauderman WJ, Bernstein L, Ma H, Pike MC, et al. Does mammographic density reflect ethnicdifferences in breast cancer incidence rates? Am J Epidemiol. 2004;159:140–7. doi: 10.1093/aje/kwh028. [DOI] [PubMed] [Google Scholar]
- 7.Sickles EA, D’Orsi CJ, Bassett LW, et al. ACR BI-RADSR Atlas, Breast Imaging Reporting and Data System. Reston, VA: American College of Radiology; 2013. ACR BI-RADS) Mammography. [Google Scholar]
- 8.Zhou C, Chan HP, Petrick N, Helvie MA, Goodsitt MM, Sahiner B, et al. Computerized image analysis: Estimation of breast density on mammograms. Med Phys. 2001;28:1056–69. doi: 10.1118/1.1376640. [DOI] [PubMed] [Google Scholar]
- 9.Fenton JJ, Taplin SH, Carney PA, Abraham L, Sickles EA, D’Orsi C, et al. Influence of computer-aided detection on performance of screeningmammography. N Engl J Med. 2007;356:1399–409. doi: 10.1056/NEJMoa066099. [DOI] [PMC free article] [PubMed] [Google Scholar]
- 10.Karssemeijer N. Automated classification of parenchymal patterns in mammograms. Phys Med Biol. 1998;43:365–78. doi: 10.1088/0031-9155/43/2/011. [DOI] [PubMed] [Google Scholar]
- 11.Sivaramakrishna R, Obuchowski NA, Chilcote WA, Powell KA. Automatic segmentation of mammographic density. Acad Radiol. 2001;8:250–6. doi: 10.1016/S1076-6332(03)80534-2. [DOI] [PubMed] [Google Scholar]
- 12.Chang Y, Wang X, Hardesty LA, Chang TS, Poller WR, Good WF, et al. Computerized assessment of tissue composition on digitized mammograms. Acad Radiol. 2002;9:899–905. doi: 10.1016/s1076-6332(03)80459-2. [DOI] [PubMed] [Google Scholar]
- 13.Martin KE, Helvie MA, Zhou C, Roubidoux MA, Bailey JE, Paramagul C, et al. Mammographic density measured with quantitative computer-aided method: Comparison with radiologists’ estimates and BI-RADS categories. Radiology. 2006;240:656–65. doi: 10.1148/radiol.2402041947. [DOI] [PubMed] [Google Scholar]
- 14.Ciatto S, Bernardi D, Calabrese M, Durando M, Gentilini MA, Mariscotti G, et al. A first evaluation of breast radiological density assessment by QUANTRA software as compared to visual classification. Breast. 2012;21:503–6. doi: 10.1016/j.breast.2012.01.005. [DOI] [PubMed] [Google Scholar]
- 15.Hartman K, Highnam R, Warren R, Jackson V. Volumetric assessment of breast tissue composition from FFDM imagesPaper presented at: IWDM 2008. Proceedings of the International Workshop on Digital Mammography. 2008;5116:33–9. Tucson USA. [Google Scholar]
- 16.Byrne C. Studying mammographic density: Implications for understanding breast cancer. J Natl Cancer Inst. 1997;89:531–3. doi: 10.1093/jnci/89.8.531. [DOI] [PubMed] [Google Scholar]
- 17.Boyd NF, Guo H, Martin LJ, Sun L, Stone J, Fishell E, et al. Mammographic density and the risk and detection of breast cancer. N Engl J Med. 2007;356:227–36. doi: 10.1056/NEJMoa062790. [DOI] [PubMed] [Google Scholar]
- 18.McCormack VA, dos Santos Silva I. Breast density and parenchymal patterns as markers of breast cancer risk: A meta-analysis. Cancer Epidemiol Biomarkers Prev. 2006;15:1159–69. doi: 10.1158/1055-9965.EPI-06-0034. [DOI] [PubMed] [Google Scholar]
- 19.Boyd NF, Rommens JM, Vogt K, Lee V, Hopper JL, Yaffe MJ, et al. Mammographic breast density as an intermediate phenotype for breast cancer. Lancet Oncol. 2005;6:798–808. doi: 10.1016/S1470-2045(05)70390-9. [DOI] [PubMed] [Google Scholar]
- 20.Veronesi U, Boyle P, Goldhirsch A, Orecchia R, Viale G. Breast cancer. Lancet. 2005;365:1727–41. doi: 10.1016/S0140-6736(05)66546-4. [DOI] [PubMed] [Google Scholar]
- 21.Mandelson MT, Oestreicher N, Porter PL, White D, Finder CA, Taplin SH, et al. Breast density as a predictor of mammographic detection: Comparison of interval- and screen-detected cancers. J Natl Cancer Inst. 2000;92:1081–7. doi: 10.1093/jnci/92.13.1081. [DOI] [PubMed] [Google Scholar]
- 22.Hooley RJ, Greenberg KL, Stackhouse RM, Geisel JL, Butler RS, Philpotts LE. Screening US in patients with mammographically dense breasts: Initial experience with Connecticut Public Act 09-41. Radiology. 2012;265:59–69. doi: 10.1148/radiol.12120621. [DOI] [PubMed] [Google Scholar]
- 23.Ciatto S, Houssami N, Apruzzese A, Bassetti E, Brancato B, Carozzi F, et al. Categorizing breast mammographic density: Intra- and inter-observer reproducibility of BI-RADS density categories. Breast. 2005;14:269–75. doi: 10.1016/j.breast.2004.12.004. [DOI] [PubMed] [Google Scholar]
- 24.Spayne MC, Gard CC, Skelly J, Miglioretti DL, Vacek PM, Geller BM. Reproducibility of BI-RADS breast density measures among community radiologists: A prospective cohort study. Breast J. 2012;18:326–33. doi: 10.1111/j.1524-4741.2012.01250.x. [DOI] [PMC free article] [PubMed] [Google Scholar]
- 25.Wolfe JN, Saftlas AF, Salane M. Mammographic parenchymal patterns and quantitative evaluation of mammographic densities: A case-control study. AJR Am J Roentgenol. 1987;148:1087–92. doi: 10.2214/ajr.148.6.1087. [DOI] [PubMed] [Google Scholar]
- 26.Saftlas AF, Hoover RN, Brinton LA, Szklo M, Olson DR, Salane M, et al. Mammographic densities and risk of breast cancer. Cancer. 1991;67:2833–8. doi: 10.1002/1097-0142(19910601)67:11<2833::aid-cncr2820671121>3.0.co;2-u. [DOI] [PubMed] [Google Scholar]
- 27.Kato I, Beinart C, Bleich A, Su S, Kim M, Toniolo PG. A nested case-control study of mammographic patterns, breast volume, and breast cancer (New York City, NY, United States) Cancer Causes Control. 1995;6:431–8. doi: 10.1007/BF00052183. [DOI] [PubMed] [Google Scholar]
- 28.Byng JW, Yaffe MJ, Jong RA, Shumak RS, Lockwood GA, Tritchler DL, et al. Analysis of mammographic density and breast cancer risk for digitized mammograms. Radiographics. 1998;18:1587–98. doi: 10.1148/radiographics.18.6.9821201. [DOI] [PubMed] [Google Scholar]
- 29.Freedman M, San Martin J, O’Gorman J, Eckert S, Lippman ME, Lo SC, et al. Digitized mammography: A clinicaltrial of postmenopausal women randomly assigned to receive raloxifene, estrogen, or placebo. J Natl Cancer Inst. 2001;93:51–6. doi: 10.1093/jnci/93.1.51. [DOI] [PubMed] [Google Scholar]
- 30.Kopans DB. Basic physics and doubts about relationship between mammographically determined tissue density and breast cancer risk. Radiology. 2008;246:348–53. doi: 10.1148/radiol.2461070309. [DOI] [PubMed] [Google Scholar]
- 31.Rafferty E, Smith A, Niklason L. Chicago, USA: 2009. Dec 2, Comparison of Three Methods of EstimatingBreast Density: BI-RADS Density Scores Using Full field Digital Mammography, BI-RADS Density Scores Using Breast Tomosynthesis, and Volumetric Breast Density. Paper presented at: RSNA 2009. SSM01-04, 15:30-15:40. [Google Scholar]
- 32.Tuncbilek N, Sezer A, Uğur U, Ulaş U, Urut U, Coşar R, et al. Izmir, Turkey: 2009. Qualitative and quantitative analysis of fiquantitative tissue in the digital envi ronment. Paper presented at: National Conference of Breast Disease 2009. 10th National Congress of Breast Diseases. [Google Scholar]


