Abstract
Objective:
To distinguish between benign and malignant breast lesions on the basis of their signal intensity on diffusion-weighted imaging and their apparent diffusion coefficient (ADC) values at 3 T MRI, along with histopathological correlation.
Materials and Methods:
A retrospective analysis of 500 patients who underwent 3 T MRI between August 2011 and May 2013 was done. Of these, 226 patients with 232 lesions that were proved by histopathology were included in the study. ADC values were calculated at b values of 0, 1000, and 1500 s/mm2 after identification on contrast-enhanced images and appropriate ROI(Region of interest) placement. ADC value and histopathology correlation was analyzed.
Results:
Out of 232 lesions, 168 lesions were histologically malignant and 64 were histologically benign. With an ADC cut-off value of 1.1 ×10⁻³ mm2/s for malignant lesions, a sensitivity of 92.80% and specificity of 80.23% was obtained. Out of 12/232 false-negative lesions, 6 were mucinous carcinoma in which a high ADC value of 1.8-1.9 ×10⁻³ mm2/s was obtained. Purely DCIS (Ductal carcinoma in situ) lesions presenting as non-mass-like enhancement had a high ADC value of 1.2-1.5 ×10⁻³ mm2/s, thereby reducing specificity.
Conclusion:
Diffusion-weighted Imaging and quantitative assessment by ADC values may act as an effective parameter in increasing the diagnostic accuracy and specificity of contrast-enhanced breast MRI in characterization of breast lesions.
Keywords: Apparent diffusion coefficient, breast cancer, breast imaging, diffusion-weighted imaging
Introduction
Dynamic contrast-enhanced breast MR imaging has a high sensitivity in detection of breast tumors, but has a relatively low specificity because of multiple overlapping features between benign and malignant lesions.[1] While morphological features of the lesion such as shape, margins, and internal architecture along with kinetic enhancement analysis help in distinguishing benign and malignant lesions, diffusion-weighted imaging (DWI) provides valuable qualitative and quantitative data regarding structural tissue changes at a cellular level, and thus further helps in distinguishing between benign and malignant lesions, especially those which are ambiguous on standard MR imaging protocols.[2,3,4] This is particularly useful in cases where there is discordance between the morphological findings and enhancement kinetics of the lesions, wherein low apparent diffusion coefficient (ADC) points toward the malignant nature of the lesion. Also, in patients with dense fibroadenosis and ACR (American College of Radiology) Category 4 breasts, DWI helps in increasing the specificity in identification of suspicious lesion after better signal suppression from breast parenchyma at high b value.[5]
DWI derives its image contrast from differences in the motion of water molecules between tissues, which depends on tissue cellularity and presence of intact cell membranes.[6,7] Tissues with high cellular density and intact cell membranes have restricted diffusion seen as high signal intensity on DWI.[8] The “b” value refers to the strength of the diffusion sensitizing gradient. ADC maps are generated from diffusion images obtained at different b values and application of greater number of b values improves the accuracy of the calculated ADC.[9,10] There is a linear inverse correlation between ADC values and tumor cellularity. The ADC value of free water molecules at 37°C is 3.0 × 10⁻³ mm2/s and that of normal breast parenchyma is 1.48 × 10⁻³ mm2/s[11,12] [Figure 1].
Figure 1 (A and B).
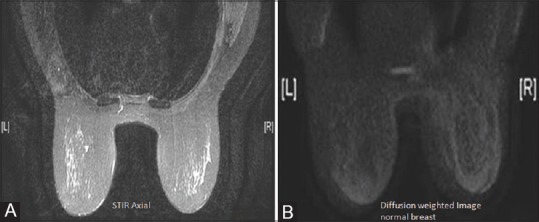
Normal breast - ADC value of normal breast parenchyma is approx (A) 1.48 × 10⁻³ mm2/sec (B)
The visual assessment by high b value imaging and T2-weighted imaging data and the quantitative assessment by ADC values together help in improving the specificity.[13]
DWI has also been used for assessing the response to neoadjuvant chemotherapy in diagnosed cases of breast cancer. DWI with its ability to detect changes at the cellular level helps in the assessment of metabolic response to chemotherapy due to changes in the ADC value occurring much before the change in the tumor size occurs.[14,15]
Increased SNR (Signal-to-noise ratio) at 3 T allows reduction in the imaging time as well as use of higher b values, which help in better evaluation of in situ disease.[1] With good spatial resolution at 3 T, tumors less than 10 mm size are better visualized.[16] Parallel imaging also works better at 3 T. However, 3 T has its inherent disadvantages in the form of increased geometric image distortion and increased chemical shift and susceptibility artifacts.[16,17]
Materials and Methods
This is a retrospective study conducted in the Department of Radiology after obtaining approval from the institutional review board.
Patients
Five hundred patients underwent MR mammogram in our hospital between August 2011 and May 2013 for various palpable and non-palpable abnormalities. Bilateral breast MRI was performed on GE 750 pro 3 T MRI system with a dedicated 8-channel bilateral breast coil using the same protocol. Of these 500 patients, 226 patients (between 28 and 71 years of age) were selected for our study, whose lesions were subsequently proven as benign or malignant on further histopathological examination. Also, 232 lesions were detected in these 226 patients, with 6 patients having more than one pathologically proven lesion. Patients with normal mammogram and with simple cysts were excluded from the study. Also, patients whose results could not be proven on histopathology were excluded from the study.
MRI sequences
Breast MRI was performed on 3 T GE Healthcare System 750 pro using a dedicated 8-channel dedicated breast coil with patients in prone position. Pre-contrast T2W IDEAL and T1W sequences were obtained in axial plane. DWI was obtained in axial planes at b values of 0, 1000, and 1500 s/mm2. The b value of 1500 was used to reduce the T2 shine-through effect. The parameters used were: TR/TE 5200/84, section thickness 3 mm, inter-slice gap 0, field of view (FOV) 40 × 40, and matrix size of 192 × 256. Subsequently, dynamic contrast-enhanced sequences were obtained after the bolus injection of 10 ml DOTAREM (Guerbet) at the rate of 2.5 ml/s, followed by saline flush. Dynamic parallel imaging was done in seven phases of 1 min each. Automatic subtracted images were obtained. ADC maps were then generated using the GE workstation from DWI obtained at b values of 0, 1000, and 1500 s/mm2 followed by sagittal sequence. Kinetic analysis of the enhancing component of the lesion was done with the available software.
Image interpretation
ADC maps were obtained on GE workstation. Lesion identification was done on post-contrast subtracted sequences. ROI (Region of interest) was placed manually on the corresponding lesion on diffusion images and extended on the ADC maps. ROI did not include hemorrhagic and necrotic portions. There was no fixed size of ROI taken, and it varied with the size of the lesion and the size of the part of the lesion showing restricted diffusion. In non–mass-like enhancement, the largest area of enhancement was identified and then ROI was placed on the largest signal area on the corresponding lesion in DWI. The ADC values were calculated on b value of both 1000 and 1500 s/mm2. If the ADC value varied between b values of 1000 and 1500, the ADC value at b value of 1500 was taken into consideration. In the lesions showing varied ADC values, the lowest ADC value within the lesions was taken into consideration.
Statistical analysis
The mean ADC values of benign and malignant lesions were calculated. ADC values of the benign and malignant breast lesions were compared with each other using Mann-Whitney test.
A feasible cut-off value of ADC for the differentiation of malignant and benign lesions was found by using receiver operating characteristic (ROC) analysis. Breast lesions that had an ADC value equal to or less than the given cut-off value were considered malignant and lesions that had an ADC value more than the given cut-off value were considered benign.
The ADC values of various lesions were compared with their histopathology.
Results
Out of 232 lesions, 168 lesions were histologically malignant and 64 were histologically benign [Figure 2]. The malignant lesions identified were: Infiltrating ductal carcinoma (IDC; n = 150), infiltrating lobular carcinoma (ILC; n = 2); medullary carcinoma (MeC; n = 2), mucinous carcinoma (MuC; n = 6), DCIS (n = 6), adenoid cystic carcinoma (AdC; n = 1), and malignant phylloides (n = 1) [Figure 3]. The benign lesions were: Fibroadenoma (FA; n = 27), benign proliferative lesion (BBD; n = 19), mastitis (n = 5), fat necrosis (n = 1), intraductal papilloma (n = 9), and benign phylloides (n = 3) [Figure 4]. Significant difference was observed between the ADC values of malignant and benign lesions with a P value of <0.05. The mean ADC value of malignant lesions (IDC) was 0.89 × 10⁻³ mm2/s [Figures 5 and 6] and that of benign lesions was 1.35 × 10⁻³ mm2/s. Also, significant difference was found between the mean ADC value of pure MuC [Figure 7] and those of benign lesions [Figure 8] and other malignant lesions like invasive ductal carcinomas and MeC. No significant difference was found in the ADC values of other histological types of malignancies [Figure 9].
Figure 2.
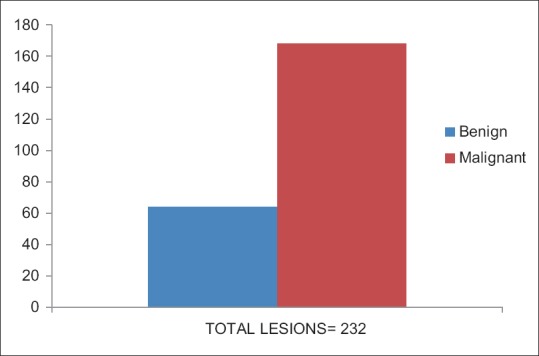
Chart depicting histopathological outcome of lesions. A total of 232 lesions were sampled out of which 168 were malignant and 64 turned out to be benign
Figure 3.
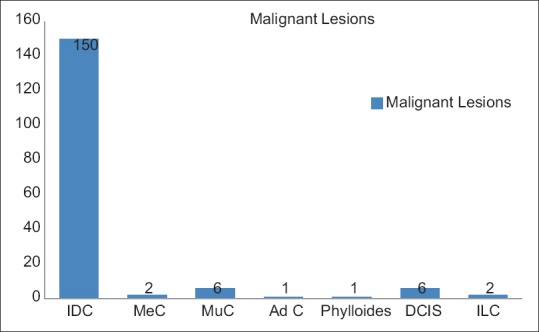
Distribution of malignant lesions. The vast majority of the malignant lesions in the study were infiltrative ductal carcinoma (89%)
Figure 4.
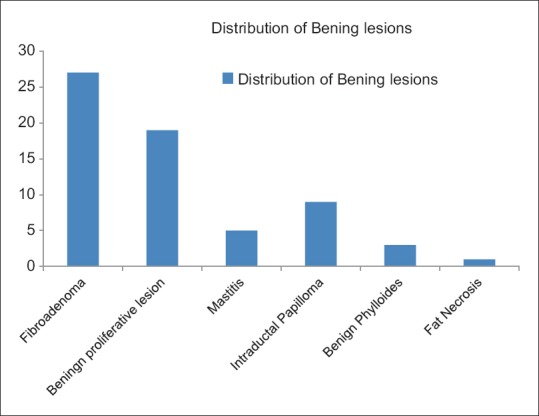
Amongst the benign lesions 42% lesions were fibro adenomas while 31% were benign proliferative lesions
Figure 5 (A-D).
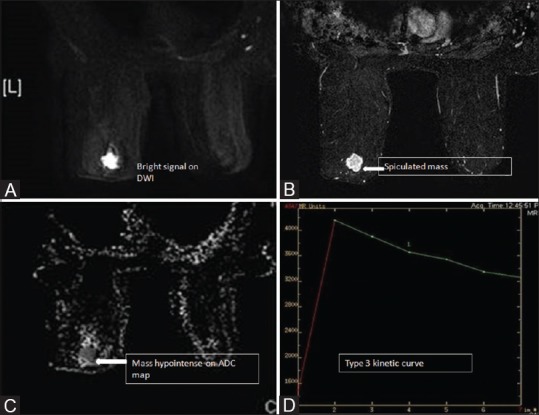
Case of IDC. Restricted diffusion seen within the spiculated mass lesion (A and B) with ADC of 0.8 × 10− 3 mm2/sec (C). DCE-MR shows Type 3 kinetics (D)
Figure 6 (A-D).
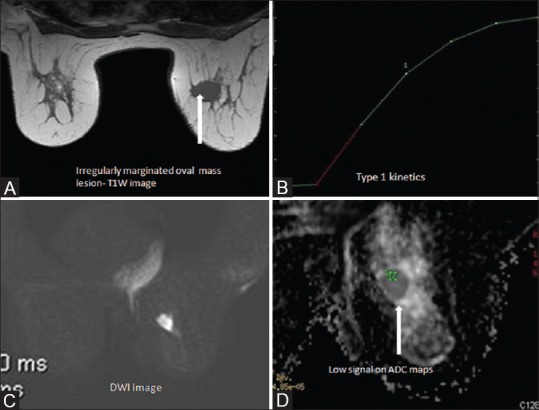
Malignant morphology (A) and benign kinetics (B) in case of IDC. Restricted diffusion on DWI (C) with low ADC of 0.85 × 10− 3 mm2/sec (D)
Figure 7 (A-F).
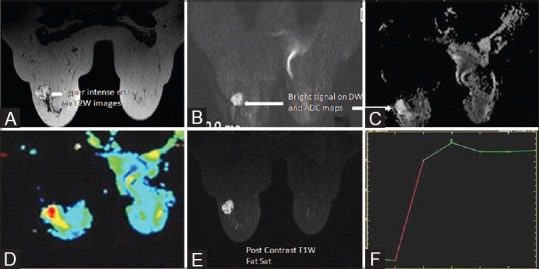
Invasive mucinous carcinoma seen as hyperintense lesion on T2W images (A). The lesion is bright on DWI and gray scale ADC maps (B and C) and shows high ADC values as seen on the color map (D) Post contrast reveals enhancing lesion with plateau kinetics (E and F). ADC values within the lesion were approx. 1.9 ×10⁻³ mm2/sec
Figure 8 (A-C).
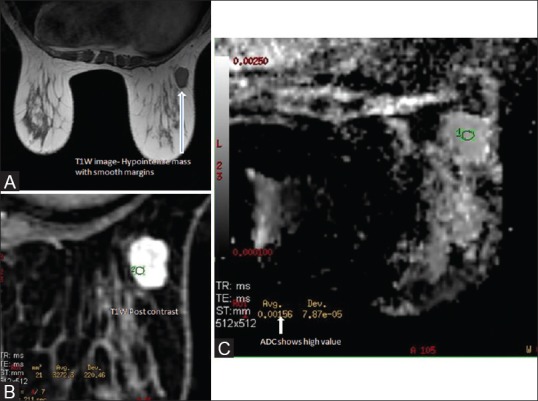
Case of fibroadenoma. Well defined hypointense lesion seen on T1W images (A) On post contrast scan, the lesion shows homogenous enhancement with non enhancing internal septations (B) ADC value of approx. 1.5 × 10− 3 mm2/sec was observed (C)
Figure 9 (A-E).
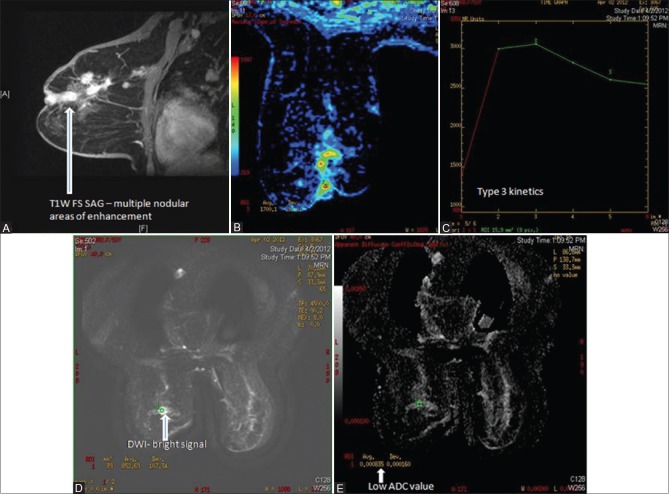
Linear and nodular areas of enhancement in case of infiltrating lobular carcinoma (A and B) The lesions show Type 3 kinetics (C) Approx. ADC values in the areas showing restricted Diffusion is 0.8 ×10⁻³ mm2/sec (D and E)
With an ADC cut-off value of 1.1 × 10⁻³ mm2/s, a sensitivity of 92.80% and specificity of 80.23% was obtained. Increasing the cut-off to 1.2 × 10⁻³ mm2/s increases the sensitivity to 95.5% with almost equal specificity of 80% but increases the NPV (Negative predictive value).
There was no statistically significant difference found between the ADC values at b value of 1000 and 1500.
Out of 12/232 false-negative lesions, 6 were MuC in which a very high ADC value of 1.8-1.9 × 10⁻³ mm2/s was observed, which was contributed by the increased extracellular space in these lesions and the rich mucin content as compared to that in densely packed tumor cells of IDC. Other false-negative lesions were non–mass-forming DCIS presenting as non–mass-like enhancement with a high ADC value of 1.2-1.5 × 10⁻³ mm2/s. These lesions thereby reduced specificity. The ADC value in adenoid cystic carcinoma was also seen to be higher than that of intraductal carcinoma (Not otherwise specified NOS) and was 1.1 × 10⁻³ mm2/s.
Of the 8/232 false-positive lesions, 5 cases were of granulomatous mastitis [Figure 10], 1 case was of fat necrosis, and 2 cases were cellular fibroadenomas.
Figure 10 (A-C).
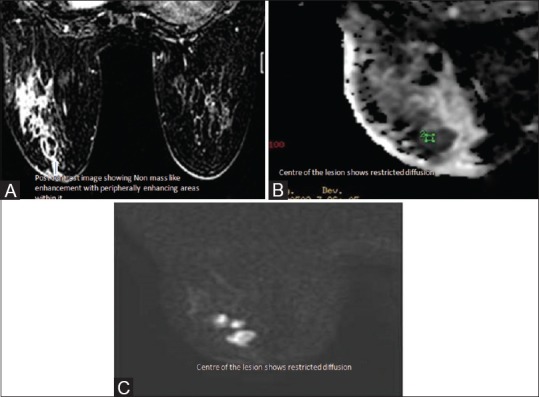
Rounded peripherally enhancing lesion with surrounding breast edema and enhancement (A) in a known case of granulomatous lobular mastitis. The centre of the lesion had extremely low ADC value of 0.4-0.5 × 10− 3 mm2/sec (B and C)
Discussion
In our study, we calculated the mean ADC value for the malignant and benign lesions and found that there was a statistically significant difference between the ADC values of benign and malignant breast lesions. The mean ADC value of benign lesions was calculated to be 1.35 × 10⁻³ mm2/s and that of malignant lesions 0.89 × 10⁻³ mm2/s. These values are well in correlation with the results of Woodhams et al.,[18,19] in whose study the mean ADC value of malignant lesions was 1.22 ± 0.31 × 10⁻³ mm2/s, of benign lesions was 1.67 ± 0.54 × 10⁻³ mm2/s, and of normal tissues was 2.09 ± 0.27 × 10⁻³ mm2/s. In the study by Sinha et al.,[20] the mean ADC of malignant lesions was calculated to be 1.6 × 10⁻³ mm2/s and that of benign lesions was 2 × 10⁻³ mm2/s. This difference can be explained by lower b values (0-289.7 s/mm2) used by them, while we used b values of 1000 and 1500. ADC values are higher at lower b values (ADC = 1/b2 - b1 × In [IS (b1)/IS (b2)]), although as stated earlier, we did not find statistically significant difference in ADC value at 1000 and 1500.
In our study, when we took an ADC cut-off value of 1.1 × 10⁻³ mm2/s for malignant lesions, a sensitivity of 92.80% and specificity of 80.23% was obtained. Increasing the cut-off value to 1.2 × 10⁻³ mm2/s, a sensitivity of 95.54% and specificity of 80.23% was obtained. In comparison with other studies [Table 1], Rubesova et al.[21] showed that the threshold between malignant and benign lesions for obtaining highest sensitivity and specificity (both 86%) was around 1.13 ± 0.10 × 10⁻³ mm2/s. For a lower threshold of 0.95 ± 0.10 × 10⁻³ mm2/s, specificity was 100% but the sensitivity was very low. In a recently published study by Quinghua Min et al.,[22] with the threshold ADC value being 1.23 × 10⁻³ mm2/s at b value of 800, DWI-MRI achieved a sensitivity of 82.8%, specificity of 90.0%, and positive predictive value of 92.3% for differentiating benign and malignant lesions.
Table 1.
Comparison of sensitivity and specificity in different studies with specified ADC cut off value
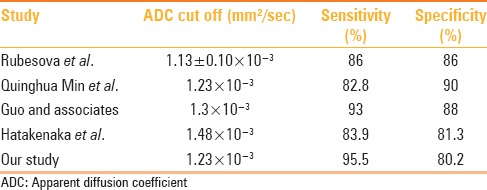
Guo and associates[23] took threshold of ADC as 1.3 × 10⁻³ mm2/s or less to label a lesion as malignant and reported a sensitivity of 93% and specificity of 88%, while Hatakenaka et al.[23] achieved a sensitivity of 83.9% and specificity of 81.3% when they took the cut-off value as 1.48 × 10⁻³ mm2/s. Lower specificity in our study was due to six cases of pure MuC, five cases of pure non–mass-forming DCIS, one case of AdC, and also five cases of granulomatous mastitis. The mean ADC values for malignant and benign lesions were, however, the same as reported in previous studies.
Ei Khoule et al.[24] showed that adding normalized ADCs to the dynamic contrast-enhanced MR data improved the diagnostic performance of MR imaging. In their study, the area under the ROC curve improved from 0.89 to 0.98 and the false-positive rate decreased from 36% to 24%. In our study also, one of the lesions showed type 1 enhancement kinetics on DCE-MR; however, it had low ADC of 0.9 × 10⁻³ mm2/s and microlobulated margins, based on which the lesion was categorized as BIRADS 4c on MRI and was subsequently proven as IDC on histopathology [Figure 6].
ADC values are affected by both diffusion as well as perfusion. The effect of perfusion decreases with increase in the b values. Also, the diffusion of water molecules is strongly influenced by cellularity of the lesion and membrane permeability between intra- and extracellular compartments. Therefore, as reported by Buadu and associates[25] that malignant lesions have a higher microvessel count than benign lesions and may show higher ADC values, the lower ADC values obtained in malignant lesions show that high cellular density has opposite and increased effect on diffusion of water molecules than perfusion.[25] Hatakenaka et al.[26] also studied the correlation between ADC values and tumor cellularity and concluded that there was an inverse correlation between ADC and tumor cellularity.
MuC showed a very high ADC value of approximately 1.8 × 10⁻³ mm2/s due to the increased extracellular space facilitating free diffusion of water molecules. This was also shown in the study by Woodhams.[27] ADC values in MuC were found to be even higher than those of FA, may be because of the relatively free motion of water molecules in mucin pool than in the interstitium of FA. The high extracellular water content in MuC also causes a very high signal intensity of these lesions on T2W images, and thus aids in diagnosis along with a high ADC. However, the mixed MuCs have low ADC values due to increased cellularity. No difference was seen in the ADC value of invasive ductal lobular and medullary carcinomas.
In cases of mastitis, very low ADC values of approximately 0.4–0.5 × 10⁻³ mm2/s were observed [Figure 10]. In these cases, clinical history along with post-contrast images were helpful in deriving the diagnosis. The patient generally presents with some history of pain and low ADC was seen in the non-enhancing parts of the lesions, which indicated inspissated contents/pus, while in necrotic tumors, the central part shows high ADC.
Non–mass-forming DCIS are a challenge. Placement of ROI in these lesions is difficult and should be placed on the highest signal portion of the lesion. We had six cases of pure non–mass-forming DCIS and ADC values varied from 1.1 to 1.3 × 10⁻³ mm2/s in these cases, thereby reducing specificity. In these cases, morphological and enhancement characteristics should be evaluated. Clumped nodular enhancement in ductal, segmental, and regional distribution has a high specificity for malignancy. Imamura et al.[28] showed that using ADC value of 1.1 × 10⁻³ mm2/s as threshold for malignancy yielded a sensitivity of 68.8%, specificity of 72.7%, PPV of 78.6%, NPV of 61.5%, and combining the ADC value with DCE-MRI enhancement pattern increased the sensitivity to 93.8% and NPV to 85.7%, but reduced the specificity to 54.4%.
DWI is associated with technical limitations such as low SNR and image distortion. Higher-strength magnets allow for high SNR, which help in detection of small cancer foci and characterization of small lesions, but are prone to more susceptibility artifacts. Use of a spin-echo–based sequence, high imaging bandwidth, and short TE helps in reducing the impact of susceptibility artifacts.[1]
Conclusion
Contrast-enhanced MRI plays an important role in characterization of breast lesions, and the addition of DWI and ADC estimation has an immense potential in improving its specificity because of the significant difference in the mean ADC value of benign and malignant lesions. However, it should be used in conjunction with other imaging sequences as it requires an enhancing counterpart to identify breast lesions; lesion morphology and enhancement characteristics also should be considered for lesion characterization. Also, the ADC values derived may vary from system to system, depending upon the number of b values, method of ROI placement, and many other specific parameters. Optimum standardization of the sequence parameters is, therefore, required to minimize the distortion artifacts and low SNR, which are inherent to this sequence.
Financial support and sponsorship
Technical support from Max Hospital, Saket, New Delhi, India.
Conflicts of interest
There are no conflicts of interest.
References
- 1.Woodhams R, Ramadan S, Stanwell P, Sakamoto S, Hata H, Ozaki M, et al. Diffusion-weighted imaging of the breast: Principles and clinical applications. Radiographics. 2011;31:1059–84. doi: 10.1148/rg.314105160. [DOI] [PubMed] [Google Scholar]
- 2.Yabuuchi H, Matsuo Y, Okafuji T, Kamitani T, Soeda H, Setoguchi T, et al. Enhanced mass on contrast-enhanced breast MR imaging: Lesion characterization using combination of dynamic contrast-enhanced and diffusion-weighted MR images. J Magn Reson Imaging. 2008;28:1157–65. doi: 10.1002/jmri.21570. [DOI] [PubMed] [Google Scholar]
- 3.Partridge SC, Mullins CD, Kurland BF, Allain MD, DeMartini WB, Eby PR, et al. Apparent diffusion coefficient values for discriminating benign and malignant breast MRI lesions: Effects of lesion type and size. AJR Am J Roentgenol. 2010;194:1664–73. doi: 10.2214/AJR.09.3534. [DOI] [PubMed] [Google Scholar]
- 4.Gilles R, Guinebretière JM, Lucidarme O, Cluzel P, Janaud G, Finet JF, et al. Nonpalpable breast tumors: Diagnosis with contrast-enhanced subtraction dynamic MR imaging. Radiology. 1994;191:625–31. doi: 10.1148/radiology.191.3.8184038. [DOI] [PubMed] [Google Scholar]
- 5.Petralia G, Bonello L, Priolo F, Summers P, Bellomi M. Breast MR with special focus on DW-MRI and DCE-MRI. Cancer Imaging. 2011;11:76–90. doi: 10.1102/1470-7330.2011.0014. [DOI] [PMC free article] [PubMed] [Google Scholar]
- 6.Bammer R. Basic principles of diffusion-weighted imaging. Eur J Radiol. 2003;45:169–84. doi: 10.1016/s0720-048x(02)00303-0. [DOI] [PubMed] [Google Scholar]
- 7.Brandão AC, Lehman CD, Partridge SC. Breast magnetic resonance imaging: Diffusion-weighted imaging. Magn Reson Imaging Clin N Am. 2013;21:321–36. doi: 10.1016/j.mric.2013.01.002. [DOI] [PubMed] [Google Scholar]
- 8.Koh DM, Collins DJ. Diffusion-weighted MRI in the body: Applications and challenges in oncology. AJR Am J Roentgenol. 2007;188:1622–35. doi: 10.2214/AJR.06.1403. [DOI] [PubMed] [Google Scholar]
- 9.Pereira FP, Martins G, Figueiredo E, Domingues MN, Domingues RC, da Fonseca LM, et al. Assessment of breast lesions with diffusion-weighted MRI: Comparing the use of different b values. AJR Am J Roentgenol. 2009;193:1030–5. doi: 10.2214/AJR.09.2522. [DOI] [PubMed] [Google Scholar]
- 10.Park MJ, Cha ES, Kang BJ, Ihn YK, Baik JH. The role of diffusion-weighted imaging and the apparent diffusion coefficient (ADC) values for breast tumors. Korean J Radiol. 2007;8:390–6. doi: 10.3348/kjr.2007.8.5.390. [DOI] [PMC free article] [PubMed] [Google Scholar]
- 11.Baron P, Dorrius MD, Kappert P, Oudkerk M, Sijens PE. Diffusion-weighted imaging of normal fibroglandular breast tissue: Influence of microperfusion and fat suppression technique on the apparent diffusion coefficient. NMR Biomed. 2010;23:399–405. doi: 10.1002/nbm.1475. [DOI] [PubMed] [Google Scholar]
- 12.Jin G, An N, Jacobs MA, Li K. The role of parallel diffusion-weighted imaging and apparent diffusion coefficient (ADC) maP values for evaluating breast lesions: Preliminary results. Acad Radiol. 2010;17:456–63. doi: 10.1016/j.acra.2009.12.004. [DOI] [PMC free article] [PubMed] [Google Scholar]
- 13.Baltzer PA, Benndorf M, Dietzel M, Gajda M, Camara O, Kaiser WA. Sensitivity and specificity of unenhanced MR mammography (DWI combined with T2-weighted TSE imaging, ueMRM) for the differentiation of mass lesions. Eur Radiol. 2010;20:1101–10. doi: 10.1007/s00330-009-1654-5. [DOI] [PubMed] [Google Scholar]
- 14.Schott AF, Roubidoux MA, Helvie MA, Hayes DF, Kleer CG, Newman LA, et al. Clinical and radiologic assessments to predict breast cancer pathologic complete response to neoadjuvant chemotherapy. Breast Cancer Res Treat. 2005;92:231–8. doi: 10.1007/s10549-005-2510-1. [DOI] [PubMed] [Google Scholar]
- 15.Rieber A, Brambs HJ, Gabelmann A, Heilmann V, Kreienberg R, Kühn T. Breast MRI for monitoring response of primary breast cancer to neo-adjuvant chemotherapy. Eur Radiol. 2002;12:1711–9. doi: 10.1007/s00330-001-1233-x. [DOI] [PubMed] [Google Scholar]
- 16.Matsuoka A, Minato M, Harada M, Kubo H, Bandou Y, Tangoku A, et al. Comparison of 3.0- and 1.5-tesla diffusion-weighted imaging in the visibility of breast cancer. Radiat Med. 2008;26:15–20. doi: 10.1007/s11604-007-0187-6. [DOI] [PubMed] [Google Scholar]
- 17.Lo GG, Ai V, Chan JK, Li KW, Cheung PS, Wong TT, et al. Diffusion-weighted magnetic resonance imaging of breast lesions: First experiences at 3 T. J Comput Assist Tomogr. 2009;33:63–9. doi: 10.1097/RCT.0b013e318165dc6b. [DOI] [PubMed] [Google Scholar]
- 18.Woodhams R, Matsunaga K, Iwabuchi K, Kan S, Hata H, Kuranami M, et al. Diffusion-weighted imaging of malignant breast tumors: The usefulness of apparent diffusion coefficient (ADC) value and ADC map for the detection of malignant breast tumors and evaluation of cancer extension. J Comput Assist Tomogr. 2005;29:644–9. doi: 10.1097/01.rct.0000171913.74086.1b. [DOI] [PubMed] [Google Scholar]
- 19.Woodhams R, Matsunaga K, Kan S, Hata H, Ozaki M, Iwabuchi K, et al. ADC mapping of benign and malignant breast tumors. Magn Reson Med Sci. 2005;4:35–42. doi: 10.2463/mrms.4.35. [DOI] [PubMed] [Google Scholar]
- 20.Sinha S, Lucas-Quesada FA, Sinha U, DeBruhl N, Bassett LW. In vivo diffusion-weighted MRI of the breast: Potential for lesion characterization. J Magn Reson Imaging. 2002;15:693–704. doi: 10.1002/jmri.10116. [DOI] [PubMed] [Google Scholar]
- 21.Rubesova E, Grell AS, De Maertelaer V, Metens T, Chao SL, Lemort M. Quantitative diffusion imaging in breast cancer: A clinical prospective study. J Magn Reson Imaging. 2006;24:319–24. doi: 10.1002/jmri.20643. [DOI] [PubMed] [Google Scholar]
- 22.Min Q, Shao K, Zhai L, Liu W, Zhu C, Yuan L, et al. Differential diagnosis of benign and malignant breast masses using diffusion-weighted magnetic resonance imaging. World J Surg Oncol. 2015;13:32. doi: 10.1186/s12957-014-0431-3. [DOI] [PMC free article] [PubMed] [Google Scholar]
- 23.Guo Y, Cai YQ, Cai ZL, Gao YG, An NY, Ma L, et al. Differentiation of clinically benign and malignant breast lesions using diffusion-weighted imaging. J Magn Reson Imaging. 2002;16:172–8. doi: 10.1002/jmri.10140. [DOI] [PubMed] [Google Scholar]
- 24.Ei Khouli RH, Jacobs MA, Mezban SD, Huang P, Kamel IR, Macura KJ, et al. Diffusion-weighted imaging improves the diagnostic accuracy of conventional 3.0-T breast MR Imaging. Radiology. 2010;256:64–73. doi: 10.1148/radiol.10091367. [DOI] [PMC free article] [PubMed] [Google Scholar]
- 25.Buadu LD, Murakami J, Murayama S, Hashiguchi N, Sakai S, Masuda K, et al. Breast lesions correlation of contrast medium enhancement patterns on MR imaging with histopathologic findings and tumor angiogenesis. Radiology. 1996;200:639–49. doi: 10.1148/radiology.200.3.8756909. [DOI] [PubMed] [Google Scholar]
- 26.Hatakenaka M, Soeda H, Yabuuchi H, Matsuo Y, Kamitani T, Oda Y, et al. Apparent diffusion coefficients of breast tumors: Clinical application. Magn Reson Med Sci. 2008;7:23–9. doi: 10.2463/mrms.7.23. [DOI] [PubMed] [Google Scholar]
- 27.Woodhams R, Kakita S, Hata H, Iwabuchi K, Umeoka S, Mountford CE, et al. Diffusion-weighted imaging of mucinous carcinoma of the breast: Evaluation of apparent diffusion coefficient and signal intensity in correlation with histologic findings. AJR Am J Roentgenol. 2009;193:260–6. doi: 10.2214/AJR.08.1670. [DOI] [PubMed] [Google Scholar]
- 28.Imamura T, Isomoto I, Sueyoshi E, Yano H, Uga T, Abe K, et al. Diagnostic performance of ADC for Non-mass-like breast lesions on MR imaging. Magn Reson Med Sci. 2010;9:217–25. doi: 10.2463/mrms.9.217. [DOI] [PubMed] [Google Scholar]


