

Abstract
Peripheral nerve sheath tumors are categorized into benign and malignant forms, comprising of neurofibroma and schwannoma in the benign category and malignant peripheral nerve sheath tumors in the malignant category. Magnetic resonance imaging plays an important role in the diagnosis of these lesions. The various imaging features and signs that help to identify and characterize a nerve sheath tumor are, distribution of the tumor along a major nerve, an entering or exiting nerve sign, target sign, a fascicular sign and a split-fat sign.
Keywords: Magnetic resonance imaging, neurofibroma, schwannoma, target sign
Introduction
Peripheral nerve sheath tumors account for nearly 12% of the benign and 7-8% of the malignant soft tissue neoplasms.[1] Neurofibromas and schwannomas constitute the benign category, while the malignant peripheral nerve sheath tumor (MPNST) comes under the malignant category.[2,3] Magnetic resonance imaging (MRI) plays a pivotal role in the identification, characterization, and differentiation of benign versus malignant nerve sheath tumors. On MRI, these tumors are seen as fusiform lesions, with low to intermediate signal intensity on T1W images and high-signal intensity on T2W images.[4] The differentiation of benign and malignant nerve sheath tumors is an imaging challenge, hence, a few imaging signs serve as problem-solving tools. In this pictorial review, there is an attempt to emphasize on the various MRI signs described in literature that aid in the diagnosis of peripheral nerve sheath tumors.
Discussion
Neural distribution
Distribution of the lesion along the course of the nerve is a feature of prime importance for the diagnosis of a nerve sheath tumor [Figure 1]. The benign lesions may be located along the cutaneous or deep nerves, however, their malignant counterparts are seen most commonly along the major nerve trunk [Figure 2]. Neurofibromas are seen most commonly in the head and neck regions, while schwannomas are more common in the lower extremity. The dumbbell shape [Figure 3] is characteristically seen in paraspinal neurofibromas, in which intraspinal extension of the tumor causes widening of the neural canal.[5,6,7]
Figure 1 (A and B).
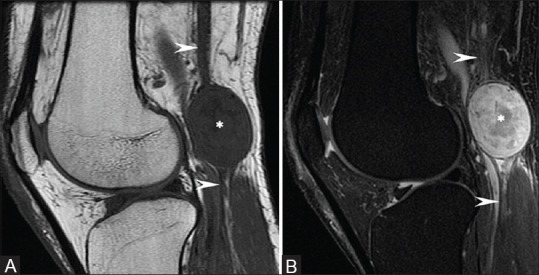
Schwannoma along the sciatic Nerve: Sagittal T1W and T2W fat-saturated images show a well-defined round lesion (asterisk), which is isointense on T1 and heterogeneously hyperintense on T2, along the course of the sciatic nerve (arrowhead)
Figure 2 (A and B).
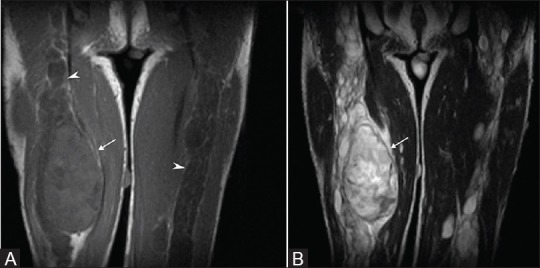
Known case of Neurofibromatosis type I: Coronal T1W and T2W images show diffuse enlargement of the sciatic nerves (arrowheads) bilaterally, suggestive of plexiform neurofibromas, with a focally enlarged and heterogeneous mass (arrows). Resection and histopathology revealed neurofibrosarcoma
Figure 3 (A and B).
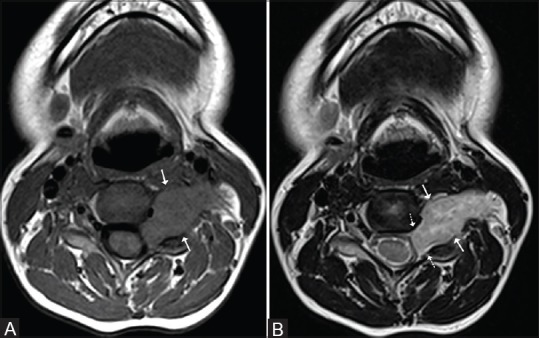
Paraspinal schwannoma: Axial T1 and T2W images show an oblongated lesion (arrows), which is isointense on T1 and heterogeneously hyperintense on T2 in the cervical spine, causing widening of the neural canal (dotted arrows) and extending into the soft tissues of the neck
Entering or exiting nerve sign
Neurofibromas are pathologically characterized by fusiform enlargement of the nerve, with the tapered ends of the lesion toward the parent nerve [Figure 4]. Schwannomas can also have a fusiform shape, but they are located eccentrically in relation to the nerve, in contradistinction to neurofibroma, which is central and inseparable from the parent nerve [Figure 5]. On account of this feature, the surgical management of neurofibromas requires excision of the lesion along with the parent nerve, however, in schwannomas, the parent nerve can be spared. The plexiform variant of the neurofibroma causes a diffuse expansion and enlargement of the parent nerve resulting in a ‘bag of worms’ [Figure 6] appearance on imaging as well as on gross pathological examination.[4,5,7]
Figure 4 (A and B).
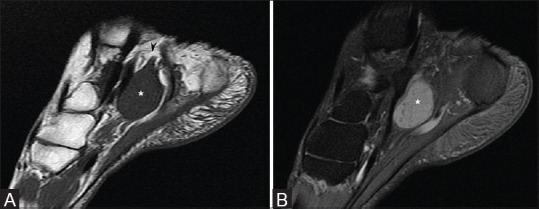
Neurofibroma along the posterior tibial nerve: Sagittal T1W and T2W fat-saturated images show a well-defined fusiform lesion (asterisk), which is isointense on T1 and hyperintense on T2, along the distribution of the posterior tibial nerve (arrowhead)
Figure 5 (A and B).
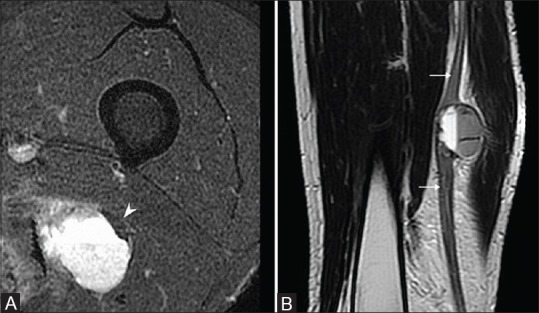
Schwannoma along the sciatic nerve: (A) An axial T2W fat-saturated image shows an eccentric hyperintense lesion with peripherally displaced and compressed sciatic nerve (arrowhead) (B) T2 sagittal image demonstrates a lesion with fluid level and its relationship with the sciatic nerve (arrows)
Figure 6.
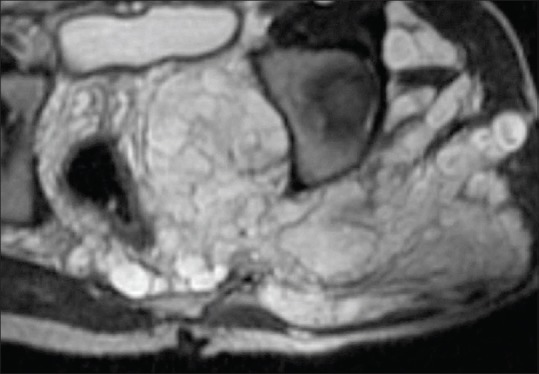
Known case of neurofibromatosis type I: An axial T2W image shows nodular thickening of the pelvic nerves in the case of plexiform neurofibromatosis giving a ‘bag of worms’ appearance, which corresponds to its appearance on gross examination
Target sign
The target sign is portrayed on axial T2W images as a central area of hypointensity with a peripheral hyperintensity. This sign is most often seen with neurofibromas [Figure 7]. Postcontrast, there is central enhancement with peripheral hypointensity seen in these lesions [Figure 8]. Pathologically, there is a central fibrocollagenous core and a surrounding myxomatous tissue, which accounts for this imaging pattern. However, the target sign may be seen in schwannomas also, but the pathological basis of the target sign is different from the neurofibroma. In these lesions, it is accounted for by a central distribution of the more cellular Antoni type A cells, with a surrounding rim of hypocellular Antoni type B cells. The presence of this sign in a malignant peripheral nerve sheath tumor is indicative of benign tissue within the lesion, however, the absence of this sign in a lesion is indicative of a malignant transformation of the primary benign lesion.[8]
Figure 7.
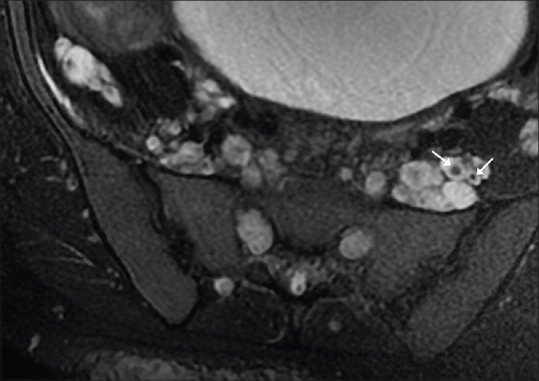
Known case of neurofibromatosis type I: Axial T2W fat-saturated images show multiple hyperintense lesions in the pelvis, with a few of them showing central hypointensity (arrow) suggestive of a ‘Target sign’
Figure 8 (A-C).
Plexiform neurofibroma of the tibial nerve with target sign: (A and B) Axial and sagittal T2W images show multiple lesions with peripheral hyperintensity and central hypointensity (black arrow) (C) Post-contrast, there is enhancement of the central core (white arrow)
Fascicular sign
The ‘fascicular sign’ for the neurogenic lesions is represented by multiple ring-like structures, which appear as hypointense foci within the hyperintense area on T2W images, possibly reflecting the fascicular bundles seen histologically [Figure 9] and [Figure 10]. This sign is often seen in benign nerve sheath tumors and can occasionally be seen in tumors with focal malignant transformation.[4,7,9]
Figure 9.
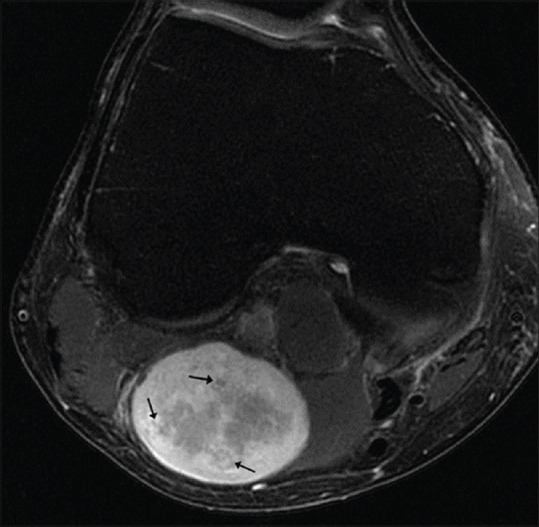
Fascicular sign: An axial T2W, fat-saturated image mass shows multiple, small, circular, low-signal intensity areas surrounded by a background of mild hyperintensity representing a ‘fascicular sign’ (arrows)
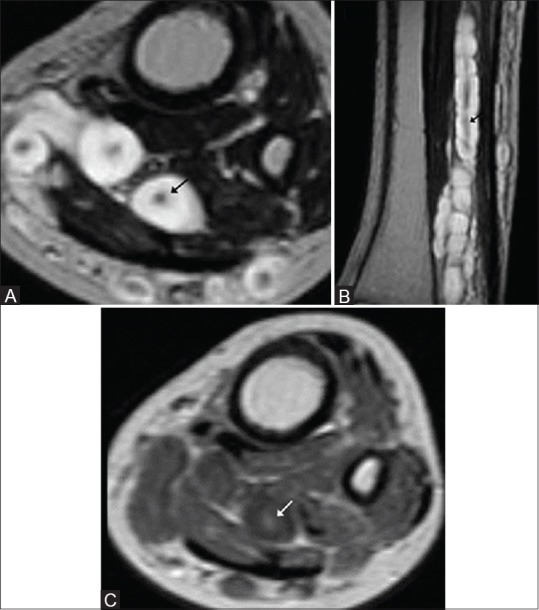
Figure 10 (A and B).
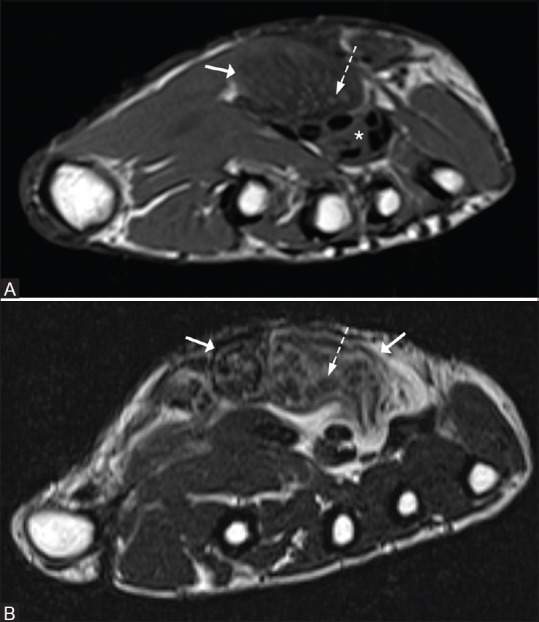
Fascicular sign in a lipofibromatous hamartoma of the median nerve: An axial T1W and T2W image reveals thickening of the median nerve (arrow) lying superficial to the flexor tendons (asterisk). Multiple small foci that are isointense on T1 and hypointense on T2 (dotted arrows) are seen on a heterogeneously hyperintense background on T2W images, representing the nerve fascicles
Split fat sign
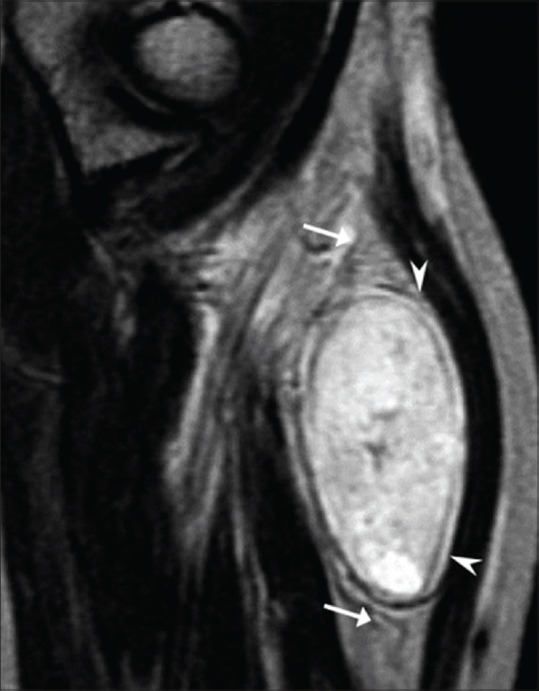
A ‘split fat sign’ refers to the presence of fat at the upper and lower poles of a lesion on T1W images, which is suggestive of the intermuscular location of the lesion [Figure 11]. This sign is most commonly seen in neurogenic tumors, although it is not specific to them, as it may occasionally be seen in other soft tissue tumors arising in the intermuscular location. It is a feature of benignity, as malignant lesions [Figure 12] tend to be more infiltrative in nature, resulting in the obliteration of fat at the ends of the lesion.[4,9]
Figure 11 (A and B).
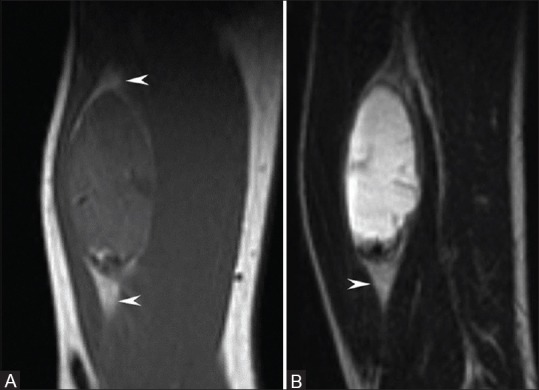
Schwannoma with a split fat sign: T1W and T2W sagittal images show an oblongated encapsulated lesion, which is isointense on T1 and hyperintense on T2 on the posterior aspect of the arm in the intermuscular plane, with preserved fat at the upper and lower ends (arrowheads)
Figure 12 (A and B).
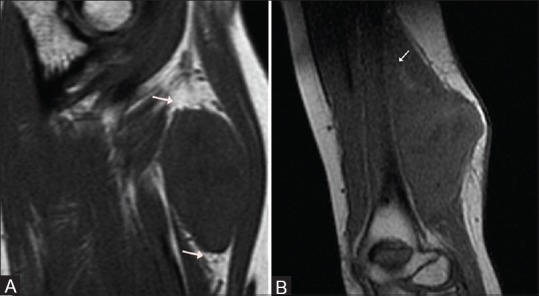
Benign versus malignant: (A) Sagittal T1W image shows preserved fat at the ends of the lesion (arrows). Final diagnosis: Schwannoma (B) Sagittal T1W image shows an elongated lesion on the flexor aspect of the arm, with lack of intermuscular fat at its ends (arrow) secondary to infiltration. Final diagnosis: Malignant peripheral nerve sheath tumor
Muscular atrophy
The presence of a lesion with associated regional muscular atrophy in the neural distribution is indicative of a nerve sheath tumor. On imaging, it is best seen on T1W images as hyperintense areas, secondary to fatty replacement [Figure 13], interspersed within normal-appearing muscles.[4,5,9,10]
Figure 13.
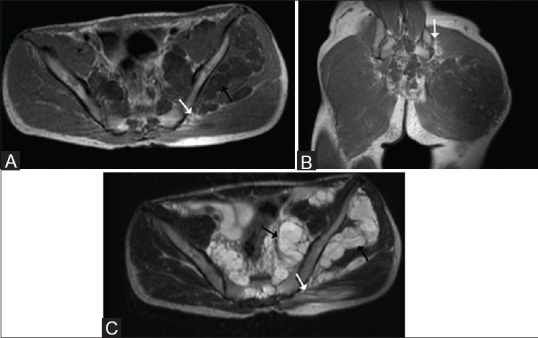
(A-C) Known case of neurofibromatosis with plexiform neurofibroma: Axial and coronal T1W and axial T2W images show plexiform neurofibromas in the pelvis and left gluteal region (black arrows). There is atrophy of the glutei muscles on the left side (arrows), seen as T1 and T2 hyperintense areas within the muscle fibers
T2 hyperintense rim
A thin rim of T2 hyperintensity has been observed more commonly in cases of schwannomas, as compared to neurofibromas [Figure 14].[7]
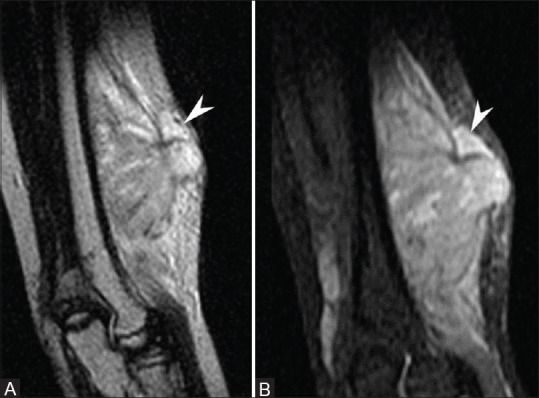
Figure 14.
Schwannoma with hyperintense rim: Sagittal T2W image shows an elongated lesion in the intermuscular plane on the flexor aspect of the forearm with a split fat sign (arrows) and a thin hyperintense rim (arrowheads)
Intra-tumoral cysts
Intra-tumoral cystic degeneration is a more common feature of schwannomas, as compared to neurofibromas. Long-standing tumors that are relatively large, can undergo cystic degeneration with calcification and hemorrhage, and are described as ancient schwannomas [Figure 15]. On imaging, it may not be always possible to differentiate these benign variants of schwannomas from malignant nerve sheath tumors or other malignant soft tissue tumors.[4,7,11]
Figure 15 (A and B).
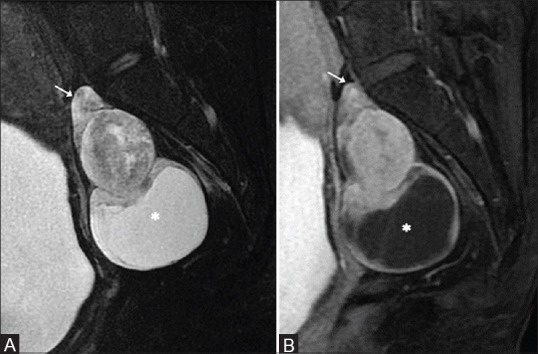
Ancient Schwannoma with cystic degeneration: (A) Sagittal T2W mage shows a heterogeneously hyperintense lesion in the presacral location, arising from the lower lumbar root (arrow), with central cystic changes and a large peritumoral cyst (asterisk) (B) Postcontrast, the superior aspect of the lesion shows heterogeneous enhancement with a peripherally enhancing peritumoral cyst (asterisk)
Signs of malignant peripheral nerve sheath tumors
Benign lesions seldom achieve a size larger than 5 cm, and an increase in size of these lesions is highly suggestive of a malignant transformation that requires histopathological confirmation. Malignant lesions tend to be more heterogeneous on T1W and T2W images [Figure 16A], as compared to their benign counterparts, secondary to the necrotic and hemorrhagic areas within. However, a similar heterogeneity can be seen in cases of long-standing cases of schwannomas that have undergone degeneration. Another sign that favors the malignant nature of the lesion is the presence of perilesional edema that is seen as an area of increased signal intensity on T2W images, adjacent to the primary lesion, which is suggestive of perilesional infiltration or edema [Figure 17]. This feature is usually absent in benign neurogenic lesions.[12] Malignant tumors may show solid or peripheral enhancement, which differentiates them from neurofibromas that show focal central enhancement (Target sign). However, enhancement patterns similar to malignant peripheral nerve tumors can be seen in schwannomas, secondary to the areas of degeneration in them. Bony involvement [Figure 16B] in the form of destruction of the bone goes in favor of a malignant lesion.[4,5,10] The salient imaging features of neurogenic tumors are summarized in Table 1.
Figure 16 (A and B).
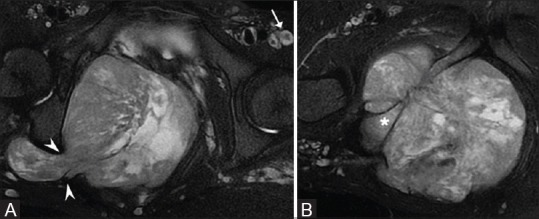
Known case of neurofibromatosis type I with a malignant peripheral nerve sheath tumor: (A) Axial T2W fat-saturated images show multiple neurofibromas (arrow) with a large, markedly heterogeneous mass, in the pelvis, causing enlargement of the right greater sciatic foramen and extending into the gluteal region (B) Inferiorly, there is destruction of the pubic ramus with associated marrow infiltration (asterisk)
Figure 17 (A and B).
Malignant peripheral nerve sheath tumor with peritumoral edema: Sagittal T2W and short tau inversion recovery (STIR) images show an ill-defined hyperintense lesion along the flexor aspect of the arm, with an ill-defined perilesional hyperintensity in the superior aspect (arrowhead), suggestive of peritumoral edema secondary to infiltration
Table 1.
Salient imaging features of neurogenic lesions
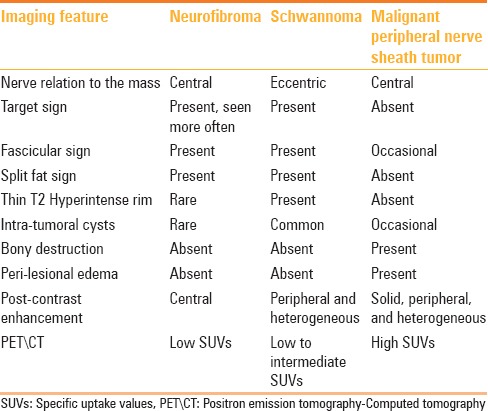
In recent years, Positron emission tomography-Computed tomography (FDG PET/CT) has shown some promising results in the differentiation between benign and malignant lesions based on the difference in the fluorodeoxygenase (FDG) uptake by the benign and malignant lesions. The quantitative analysis of the FDG uptake reveals that malignant lesions have significantly higher specific uptake values (SUVs) as compared to the neurofibromas, thus increasing the confidence in differentiating this subset of lesions. The SUVs in cases of schwannomas are higher as compared to the neurofibromas and may sometimes have an overlapping pattern, as in malignant peripheral nerve sheath tumors.[13]
Conclusion
In summary, MRI plays an important role in the management of peripheral nerve sheath tumors. Imaging signs, such as, entering or exiting nerve sign, target sign, fascicular sign, and split fat sign, when used in combination, may be helpful in identifying a neurogenic lesion and may, to an extent, differentiate between their benign and malignant counterparts. However, it may not be always possible, preoperatively, to differentiate between neurofibromas and schwannomas, as well as benign lesions and their malignant counterparts, due to the overlap of the imaging features between these lesions.
Footnotes
Source of Support: Nil
Conflict of Interest: None declared.
References
- 1.Kransdorf MJ, Murphey MD. 2nd ed. Philadelphia, PA: Lippincott Williams and Wilkins; 2006. Imaging of Soft Tissue Tumors; pp. 329–80. [Google Scholar]
- 2.Kransdorf MJ. Benign soft-tissue tumors in a large referral population: Distribution of specific diagnoses by age, sex and location. AJR Am J Roentgenol. 1995;164:395–402. doi: 10.2214/ajr.164.2.7839977. [DOI] [PubMed] [Google Scholar]
- 3.Kransdorf MJ. Malignant soft-tissue tumors in a large referral population: Distribution of diagnoses by age, sex, and location. AJR Am J Roentgenol. 1995;164:129–34. doi: 10.2214/ajr.164.1.7998525. [DOI] [PubMed] [Google Scholar]
- 4.Chee DW, Peh WC, Shek TW. Pictorial essay: Imaging of peripheral nerve sheath tumors. Can Assoc Radiol J. 2011;62:176–82. doi: 10.1016/j.carj.2010.04.009. [DOI] [PubMed] [Google Scholar]
- 5.Lin J, Martel W. Cross-sectional imaging of peripheral nerve sheath tumors: Characteristic signs on CT, MR Imaging and Sonography. AJR Am J Roentgenol. 2001;176:75–82. doi: 10.2214/ajr.176.1.1760075. [DOI] [PubMed] [Google Scholar]
- 6.Beaman FD, Kransdorf MJ, Menke DM. Schwannoma: Radiologic-pathologic correlation. Radiographics. 2004;24:1477–81. doi: 10.1148/rg.245045001. [DOI] [PubMed] [Google Scholar]
- 7.Jee WH, Oh SN, McCauley T, Ryu KN, Suh JS, Lee JH, et al. Extraaxial neurofibromas versus neurilemmomas: Discrimination with MRI. AJR Am J Roentgenol. 2004;183:629–33. doi: 10.2214/ajr.183.3.1830629. [DOI] [PubMed] [Google Scholar]
- 8.Banks KP. The target sign: Extremity. Radiology. 2005;234:899–900. doi: 10.1148/radiol.2343030946. [DOI] [PubMed] [Google Scholar]
- 9.Murphey MD, Smith WS, Smith SE, Kransdorf MJ, Temple HT. From the archives of the AFIP. Imaging of musculoskeletal neurogenic tumors: Radiologic-pathologic correlation. Radiographics. 1999;19:1253–80. doi: 10.1148/radiographics.19.5.g99se101253. [DOI] [PubMed] [Google Scholar]
- 10.Stull MA, Moser RP, Jr, Kransdorf MJ, Bogumill GP, Nelson MC. Magnetic resonance appearance of peripheral nerve sheath tumors. Skeletal Radiol. 1991;20:9–14. doi: 10.1007/BF00243714. [DOI] [PubMed] [Google Scholar]
- 11.Isobe K, Shimizu T, Akahane T, Kato H. Imaging of ancient schwannoma. AJR Am J Roentgenol. 2004;183:331–6. doi: 10.2214/ajr.183.2.1830331. [DOI] [PubMed] [Google Scholar]
- 12.Wasa J, Nishida Y, Tsukushi S, Shido Y, Sugiura H, Nakashima H, et al. MRI features in the differentiation of malignant peripheral nerve sheath tumors and neurofibromas. AJR Am J Roentgenol. 2010;194:1568–74. doi: 10.2214/AJR.09.2724. [DOI] [PubMed] [Google Scholar]
- 13.Benz MR, Czernin J, Dry SM, Tap WD, Allen-Auerbach MS, Elashoff D, et al. Quantitative F18-fluorodeoxyglucose positron emission tomography accurately characterizes peripheral nerve sheath tumors as malignant or benign. Cancer. 2010;116:451–8. doi: 10.1002/cncr.24755. [DOI] [PMC free article] [PubMed] [Google Scholar]