

Abstract
Objective
Dementia with Lewy bodies (DLB) is associated with the accumulation of wild‐type human α‐synuclein (SYN) in neurons and with prominent slowing of brain oscillations on electroencephalography (EEG). However, it remains uncertain whether the EEG abnormalities are actually caused by SYN.
Methods
To determine whether SYN can cause neural network abnormalities, we performed EEG recordings and analyzed the expression of neuronal activity‐dependent gene products in SYN transgenic mice. We also carried out comparative analyses in humans with DLB.
Results
We demonstrate that neuronal expression of SYN in transgenic mice causes a left shift in spectral power that closely resembles the EEG slowing observed in DLB patients. Surprisingly, SYN mice also had seizures and showed molecular hippocampal alterations indicative of aberrant network excitability, including calbindin depletion in the dentate gyrus. In postmortem brain tissues from DLB patients, we found reduced levels of calbindin mRNA in the dentate gyrus. Furthermore, nearly one quarter of DLB patients showed myoclonus, a clinical sign of aberrant network excitability that was associated with an earlier age of onset of cognitive impairments. In SYN mice, partial suppression of epileptiform activity did not alter their shift in spectral power. Furthermore, epileptiform activity in human amyloid precursor protein transgenic mice was not associated with a left shift in spectral power.
Interpretation
We conclude that neuronal accumulation of SYN slows brain oscillations and, in parallel, causes aberrant network excitability that can escalate into seizure activity. The potential role of aberrant network excitability in DLB merits further investigation.
Introduction
Dementia with Lewy bodies (DLB) belongs to a family of common neurodegenerative diseases called synucleinopathies, which are pathologically characterized by the mislocalization and aggregation of the small, presynaptic protein α‐synuclein (SYN). DLB, Parkinson's disease (PD), and Parkinson's disease with dementia (PDD) are closely related synucleinopathies, but are distinguished by differences in the relative onset of motor and cognitive impairments and in the distribution of SYN pathology.1 While much is known about the motor impairments in PD, very little is known about the mechanisms of cognitive impairment and cortical network dysfunction in DLB and PDD. DLB and PDD patients have dementia with visual hallucinations, attentional fluctuations, and parkinsonism.1 These symptoms are associated with a prominent slowing of cortical oscillations on electroencephalography (EEG), resulting in a shift in spectral power from higher (alpha, beta, gamma) to lower (delta, theta) frequency bands.2, 3 However, it remains uncertain whether the neural network and cognitive dysfunction in these conditions are actually caused by SYN.
EEG slowing in neurodegenerative diseases is often attributed to the loss of cholinergic neurons projecting to the cortex. In some Alzheimer's disease (AD) patients, treatment with inhibitors of acetylcholinesterase, administered to compensate for cholinergic denervation, can improve frontal EEG activity and some cognitive functions.4, 5 DLB patients have a greater loss of cholinergic neurons6 and show more EEG slowing, as well as greater clinical improvement, with acetylcholinesterase inhibitor treatment7 than AD patients.2, 3 Although DLB and PDD patients show loss of cholinergic projections in most cortical areas,6, 8 cholinergic treatment normalizes brain activity only in the frontal cortex, as measured by resting‐state fMRI,9 suggesting that different mechanisms contribute to network dysfunction in other cortical regions. Defining these mechanisms of neural network dysfunction may lead to new therapeutic interventions for DLB patients.
Notably, neuronal overexpression of SYN impairs presynaptic release10, 11 and causes behavioral deficits in SYN transgenic mice,12, 13 and pharmacologically decreasing presynaptic release of neurotransmitters decreases the power of high‐frequency brain oscillations on EEG.14 These findings raise the possibility that SYN causally contributes to neural network dysfunction in DLB and PDD patients. To test this hypothesis, we performed EEG recordings and analyzed the expression of neuronal activity‐dependent gene products in SYN transgenic mice. We also carried out comparative analyses in humans with DLB.
Subjects and Methods
Chart review and analysis of clinical data
We searched the electronic database of the UCSF Memory and Aging Center for patients who were seen between 2007 and 2012, met McKeith criteria1 for DLB on their latest evaluation during that period, and had a clinical diagnosis of DLB (n = 178) (Fig. 1). Of these, 16 DLB patients were removed because their records were incomplete. We searched the remaining patient records for seizures, epilepsy, myoclonus, head trauma, and fluctuations using the word stems “seiz‐”, “spells”, “epil‐”, “eeg”, “myo‐”, “head”, and “fluc‐”. A seizure disorder (i.e., epilepsy) was defined as two or more unprovoked seizures or one unprovoked seizure with EEG evidence of epileptiform activity.15 We excluded patients who had a seizure but did not meet the criteria for a seizure disorder (n = 1) or had other seizure risk factors, including urinary tract infection with a fever (n = 1), normal pressure hydrocephalus with a shunt and fever (n = 1), stroke (n = 1), and a frontal cavernous hemangioma (n = 1). Among the remaining 157 DLB patients, 4 (2.5%) patients met the criteria for a seizure disorder and 34 (21.7%) patients were noted to have myoclonus. All four patients with a seizure disorder carried the clinical diagnosis of seizures and were on anti‐epileptic medications. In 12 (7.6%) patients without the diagnosis of a seizure disorder, EEGs had been obtained for suspected seizures. None of the patients with a seizure disorder, but one patient with myoclonus, had a history of mild head trauma with loss of consciousness for several minutes. A mixed‐effects linear model was fit to age of onset of cognitive impairment with sex, education, handedness, fluctuations, seizure disorder, and myoclonus as independent variables. The presence versus absence of a clinical history of fluctuations, seizure disorder, or myoclonus was quantified using 1 or 0, respectively. Reported P‐values were derived from the mixed‐effects linear model including all variables. Significance was retained in a mixed‐effects linear model of age of onset of cognitive impairment using only sex (P = 0.002) and myoclonus (P = 0.008) as independent variables.
Figure 1.
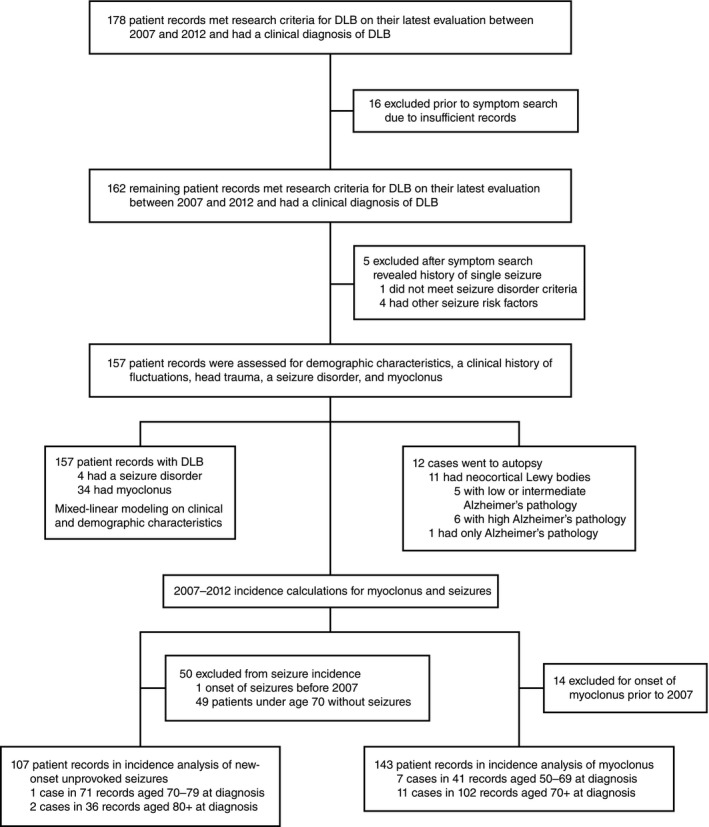
Workflow of the chart review analysis.
Incidence rates for myoclonus and a first unprovoked seizure (FUS) were calculated separately using 6 person‐years per DLB patient in the study (Fig. 1). Fourteen patients with myoclonus and one patient with FUS prior to 2007 were excluded from the respective incidence calculations. Two patients who were unaffected during the incidence study period (2007–2012) developed myoclonus in 2013. There were 18 new cases of myoclonus and three new cases of FUS in our population between 2007 and 2012. As onset of myoclonus was not usually noted in the clinical history, it was estimated using the first mention of myoclonus in clinic notes after the initial evaluation. Both myoclonus (median: +2 years relative to diagnosis, range −5 to +9) and seizures (median: −1 year relative to diagnosis, range −1 to +1) tended to begin near the diagnosis of dementia. Therefore, the age of dementia diagnosis was used to stratify the DLB population without myoclonus or seizures. Relative rates and confidence intervals were calculated according to published formulas.16
Twelve DLB cases came to autopsy. The likelihood that clinical dementia was caused by Lewy body pathology seen on autopsy was estimated using McKeith criteria.1 The presence of neocortical DLB was either directly stated by the pathologist (n = 9) or inferred from the description of Lewy body pathology (n = 2). The presence of AD pathology was based on autopsy summary statements and NIA‐Reagan criteria.17 Two cases had frequent plaques but Braak stages below five and were unclassifiable by NIA‐Reagan criteria. To determine the relative contribution of AD pathology to dementia in these cases, we classified them as NIA‐Reagan Intermediate (Braak stage 4) and NIA‐Reagan Low (Braak stage 0). All studies in human subjects were approved by the Committee on Human Research of the University of California, San Francisco. All human research subjects provided written informed consent before participating in protocols from which data were derived and were not required to re‐consent for this analysis.
EEG recordings in human subjects
DLB patients and control subjects without clinical neurological disease were recruited specifically to assess EEG changes in neurodegenerative disease. EEG recordings were obtained using an international 10–20 electrode placement. Participants were placed in the recumbent position with eyes closed and resting‐state EEG activity was recorded for 50 min. One minute from the initial 20 min of recording, during which all subjects were awake, was used for analysis. All human research subjects had previously provided written informed consent to participate in protocols from which data were derived and were not required to re‐consent for the above analysis.
Human tissues
Human postmortem brain samples (Table 1) were obtained from the brain bank of the University of California at San Diego (UCSD) and the New York Brain Bank (NYBB) at Columbia University. The dentate gyrus was isolated over dry ice from larger tissue blocks. Calbindin mRNA levels, normalized to 18S RNA levels in the dentate gyrus, were similar in the disease groups from both brain banks (data not shown).
Table 1.
Human postmortem tissues
| Diagnosis (n) | Age (mean ± SD) | Sex (M/F) | RNA integrity number (mean ± SD) |
|---|---|---|---|
| No neurodegenerative disease (3) | 84 ± 5.0 | 2/1 | 7.8 ± 0.2 |
| DLB with marked AD pathology (6) | 78 ± 4.5 | 5/1 | 6.1 ± 2.0 |
| DLB with minimal AD pathology (5) | 77 ± 5.4 | 4/1 | 5.3 ± 0.6 |
| AD (7) | 79 ± 2.9 | 2/5 | 6.5 ± 1.3 |
DLB, Dementia with Lewy bodies; AD, Alzheimer's disease.
Mice and tissues
For most experiments in this study, we used mice expressing human wild‐type α‐synuclein (Thy1‐SYN line 61,18 hereafter called SYN mice) or human amyloid precursor protein (hAPP) with Swedish and Indiana mutations (platelet‐derived growth factor (PDGF) β‐hAPP line J2019), and mice lacking endogenous tau20 on a pure C57Bl/6J background (Table S1). The data in Figure 6D–H (cohorts J–K) were obtained in mice that were mostly C57Bl/6J with some DBA2 background. EEG studies on SYN mice revealed similar levels of epileptiform activity and spectral alterations on both backgrounds (data not shown). For all experiments involving SYN mice, only male mice were used because the SYN transgene in line 61 is located on the X‐chromosome.13 To generate SYN mice on a Tau knockout background, female SYN mice were bred to male mice lacking endogenous tau. From the F1 generation, female SYN/Tau +/− mice were bred to male Tau +/− mice to generate the male SYN/Tau +/+ and SYN/Tau −/− mice used in this study. In all mouse cohorts, 40–100% of nontransgenic (NTG) controls were littermates of transgenic mice, and the remaining NTG controls were from the same SYN breeding colony. Groups of different genotypes within each cohort were age‐matched. Mouse age did not significantly affect SYN overexpression on any of the measures analyzed; however, this study was not designed to evaluate age‐related phenotypic changes. Food (Picolab Rodent Diet 20, LabDiet, St. Louis, MO, USA) and water were given ad libitum and mice were kept on a standard 12‐h light/dark cycle. Mice were housed in a specific pathogen—free facility and all procedures were done during daylight hours unless otherwise specified. Mice used for immunohistochemistry were deeply anesthetized with Avertin (2.5% w/v in 2.5% tert‐amyl alcohol/saline) and killed by transcardial perfusion with saline. One hemibrain was post‐fixed for 24–48 h in 4% paraformaldehyde in phosphate‐buffered saline (PBS) and the other hemibrain was frozen on dry ice. Sections from PDGFβ‐SYN mice (line D18) and the tissue used for Figure 4 were a gift from Dr. Eliezer Masliah (Departments of Neuroscience and Pathology, University of California, San Diego). The data in Figure 4 (cohort F) were obtained from mouse tissue on a C57Bl/6 background from Charles River with some DBA2 background, also from Charles River. All experiments were approved by the Institutional Animal Care and Use Committee of the University of California, San Francisco.
Figure 6.
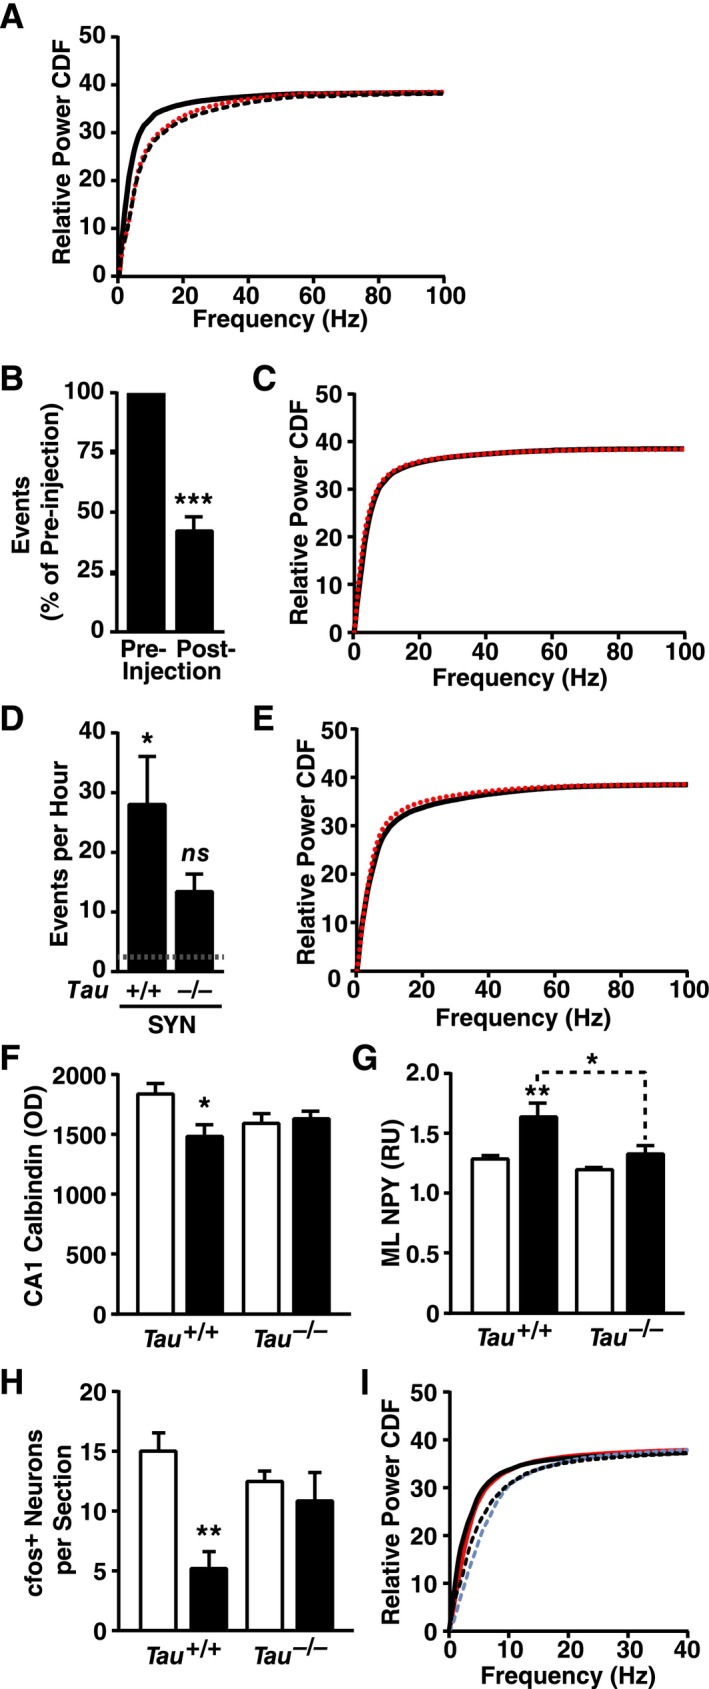
Modulation of epileptic activity does not shift spectral power. (A) SYN mice (black solid line), hAPP‐J20 mice (red dotted line) and their combined NTG littermate controls (black dashed line) were compared by EEG (n = 3–7 mice per group, age 4–5 months). SYN mice showed a left shift, whereas hAPP mice did not (NTG versus SYN P < 0.0003, hAPP versus SYN P < 0.0003, NTG versus hAPP P = 0.06, by Kolmogrov–Smirnov test with Holm correction). (B and C) Acute injection of phenobarbital (5 mg/kg, i.p.) reduced interictal spike activity (B) but did not alter the spectral power distribution (C, P = 0.70 by Kolmogrov–Smirnov test) in SYN mice (preinjection, black solid line; postinjection, red dotted line; n = 6–10 mice, age 3–7 months). (D and E) Genetic ablation of tau caused a trend toward reduced epileptic activity (D, P = 0.17 by Tukey test multiply adjusted P value) and a trend toward an increased left shift in spectral power distribution (E, P = 0.09 by Kolmogrov–Smirnov test) in SYN mice (Tau +/+, black solid line; Tau −/−, red dotted line; n = 6–7 mice per genotype, age 4–7 months). Dotted line in D represents the average level in NTG controls. (F–H) Hippocampal sections from Tau +/+, Tau −/−, SYN/Tau +/+ and SYN/Tau −/− littermates (No SYN, white bars; SYN, black bars; n = 10–13 mice per genotype, age 4–5 months) were immunostained for calbindin, NPY, or cfos and analyzed by densitometry (calbindin/NPY) or cell counting (cfos). Calbindin was measured in the stratum radiatum of CA1 (F), NPY in the molecular layer (G), and cfos‐positive cells in the granular layer (H). (I) Donepezil (1 mg/kg, i.p.) was injected once daily for 14 days in SYN mice and NTG controls (n = 3–6 mice per genotype and treatment, age 4–6 months). Spectral power distribution in NTG and SYN mice is shown for the last day of donepezil treatment (NTG with donepezil, blue dashed line; SYN with donepezil, red solid line) and after 7 days of drug washout (NTG, black dashed line; SYN, black solid line). Kolmogorov–Smirnov test with Holm correction revealed a genotype effect during (P = 0.002) and after (P < 0.005) donepezil treatment, but no effects of treatment in SYN mice (P = 0.84) or NTG controls (P = 0.90). 0–40 Hz zoom shown for clarity. (A, C, E, and I) Quantitative values are means. (B, D, and F–H) *P < 0.05, **P < 0.01 versus NTG or as indicated by brackets (Tukey test), ***P < 0.001 versus preinjection baseline (one‐sample t‐test). Bars represent means ± SEM. SYN, α‐synuclein; hAPP, human amyloid precursor protein; NTG, nontransgenic; EEG, electroencephalography; NPY, neuropeptide Y; ML, molecular layer; OD, optical density; RU, relative units.
Figure 4.
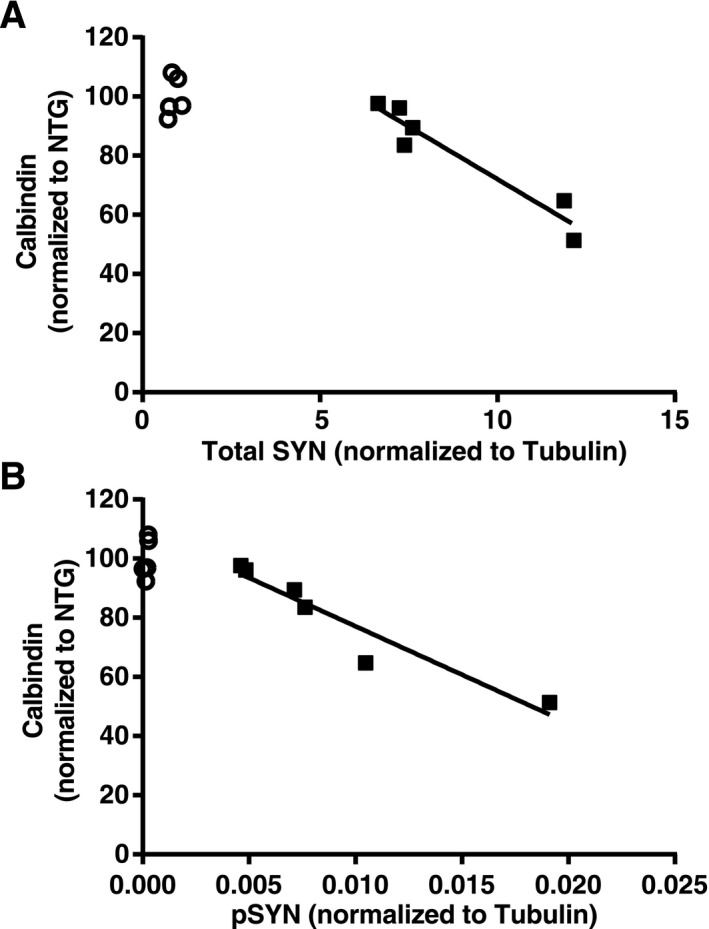
Hippocampal SYN accumulation correlates with calbindin reduction in dentate granule cells. Hippocampal sections from SYN and NTG mice (n = 5–6 mice per genotype, age 5–6 months) were immunostained for calbindin and analyzed by densitometry. Levels of total and phosphorylated SYN in contralateral hippocampi were determined by Western blot analysis and normalized to tubulin as a loading control. Calbindin levels correlated inversely with levels of total SYN (A, P = 0.0025, R 2 = 0.92) and phosphorylated SYN (B, P = 0.0032, R2 = 0.91) in SYN mice (black squares). Average calbindin levels in NTG mice (open circles) were arbitrarily defined as 100%. Solid lines are the product of a linear regression analysis. SYN, α‐synuclein; NTG, nontransgenic; pSYN, phosphorylated SYN.
EEG recordings in mice
Lightweight EEG plugs were constructed in‐house by soldering four Teflon‐coated silver wires (0.125 mm diameter) to a multichannel electrical connector. These plugs were surgically implanted into avertin‐anesthetized mice, placing the silver wire leads into the subdural space. Reference leads were placed ~1 mm posterior and ±1 mm mediolateral to bregma, and recording leads ~1 mm anterior and ±2 mm mediolateral to lambda. Mice were allowed to recover from surgery for at least 1 week before EEG recordings. EEG activity was recorded for 24 h in freely moving mice using Harmonie 5.0b software (Stellate Systems, Natus, Pleasanton, CA, USA), with one of the rostral leads serving as the reference electrode. For experiments shown in Figure 6B and C, phenobarbital sodium (0.5 mg/mL in sterile saline) was injected i.p. after four or more hours of baseline recording. For experiments shown in Figure 6I, donepezil hydrochloride (0.1 mg/mL in sterile saline) was injected i.p. every morning for 14 days; recording began immediately after the last injection.
Spectral analysis
For spectral analysis in humans, 60 sec artifact‐free EEG segments from the PZ electrode were selected manually. The signal from the PZ electrode was recorded from the parietal cortex and normalized to a calculated signal representing the center of the brain. In two subjects (one control and one DLB patient) who had no artifact‐free periods, a recording segment with minimal artifacts was selected.
For spectral analysis in mice, 20–140 sec EEG segments were selected during daytime resting behavior; the exact segment length depended on the time mice displayed resting behavior. Resting behavior was defined as lack of movement in the absence of EEG patterns suggestive of sleep entry such as sinusoidal changes in EEG amplitudes in the 5–15 Hz range. This approach minimizes the possibility that the time points analyzed occurred during sleep. Spectral analysis in phenobarbital‐ or donepezil‐treated mice was conducted during the period of spike reduction or 3–4 h21 after the drug injection, respectively. EEG recordings were evaluated by a reader blinded to the Tau genotype. However, blinding to SYN genotype was not possible because of the epileptiform activity associated with this genotype.
Selected segments were converted into European Data Format files and imported into LabChart 7 Pro (AD Instruments, Colorado Springs, CO, USA) for spectral analysis. A 60‐Hz notch filter was applied to all cases in which an electrical artifact was observed. Spectral power was obtained by subjecting the recordings to a fast Fourier transform (FFT) using a Hann cosine‐bell window with no overlap between windows. Using the EEG sampling rate, we calculated the FFT size necessary for a resolution of 0.5 Hz and selected the nearest higher FFT size available in LabChart. Human EEGs were recorded at a 600‐Hz sampling rate and FFT was performed with a 2048 point FFT size to obtain a resolution of 0.29 Hz. Mouse EEGs were recorded at a 200‐Hz sampling rate and FFT was performed with a 512 point FFT size to obtain a resolution of 0.39 Hz. Spectrogram text files were analyzed in Excel by removing time points containing movement or epileptiform activity and averaging the remaining 20–60 sec of data. Average power for each frequency block was then normalized to the total averaged power to obtain relative spectral power. Relative power cumulative distribution functions (CDF) were obtained using the integral function in Prism (GraphPad Software, La Jolla, CA, USA).
For Figure 2E, selected segments were exported as a text file and spectral power was obtained using a custom‐written Matlab script and an FFT size of 1000 points to obtain data at 5‐sec intervals.22 Spectral frequency bands were defined as follows: δ = 0.5–4 Hz, θ = 4–10 Hz, α = 10–13 Hz, β = 13–20 Hz, and γ = 20.1–99.9 Hz. The EEG signal during resting behavior in Figure 2E was analyzed over time in each frequency band using a repeated measures mixed‐model analysis with a Holm P‐value correction for multiple comparisons.
Figure 2.
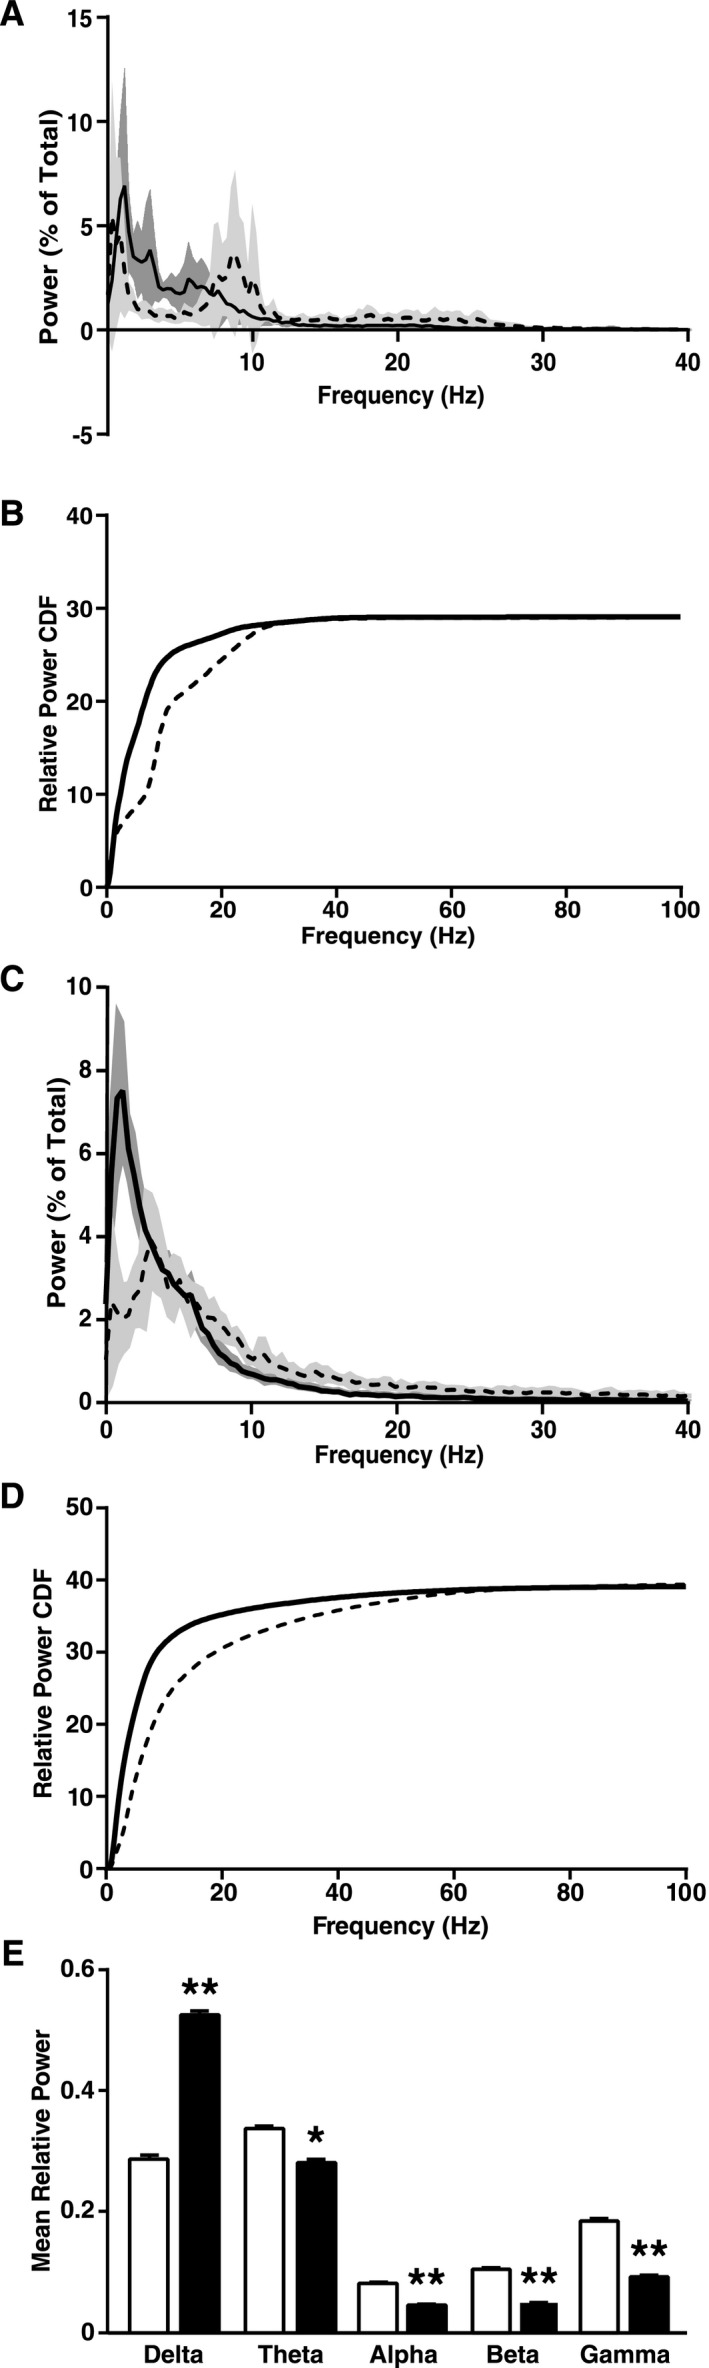
DLB in humans and neuronal expression of wild‐type human SYN in transgenic mice cause a similar left shift in EEG spectral power. (A and B) Brain oscillations in patients with DLB (n = 6, solid line) and control subjects (n = 8, dashed line) were recorded by high sampling frequency EEG/MEG. (A) Relative power (in percent of total power) of brain oscillations of different frequencies recorded by EEG over the parietal cortex (0–40 Hz zoom shown for clarity). (B) The CDF of relative power was calculated from high sampling frequency EEG recordings and revealed a shift to lower frequencies in DLB patients (P < 0.0001 by Kolmogrov–Smirnov test). (C–E) SYN mice (n = 14, solid line and black bars) and NTG littermates (n = 9, dashed line and white bars) were analyzed by EEG at 4–8 months of age. (C) Relative power (in percent of total power) of brain oscillations of different frequencies recorded over the parietal cortex (0–40 Hz zoom shown for clarity). (D) CDF of relative power revealed a shift to lower frequencies in SYN mice (P < 0.0001 by Kolmogrov–Smirnov test). (E) Relative power (in percent of total power) of brain oscillations of different frequency bands. δ = 0.5–4 Hz, θ = 4–10 Hz, α = 10–13 Hz, β = 13–20 Hz, γ = 20.1–99.9 Hz. (A–D) Black curves represent means and shadings 95% confidence intervals. (E) *P < 0.05, **P < 0.01 versus NTG (repeated measures mixed‐effects model of relative power over time with Holm correction). Values are means ± SEM; some error bars are too small to be visible. DLB, Dementia with Lewy bodies; SYN, α‐synuclein; EEG, electroencephalography; CDF, cumulative distribution function; NTG, nontransgenic.
Analysis of epileptiform activity
Epileptiform activity in mice was detected with the Gotman spike detector set to threshold 8 (Harmonie, Stellate). Events marked as epileptiform that coincided with large or sudden movements, such as rapid turns, grooming, digging, and eating, were removed as possible artifacts. Myoclonic jerks, defined as epileptiform activity accompanied by sudden abnormal movements in an otherwise motionless mouse, were not excluded. Baseline epileptiform activity was quantified during 12–16 h of EEG recordings (50% during light cycle, 50% during dark cycle), excluding the first hour of recording and the first half hour after the change in light condition. Drug effects were assessed by comparing the extent of epileptiform activity during the 2 h preceding and 2.5 h following the injection, excluding from analysis the first half hour after the injection.
Immunohistochemistry
Fixed hemibrains were stored at 4°C in PBS for 24 h and then in 30% sucrose/PBS until they were sectioned at 30 μm on a microtome (Leica Microsystems Inc., Buffalo Grove, IL, USA). Sections were stored at −20°C in a solution containing 30% glycerol, 30% ethylene glycol, and 40% PBS until staining. Primary antibodies were rabbit anti‐calbindin (1:50,000, Swant, Marly, Switzerland), rabbit anti‐NPY (neuropeptide Y) (1:8000, Immunostar, Hudson, WI, USA) and rabbit anti‐cfos (1:10,000, Ab‐5, EMD Millipore, Billerica, MA, USA). Primary antibody binding was detected with biotinylated donkey anti‐rabbit (1:500, Jackson Immunoresearch, West Grove, PA, USA), followed by avidin–biotin complex (Vector Laboratories, Burlingame, CA, USA). Quantification was done as described,23 except that optical density measurements of calbindin immunoreactivity in the dentate gyrus was not normalized to that in CA1, because calbindin was also reduced in the latter region. Quantification of calbindin levels for Figure 4 was performed as above except images were captured with a BZ‐9000 automated microscope system (Keyence, Itasca, IL, USA) and optical density was measured using elliptical regions of interest in Image J software version 1.47 (http://imagej.nih.gov/ij). The experimenter was blinded to mouse genotype.
Western blotting
Hippocampi were dissected from hemibrains over ice and homogenized in ice‐cold Pierce RIPA buffer containing Complete protease inhibitor cocktail and phosphatase inhibitor cocktails 2 and 3. The homogenates were sonicated twice for 5 min at 40 A using an EpiSonic Multi‐Functional Bioprocessor (Epigentek, Farmingdale, NY, USA). Proteins (20 μg/well) were separated on a 4–12% NuPAGE Bis‐Tris gel (Life Technologies, South San Francisco, CA, USA) and transferred onto nitrocellulose membranes for 9 min using iBlot (Life Technologies). After blocking for 1 h in a solution of 5% bovine serum albumin in Tris‐buffered saline (BSA‐TBS), membranes were incubated overnight at either room temperature with an antibody against phosphorylated SYN (1:500, Wako, Richmond, VA, USA) or at 4°C with antibodies against SYN (1:1000, Millipore) or α‐tubulin (1:50,000, Sigma‐Aldrich, St. Louis, MO, USA). Antibodies were diluted in BSA‐TBS containing 0.1% Tween 20 (BSA‐TBST). All membranes were incubated for 1 h at room temperature in a solution of IRDye 800CW‐tagged or 680LT‐tagged donkey anti‐rabbit or donkey anti‐mouse secondary antibodies (1:10,000, Li‐Cor, Lincoln, Nebraska, USA) in Odyssey blocking buffer with 0.2% Tween 20. Signals were detected with an Odyssey CLx laser scanner (Li‐Cor) and quantified using Image Studio software v2.1.10 (Li‐Cor).
RNA isolation and RT‐qPCR analysis
Frozen tissue (approximately half of the dissected dentate gyrus) was homogenized for 20 sec in 500 μL of TRIzol reagent at 20,000–21,000 rpm (Polytron homogenizer) and incubated on ice for 5 min. Samples were then mixed with 100 μL chloroform, incubated briefly on ice, and centrifuged in heavy phase lock gel tubes at 12,000g and 4°C for 5 min. The supernatant was mixed with 250 μL isopropanol, incubated for 10 min at room temperature, and centrifuged at 12,000g and 4°C for 10 min. The pellet was re‐suspended in 75% ethanol and briefly spun at 7500g at 4°C. The resulting pellet was then dissolved in 100 μL of water and incubated at 56°C for 10 min, followed by addition of 350 μL RLT buffer from the RNeasy Mini Kit (Qiagen, Valencia, CA, USA) and 250 μL ethanol. The RNA was further purified using the RNeasy Mini Kit following the “On‐column DNase digestion” protocol using 30 μL water for final elution. RNA concentration was measured by Nanodrop (ND‐1000; Thermo Fisher Scientific, Waltham, MA, USA). RNA integrity was determined on a 2100 Bioanalyzer (Agilent Technologies, Santa Clara, CA, USA) according to the manufacturer's instructions. All RNA samples were diluted to the same concentration and reverse transcribed with oligo‐dTs and random hexamers according to the manufacturer's instructions (TaqMan® Reverse Transcription Reagents; Thermo Fisher Scientific). Negative controls were generated by combining several samples and running RT‐qPCR without reverse transcriptase. qPCR was carried out with SYBR green (SYBR green PCR Master Mix, Applied Biosystems) on a 7900HT Fast Real‐Time PCR System (Applied Biosystems). To ensure that RNA quality was sufficient for RT‐qPCR measurements, only samples with an RNA integrity number greater than 4.0 were analyzed. RNA integrity was not significantly different between groups by one‐way analysis of variance (ANOVA) (data not shown). The experimenter was blinded to the pathological diagnosis of human cases.
Chemicals
The following chemicals were used: avertin prepared from 99% pure tribromoethanol (A18706; Alfa Aesar, Ward Hill, MA, USA) and tert‐amyl alcohol (Sigma‐Aldrich), phenobarbital sodium (5‐ethyl‐5‐phenyl‐2,4,6‐trioxohexahydropyrimidine sodium salt, P5178; Sigma‐Aldrich), paraformaldehyde diluted from 32% solution (Electron Microscopy Sciences, Hatfield, PA, USA), TRIzol reagent (Life Technologies), chloroform (Sigma‐Aldrich), glycerol (Fisher Scientific, Pittsburgh, PA, USA), ethylene glycol (Fisher Scientific), PBS diluted from 10X stock solution (Mediatech, Inc., Manassas, VA, USA), RIPA buffer (Thermo Fisher Scientific), Complete protease inhibitor cocktail (Roche, Indianapolis, IN, USA), phosphatase inhibitor cocktails 2 and 3 (Sigma‐Aldrich), BSA (Sigma‐Aldrich), TBS diluted from 10X stock solution (Fisher Scientific), Odyssey blocking buffer (Li‐Cor), Tween‐20 (Bio‐Rad, Hercules, CA, USA), and donepezil hydrochloride (4385; Tocris, Minneapolis, MN, USA).
Statistics
Prism (GraphPad) was used to analyze and graph all data unless otherwise specified. CDF were generated using the integral function in Prism. Repeated‐measures mixed‐effects model analysis in Stata (StataCorp LP, College Station, TX, USA) was used to analyze the frequency band graph with multiple time points (Fig. 2E). Correlations of SYN levels with calbindin were done using linear regression. A mixed‐effects linear model in Stata was fit to the age of onset of cognitive impairment of DLB patients, as detailed in the chart review section above. Incidence rate ratios and 95% confidence intervals were calculated as described.16 Findings were considered significant at P < 0.05 and outliers in mouse analyses were defined a priori as greater than 2 SD from the mean. A Holm P‐value correction was used for multiple comparisons, as specified in the figure legends.
Results
To detect changes in spectral power distribution in DLB patients across a wide frequency range, we recorded EEGs with a high sampling frequency in human subjects (Table 2) while they were awake but had their eyes closed. Average spectral power analysis revealed the average dominant peak frequency to be in the alpha range (8–12 Hz) in control subjects and in the theta range (4–8 Hz) in DLB subjects (Fig. 2A), consistent with previous findings.2, 3 Typical EEG analysis breaks spectral power into frequency bands, but this provides a relatively poor overall view of spectral power alterations. This is especially true in DLB, in which the relative power of many frequency bands is altered.2, 3 Therefore, we analyzed the CDF of spectral power, which provides a continuous picture of the spectral power changes from 0 to 100 Hz. DLB patients showed a marked left shift in the spectral power distribution toward slower frequencies as compared to controls (Fig. 2B). Although DLB subjects had more variable total power than controls (P = 0.0006, F test), total power was not different between the groups, indicating that their altered power distribution cannot be attributed to a change in total power.
Table 2.
Human EEG cohort
| Diagnosis (n) | Control cases (8) | DLB cases (6) |
|---|---|---|
| Age (mean ± SD) | 68.4 ± 3.0 | 73.0 ± 6.6 |
| Gender (M/F) | 5/3 | 4/2 |
| Education (years) (mean ± SD) | 17.3 ± 3.0 | 19.0 ± 7.5 |
| Handedness (R/L) | 4/4 | 6/0 |
EEG, electroencephalography; DLB, Dementia with Lewy bodies; R, right‐handed; L, left‐handed.
To assess whether neuronal accumulation of SYN could causally contribute to these network abnormalities, we recorded EEGs from 4‐ to 8‐month‐old transgenic mice in which the Thy‐1 promoter directs expression of human wild‐type SYN in neurons.12, 18 At this age, these mice are cognitively impaired and show abnormal neuronal SYN accumulation in the hippocampus and cortex.12, 13 EEG and video recordings were obtained while mice were resting in a state of quiet wakefulness. Similar to humans with DLB, SYN mice showed a slowing in the dominant resting rhythm and a marked left shift in the spectral power distribution (Fig. 2C–E). This shift consisted of an increase in delta power and a decrease in the power of theta and higher frequency bands (Fig. 2C and E). Total spectral power was comparable in NTG and SYN mice, indicating that the power shift in SYN mice reflects primarily a change in power distribution.
Unexpectedly, EEGs recorded from SYN mice also revealed epileptiform spikes, multi‐spike complexes, and seizures (Fig. 3A–E). During the first 24 h of recording, 28.6% (8/28) of SYN mice and 0% (0/12) of NTG controls had at least one seizure. The seizures we observed in SYN mice were of two types. The first, more common type (Fig. 3D) had a typical electrographic seizure pattern and was usually accompanied by forelimb clonus, abnormal tonic posture, and tail extension. These seizures were typically of moderate intensity and rarely caused only behavioral arrest or escalated into full running/jumping activity. The second type of seizure (Fig. 3E), which we refer to as a myoclonic burst seizure, consisted of periodic, large amplitude spikes or multi‐spike complexes and was accompanied by myoclonic jerks typically involving the neck, shoulder, and forelimb. Myoclonic burst seizures did not usually evolve into other types of seizures. Both types of seizures symmetrically involved both hemispheres. During a 24‐h recording session, most SYN mice with seizures demonstrated only one or the other of these seizure types. Both seizure types were also observed in mice that had not undergone surgical or pharmacological manipulation (data not shown).
Figure 3.
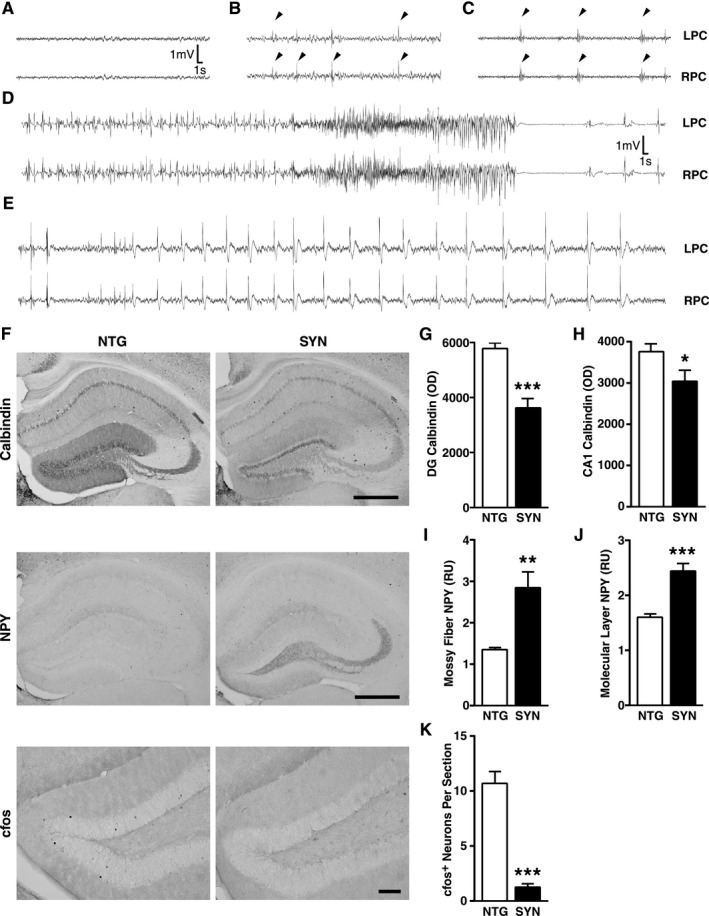
Epilepsy and related immunohistochemical alterations in SYN mice. (A–E) Representative EEG traces showing normal activity in a NTG mouse (A) and frequent epileptiform spikes (arrowheads in B), multispike complexes (arrowheads in C), a seizure (D) accompanied by tail extension and bilateral forelimb clonus (not shown), and a myoclonic burst seizure (E) in SYN mice. (F–K) Hippocampal changes in neuronal activity‐dependent proteins in SYN mice (n = 11–15 mice per genotype, age 5–7 months). Hippocampal sections from SYN and NTG mice were immunostained for calbindin, NPY, or cfos and analyzed by densitometry (calbindin/NPY) and cell counting (cfos). (F) Representative images from NTG and SYN mice. Scale bars: 0.5 mm (Calbindin/NPY) and 0.1 mm (cfos). Calbindin was measured in the molecular layer of the dentate gyrus (G) and the stratum radiatum of CA1 (H), NPY in the mossy fibers (I) and the molecular layer (J), and cfos‐positive cells in the granular layer (K). *P < 0.05, **P < 0.01, ***P < 0.001 (Student's t‐test). Quantitative values represent mean ± SEM. SYN, α‐synuclein; EEG, electroencephalography; NTG, nontransgenic; NPY, neuropeptide Y; LPC, left parietal cortex; RPC, right parietal cortex; DG, dentate gyrus; OD, optical density; RU, relative units.
We next looked for immunohistochemical changes in the hippocampus that are typically caused by epileptic activity.23, 24, 25, 26 Compared with NTG controls, SYN mice had reduced levels of calbindin in granule cells of the dentate gyrus and the stratum radiatum of CA1 (Fig. 3F–H), increased or ectopic expression of NPY in the molecular layer of the dentate gyrus and the mossy fiber pathway (Fig. 3F, I, and J), and fewer cfos‐positive granule cells (Fig. 3F and K). All these changes were seen in the presence of recurrent seizure activity.24, 25, 27 SYN accumulation in the hippocampus of SYN mice was inversely correlated with levels of calbindin in dentate granule cells (Fig. 4). An independent line of transgenic mice expressing SYN under the PDGF promoter showed similar hippocampal alterations (Fig. 5), making it unlikely that the abnormalities we detected in SYN mice were caused by insertional mutagenesis or other positional effects resulting from the integration of the transgene into the genome.
Figure 5.
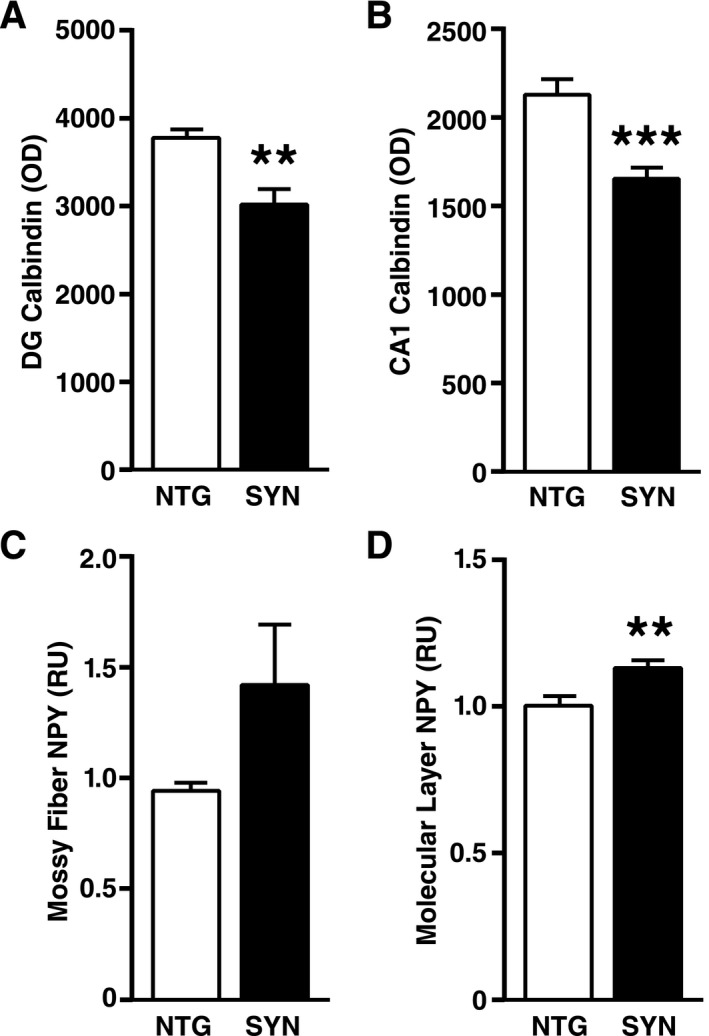
Neuronal expression of SYN directed by the PDGF promoter also causes hippocampal changes in activity‐dependent proteins in an independent line of transgenic mice. (A–D) Hippocampal sections from PDGF‐SYN mice and NTG controls were immunostained for calbindin or NPY and analyzed by densitometry (n = 8 mice per genotype). Calbindin was measured in the molecular layer of the dentate gyrus (A) and the stratum radiatum of CA1 (B), and NPY in the mossy fibers (C) and the molecular layer (D) of the dentate gyrus. **P < 0.01, ***P < 0.001 (Student's t‐test). The age of mice ranged from 3 to 17 months and was not significantly different between NTG and SYN mice (mean ± SEM: 9.1 ± 1.39 for NTG and 10.4 ± 1.75 for SYN mice, P = 0.57 by Student's t‐test). Bars represent means ± SEM. SYN, α‐synuclein; NTG, nontransgenic; NPY, neuropeptide Y; DG, dentate gyrus; OD, optical density; RU, relative units.
To determine whether epileptic activity is sufficient to cause a left shift in spectral power, we examined transgenic mice with neuronal expression of mutant hAPP from line J20.19, 26, 28, 29 These mice exhibit robust epileptic activity and have dysregulated gamma activity.22, 26 A side‐by‐side comparison of EEG recordings in SYN and hAPP mice matched for age and background strain revealed clear differences in resting spectral power. SYN mice again showed a left shift in spectral power compared to NTG littermates, whereas hAPP mice and NTG littermates showed a similar resting spectral power distribution (Fig. 6A). Therefore, neuronal expression of transgene‐derived proteins and epileptic activity are not sufficient to cause a left shift in spectral power during a resting EEG.
We next assessed more directly if epileptic activity contributed to spectral changes in SYN mice. Acute injection of phenobarbital (5 mg/kg, i.p.) decreased interictal epileptiform events by 55% but did not affect spectral power in SYN mice (Fig. 6B and C). Similarly, ablation of the microtubule‐associated protein tau, which has been shown to reduce epileptic activity in a variety of seizure models,28, 30, 31, 32, 33, 34 tended to reduce interictal events by roughly 50% but, if anything, tended to slightly increase the left shift in spectral power in SYN mice (Fig. 6D and E). Tau ablation also reduced some seizure‐related biochemical alterations in the hippocampus of SYN mice (Fig. 6F–H), although alterations in granule cell calbindin and mossy fiber NPY were not affected (data not shown). Thus, neither acute nor chronic reduction of epileptiform activity altered spectral power in SYN mice, suggesting that epileptiform activity may not be a critical cause or mediator of the left shift in spectral power.
Inhibiting cholinergic signaling in rats caused a left shift in spectral power similar to the shift we observed in untreated SYN mice.35, 36 We therefore wondered whether increasing cholinergic neurotransmission by inhibiting acetylcholinesterase might reverse spectral changes in SYN mice. Donepezil, an acetylcholinesterase inhibitor, was injected daily for 14 days at 1 mg/kg (i.p.), a dose that yields plasma drug levels similar to those observed in human clinical trials.37 EEG recordings were performed just before the treatment began (baseline), after the last injection, and after a washout period of 7 days. Donepezil did not reverse the spectral power shift in SYN mice, although there was a trend toward a right‐shift in the power distribution in both NTG and SYN mice (Fig. 6I).
Although oscillatory abnormalities in DLB patients have been well documented,2, 3 few studies have examined neural network excitability in these patients. One small study raised the possibility of an increased incidence of seizures in DLB patients38 and a second group documented cortical myoclonus, a form of cortical hyperexcitability, in DLB patients.39 To look for biochemical evidence suggestive of aberrant network excitability in these patients, we examined calbindin levels in their dentate gyrus. Patients with temporal lobe epilepsy or AD show reduced calbindin levels in dentate granule cells, and such calbindin reductions are thought to reflect aberrant hippocampal excitability.40, 41, 42 Using qRT‐PCR, we determined calbindin mRNA levels in the dentate gyrus obtained postmortem from humans with neocortical DLB pathology and low or high levels of AD pathology (Table 1). Dentate gyrus samples from AD cases and from people without neurodegenerative disease were used as positive and negative controls, respectively.41, 42 DLB cases without AD pathology showed markedly reduced levels of calbindin mRNA in the dentate gyrus, similar in extent to reductions seen in AD (Fig. 7). The most striking loss of calbindin mRNA was observed in DLB cases with a high level of AD pathology, although calbindin mRNA levels in these cases were not significantly different from those in cases with AD or DLB pathology alone (Fig. 7).
Figure 7.
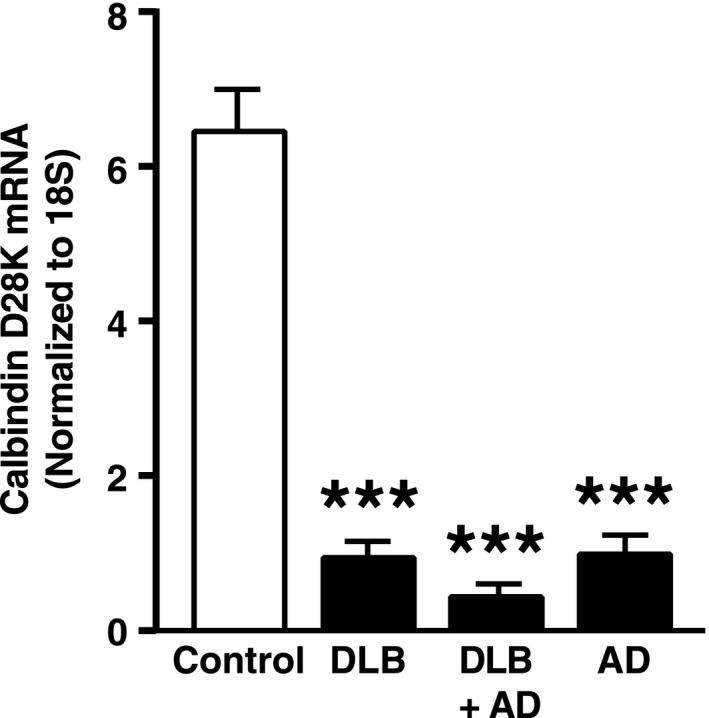
Reduction of calbindin mRNA levels in the dentate gyrus of humans with DLB and/or AD pathology. Calbindin mRNA levels in postmortem tissue samples were quantified by qRT‐PCR and normalized to 18S RNA as a loading control. n = 3 controls without neurodegenerative disease, n = 5–7 cases per disease group. In cases with DLB plus high AD pathology (DLB + AD), there was an interaction between Alzheimer's and Lewy body pathology (P < 0.001 by two‐way ANOVA). ***P < 0.001 versus control (Tukey test). Values are means ± SEM. DLB, Dementia with Lewy bodies; AD, Alzheimer's disease; ANOVA, analysis of variance.
To further assess whether aberrant network excitability may contribute to SYN‐related dementia, we reviewed the charts of patients who were seen at the UCSF Memory and Aging Center between 2007 and 2012 and who met research criteria for DLB1 (Table 3). We searched the charts for myoclonus and seizure disorders, both of which are thought to result from aberrant network excitability.39, 43, 44
Table 3.
Associations between DLB patient characteristics and age at onset of cognitive decline
| Characteristic | DLB (157) | Age at onset model (P‐value) |
|---|---|---|
| Sex (M/F) | 93/64 | 0.003 |
| Education (years) (mean ± SD)a | 15.5 ± 4.0 | 0.41 |
| Handedness (R/L/A) | 139/14/4 | 0.97 |
| Patients with fluctuations (%) | 100 (63.7%) | 0.67 |
| Patients with a seizure disorder (%) | 4 (2.5%) | 0.48 |
| Patients with myoclonus (%)b | 34 (21.7%) | 0.006 |
DLB, dementia with Lewy bodies; R, right‐handed; L, left‐handed; A, ambidextrous. Italics indicate statistical significance.
One DLB patient was missing education information.
One DLB patient had both myoclonus and a seizure disorder.
Myoclonus was noted in 21.7% (34/157) of patients with clinically diagnosed DLB, consistent with the estimated prevalence of myoclonus in pathologically confirmed cases of diffuse Lewy body disease.45 Myoclonus and male gender were associated with a lower age of onset of cognitive impairment (65.9 ± 8.22 with myoclonus, 70.74 ± 8.79 without myoclonus; 67.9 ± 8.81 male, 72.4 ± 8.32 female) in a mixed effects linear model (Table 3). The incidence of myoclonus in DLB was markedly higher than that in an age‐matched reference population (Table 4 and ref. 46).
Table 4.
Incidence of seizures and myoclonus in humans with dementia with Lewy bodies by age
Roughly 2.5% (4/157) of patients with DLB were noted to have a seizure disorder. An additional 7.6% (12/157) of DLB patients were suspected to have a seizure disorder but were not formally diagnosed. The FUS in epileptic DLB patients typically occurred near the time of dementia diagnosis (median:1 year relative to diagnosis, range:1 to +1), but was not related to the age of onset of cognitive impairment (75.3 ± 6.50 with epilepsy vs. 69.6 ± 8.89 without epilepsy). The incidence of new‐onset, unprovoked seizures in our DLB population tended to be higher than that of an age‐matched general population (Table 4 and ref. 47). However, the magnitude of the effect was difficult to evaluate due to the small number of events during the incidence study period.
Autopsies were obtained in 12 DLB patients and revealed a high diagnostic accuracy for neocortical Lewy bodies: 11 of 12 cases were confirmed pathologically; one case showed only AD pathology. Based on McKeith criteria,1 there was a high likelihood that Lewy body pathology accounted for dementia in six cases and an intermediate likelihood for the remaining five cases, which had high levels of concomitant AD pathology. Four DLB patients with myoclonus that came to autopsy all had neocortical Lewy bodies; two of them also had numerous plaques and tangles, one had a high level of plaques without tangles, and one had no appreciable AD pathology. However, the low number of autopsies precluded us from reliably assessing the relative contributions of DLB and AD pathology to clinical features.
Discussion
Our study demonstrates that neuronal overexpression of wild‐type human SYN causes a left shift in spectral power in transgenic mice that closely resembles spectral alterations in humans with DLB. A similar shift in spectral power was observed in SYN mice during both wakefulness and sleep.48 These findings support the hypothesis that accumulation of SYN, which characterizes DLB pathologically, is at least partly responsible for network dysfunction in DLB patients. We further obtained evidence for aberrant network excitability in SYN mice and in humans with DLB. Our study also suggests that the mechanisms by which SYN causes these two types of network dysfunction are at least partly distinct, although it should be noted that the interventions used in our study achieved only a partial suppression of epileptiform activity in SYN mice.
The most direct evidence for aberrant network excitability in SYN mice consisted of interictal spikes and intermittent seizures that were associated with typical alterations on EEG and in motor behavior. These functional changes were accompanied by immunohistochemical alterations in the hippocampus that typically result from aberrant network excitability, including reduced calbindin levels. In transgenic mice, hippocampal SYN levels correlated with calbindin reduction in the dentate gyrus, suggesting that aberrant network excitability is directly related to accumulation of SYN. We suspect that the aberrant network excitability in SYN mice is caused by small soluble assemblies of SYN, which are present in SYN mice at a young age,49 rather than by larger, insoluble SYN aggregates. Reduced calbindin expression in the dentate gyrus was also detected in DLB patients. Our interpretation that this biochemical alteration also reflects aberrant network excitability in humans is supported by the clinical evidence of aberrant network excitability we found in our chart review. Notably, it is likely that calbindin depletion in the hippocampus is a more sensitive indicator of aberrant network excitability then routine scalp EEG, which can easily miss intermittent epileptiform events and is notoriously insensitive to epileptic activity in deeper brain regions such as the hippocampus.50, 51
A limitation of our mouse experiments is that all spectral analyses were performed on EEG recordings obtained over the parietal cortex of resting mice. We focused on this brain region because it shows a spectral shift in DLB (Fig. 2 and ref. 3), and on resting behavior in mice to mimic human EEG conditions. Recordings from other brain regions and task‐related spectral analyses may provide additional insights into neuronal network dysfunction. For example, EEG recordings over the frontal cortex might be more suitable for assessing potential contributions of cholinergic deficits to spectral alterations in SYN mice, and analysis of individual EEG recordings in actively exploring mice could help reveal the kind of dysregulation of gamma oscillations we observed in hAPP mice.22 Additionally, our EEG recordings were limited to one transgenic line. The relevance of our neurophysiological findings to that of other transgenic mouse models of DLB warrants further investigation.
While overexpression of human SYN caused obvious seizure activity in transgenic mice, the more chronic accumulation of endogenous SYN in DLB patients may primarily cause more subtle signs of aberrant network excitability such as myoclonus. Myoclonus in DLB and PD consists of a sudden brief jerk that is accompanied by a sharp transient in the contralateral sensorimotor cortex on EEG.39, 43 This type of myoclonus, called cortical myoclonus, may be caused by aberrant cortical excitability39, 43, 44 and has been successfully treated with anti‐epileptic drugs.52, 53, 54 In our study, myoclonus was associated with an earlier age of onset of cognitive impairment, raising the possibility that aberrant network excitability may contribute to cognitive dysfunction in DLB. Interestingly, levels of SYN in the sensorimotor cortex were higher in PD patients with myoclonus than in those without.55 Increased cortical SYN pathology may also explain why myoclonus is more frequent, and is thought to be more severe, in DLB patients than in PD patients.39, 45
In patients with early AD and a seizure disorder, a substantial proportion of the seizure activity was nonconvulsive and could have easily been missed on routine exams.51 This caveat may also apply to DLB. Indeed, symptoms similar to those associated with nonconvulsive seizures, such as staring spells and disorganized speech, can occur during the episodes of fluctuating consciousness often seen in DLB patients. These episodes make it particularly difficult to distinguish between epileptic and nonepileptic symptoms. Among the DLB cases we reviewed, one of four patients with a diagnosed seizure disorder had only nonconvulsive seizures and another 10 patients were suspected to have this type of seizure. Although we compared the incidence of myoclonus and seizures to the best reference populations we could find in the literature,56 our relative rate calculations may be confounded by differences in racial and age distributions in the San Francisco Bay Area versus Rochester, Minnesota and Umeå, Sweden.46, 47 A prospective clinical study is needed to more accurately determine the incidence of seizures and myoclonus in DLB patients.
We previously identified co‐pathogenic interactions between Aβ and SYN in hAPP/SYN doubly transgenic mice57 that may be relevant to the frequent co‐occurrence of DLB and AD pathology.58, 59, 60 Because clinical assessment alone cannot reliably detect the co‐occurrence of these pathologies,59 an obvious limitation of our study is the lack of autopsy confirmation of most cases we analyzed by chart review or EEG. However, spectral slowing has been documented in autopsy‐confirmed cases of DLB61 and was confirmed here with a different approach to spectral analysis. Furthermore, the reduction in calbindin mRNA was identified in cases with pathologically confirmed DLB, AD, or both and suggests that SYN pathology is sufficient to cause aberrant network excitability. Again, a prospective study of DLB with imaging for AD pathology and/or autopsy confirmation is needed to further test this hypothesis.
In conclusion, our analysis of experimental models clearly demonstrates that SYN accumulation causes both a shift in the EEG spectrum toward slower brain oscillations as well as aberrant network excitability. We also obtained evidence suggesting that the mechanisms underlying these network effects may be at least partly distinct. While treatments targeting SYN should block both types of network dysfunction, drugs with different modes of action may have to be combined in order to block divergent branches of the SYN‐induced pathogenic cascade further downstream. Recent evidence suggests that the hyperactivation of specific neural networks may contribute to cognitive deficits in early stages of AD and that specific anti‐epileptic drugs may be able to reverse synaptic, network, and cognitive dysfunction in this condition and related models.29, 51, 62 Our study raises the possibility that network hyperexcitability may also contribute to cognitive or behavioral alterations in DLB.
Author Contributions
All authors were involved in study design and data analysis. M. M., P. S., L. V., W. G., D. D., K. G. R., K. H, G. Y., and A. K. performed experiments; M. M., A. J. B., and K. V. performed the chart review; K. V. supervised all clinical work; L. M. supervised the study; M. M., P. S., K. V., K. H., and L. M. wrote the manuscript.
Conflict of Interest
L.M. serves on the scientific advisory board of Neuropore Therapies, Inc.
Supporting information
Table S1. Mouse cohorts analyzed.
Acknowledgments
We thank Eliezer Masliah for Thy1‐SYN (line 61) transgenic mice and for brain tissues and sections from PDGF‐SYN transgenic mice, and helpful discussions; Marie‐Francoise Chesselet for Thy1‐SYN (line 61) transgenic mice on a pure C57Bl/6J background; Bruce Miller, Alexandra Nelson, and Kate Possin for helpful discussions; Heidi E. Kirsch for EEG interpretation; Srikantan Nagarajan for EEG oversight; Xin Wang, Jing Kang, Daniel Kim, Danielle Mizuiri, and Susanne M. Honma for technical support; the Gladstone Genomics Core for RNA integrity measurements; Mariel Finucane for advice on statistical analyses; John Carroll for advice on preparation of graphics; and Monica Dela Cruz and Amy Cheung for administrative assistance. This study was supported by National Institutes of Health grants K23 AG038357 (to K. A. V.) and P30 NS065780 (to L. M.), a MetLife Foundation Award (to L. M.), a gift from the S.D. Bechtel, Jr. Foundation (to L. M.), a grant from the Alzheimer's Association (PCTRB‐13‐288476) made possible by Part the Cloud™ (to K.A.V), a grant from the John Douglas French Alzheimer's Foundation (to K. A. V.), and a University of California, San Francisco AD Research Center pilot project grant (to K. A. V.). The animal care facility was partly supported by an NIH Extramural Research Facilities Improvement Program Project (C06 RR018928).
References
- 1. McKeith IG, Dickson DW, Lowe J, et al. Diagnosis and management of dementia with Lewy bodies: third report of the DLB Consortium. Neurology 2005;65:1863–1872. [DOI] [PubMed] [Google Scholar]
- 2. Andersson M, Hansson O, Minthon L, et al. Electroencephalogram variability in dementia with lewy bodies, Alzheimer's disease and controls. Dement Geriatr Cogn Disord 2008;26:284–290. [DOI] [PubMed] [Google Scholar]
- 3. Bonanni L, Thomas A, Tiraboschi P, et al. EEG comparisons in early Alzheimer's disease, dementia with Lewy bodies and Parkinson's disease with dementia patients with a 2‐year follow‐up. Brain 2008;131(Pt 3):690–705. [DOI] [PubMed] [Google Scholar]
- 4. Almkvist O, Jelic V, Amberla K, et al. Responder characteristics to a single oral dose of cholinesterase inhibitor: a double‐blind placebo‐controlled study with tacrine in Alzheimer patients. Dement Geriatr Cogn Disord 2001;12:22–32. [DOI] [PubMed] [Google Scholar]
- 5. Adler G, Brassen S, Chwalek K, et al. Prediction of treatment response to rivastigmine in Alzheimer's dementia. J Neurol Neurosurg Psychiatry 2004;75:292–294. [PMC free article] [PubMed] [Google Scholar]
- 6. Lippa CF, Smith TW, Perry E. Dementia with Lewy bodies: choline acetyltransferase parallels nucleus basalis pathology. J Neural Transm 1999;106:525–535. [DOI] [PubMed] [Google Scholar]
- 7. McKeith IG. Spectrum of Parkinson's disease, Parkinson's dementia, and Lewy body dementia. Neurol Clin 2000;18:865–902. [DOI] [PubMed] [Google Scholar]
- 8. Perry EK, Irving D, Kerwin JM, et al. Cholinergic transmitter and neurotrophic activities in Lewy body dementia: similarity to Parkinson's and distinction from Alzheimer disease. Alzheimer Dis Assoc Disord 1993;7:69–79. [DOI] [PubMed] [Google Scholar]
- 9. Possin KL, Kang GA, Guo C, et al. Rivastigmine is associated with restoration of left frontal brain activity in Parkinson's disease. Mov Disord 2013;28:1384–1390. [DOI] [PMC free article] [PubMed] [Google Scholar]
- 10. Nemani VM, Lu W, Berge V, et al. Increased expression of alpha‐synuclein reduces neurotransmitter release by inhibiting synaptic vesicle reclustering after endocytosis. Neuron 2010;65:66–79. [DOI] [PMC free article] [PubMed] [Google Scholar]
- 11. Bendor JT, Logan TP, Edwards RH. The function of alpha‐synuclein. Neuron 2013;79:1044–1066. [DOI] [PMC free article] [PubMed] [Google Scholar]
- 12. Chesselet MF, Richter F, Zhu C, et al. A progressive mouse model of Parkinson's disease: the Thy1‐aSyn (“Line 61”) mice. Neurotherapeutics 2012;9:297–314. [DOI] [PMC free article] [PubMed] [Google Scholar]
- 13. Magen I, Fleming SM, Zhu C, et al. Cognitive deficits in a mouse model of pre‐manifest Parkinson's disease. Eur J Neurosci 2012;35:870–882. [DOI] [PMC free article] [PubMed] [Google Scholar]
- 14. Sales‐Carbonell C, Rueda‐Orozco PE, Soria‐Gomez E, et al. Striatal GABAergic and cortical glutamatergic neurons mediate contrasting effects of cannabinoids on cortical network synchrony. Proc Natl Acad Sci USA 2013;110:719–724. [DOI] [PMC free article] [PubMed] [Google Scholar]
- 15. Fisher RS, van Emde Boas W, Blume W, et al. Epileptic seizures and epilepsy: definitions proposed by the International League Against Epilepsy (ILAE) and the International Bureau for Epilepsy (IBE). Epilepsia 2005;46:470–472. [DOI] [PubMed] [Google Scholar]
- 16. Rothman K, Greenland S. Modern epidemiology. 3rd ed Philadelphia: Lippincott Williams & Wilkins, 2008. [Google Scholar]
- 17. Consensus recommendations for the postmortem diagnosis of Alzheimer's disease. The National Institute on Aging, and Reagan Institute Working Group on Diagnostic Criteria for the Neuropathological Assessment of Alzheimer's Disease. Neurobiol Aging 1997;18(4 Suppl):S1–S2. [PubMed] [Google Scholar]
- 18. Rockenstein E, Mallory M, Hashimoto M, et al. Differential neuropathological alterations in transgenic mice expressing α‐synuclein from the PDGF‐B and Thy‐1 promoters. J Neurosci Res 2002;68:568–578. [DOI] [PubMed] [Google Scholar]
- 19. Mucke L, Masliah E, Yu G‐Q, et al. High‐level neuronal expression of Aβ 1‐42 in wild‐type human amyloid protein precursor transgenic mice: synaptotoxicity without plaque formation. J Neurosci 2000;20:4050–4058. [DOI] [PMC free article] [PubMed] [Google Scholar]
- 20. Dawson HN, Ferreira A, Eyster MV, et al. Inhibition of neuronal maturation in primary hippocampal neurons from tau deficient mice. J Cell Sci 2001;114:1179–1187. [DOI] [PubMed] [Google Scholar]
- 21. Kinney GG, Patino P, Mermet‐Bouvier Y, et al. Cognition‐enhancing drugs increase stimulated hippocampal theta rhythm amplitude in the urethane‐anesthetized rat. J Pharmacol Exp Ther 1999;291:99–106. [PubMed] [Google Scholar]
- 22. Verret L, Mann EO, Hang GB, et al. Inhibitory interneuron deficit links altered network activity and cognitive dysfunction in Alzheimer model. Cell 2012;149:708–721. [DOI] [PMC free article] [PubMed] [Google Scholar]
- 23. Palop JJ, Mucke L, Roberson ED. Quantifying biomarkers of cognitive dysfunction and neuronal network hyperexcitability in mouse models of Alzheimer's disease: depletion of calcium‐dependent proteins and inhibitory hippocampal remodeling. Methods Mol Biol 2011;670:245–262. [DOI] [PMC free article] [PubMed] [Google Scholar]
- 24. Miller JJ, Baimbridge KG. Biochemical and immunohistochemical correlates of kindling‐induced epilepsy: role of calcium binding protein. Brain Res 1983;278:322–326. [DOI] [PubMed] [Google Scholar]
- 25. Marksteiner J, Ortler M, Bellmann R, Sperk G. Neuropeptide Y biosynthesis is markedly induced in mossy fibers during temporal lobe epilepsy of the rat. Neurosci Lett 1990;112:143–148. [DOI] [PubMed] [Google Scholar]
- 26. Palop JJ, Chin J, Roberson ED, et al. Aberrant excitatory neuronal activity and compensatory remodeling of inhibitory hippocampal circuits in mouse models of Alzheimer's disease. Neuron 2007;55:697–711. [DOI] [PMC free article] [PubMed] [Google Scholar]
- 27. Winston SM, Hayward MD, Nestler EJ, Duman RS. Chronic electroconvulsive seizures down‐regulate expression of the immediate‐early genes c‐fos and c‐jun in rat cerebral cortex. J Neurochem 1990;54:1920–1925. [DOI] [PubMed] [Google Scholar]
- 28. Roberson ED, Halabisky B, Yoo JW, et al. Amyloid‐β/Fyn‐induced synaptic, network, and cognitive impairments depend on tau levels in multiple mouse models of Alzheimer's disease. J Neurosci 2011;31:700–711. [DOI] [PMC free article] [PubMed] [Google Scholar]
- 29. Sanchez PE, Zhu L, Verret L, et al. Levetiracetam suppresses neuronal network dysfunction and reverses synaptic and cognitive deficits in an Alzheimer's disease model. Proc Natl Acad Sci USA 2012;109:E2895–E2903. [DOI] [PMC free article] [PubMed] [Google Scholar]
- 30. Roberson ED, Scearce‐Levie K, Palop JJ, et al. Reducing endogenous tau ameliorates amyloid β‐induced deficits in an Alzheimer's disease mouse model. Science 2007;316:750–754. [DOI] [PubMed] [Google Scholar]
- 31. Ittner LM, Ke YD, Delerue F, et al. Dendritic function of tau mediates amyloid‐beta toxicity in Alzheimer's disease mouse models. Cell 2010;142:387–397. [DOI] [PubMed] [Google Scholar]
- 32. Devos SL, Goncharoff DK, Chen G, et al. Antisense reduction of tau in adult mice protects against seizures. J Neurosci 2013;33:12887–12897. [DOI] [PMC free article] [PubMed] [Google Scholar]
- 33. Holth JK, Bomben VC, Reed JG, et al. Tau loss attenuates neuronal network hyperexcitability in mouse and Drosophila genetic models of epilepsy. J Neurosci 2013;33:1651–1659. [DOI] [PMC free article] [PubMed] [Google Scholar]
- 34. Gheyara AL, Ponnusamy R, Djukic B, et al. Tau reduction prevents disease in a mouse model of Dravet syndrome. Ann Neurol 2014;76:443–456. [DOI] [PMC free article] [PubMed] [Google Scholar]
- 35. Buzsaki G, Bickford RG, Ponomareff G, et al. Nucleus basalis and thalamic control of neocortical activity in the freely moving rat. J Neurosci 1988;8:4007–4026. [DOI] [PMC free article] [PubMed] [Google Scholar]
- 36. Riekkinen P Jr, Riekkinen M, Sirvio J, et al. Loss of cholinergic neurons in the nucleus basalis induces neocortical electroencephalographic and passive avoidance deficits. Neuroscience 1992;47:823–831. [DOI] [PubMed] [Google Scholar]
- 37. Dong H, Yuede CM, Coughlan CA, et al. Effects of donepezil on amyloid‐beta and synapse density in the Tg2576 mouse model of Alzheimer's disease. Brain Res 2009;1303:169–178. [DOI] [PMC free article] [PubMed] [Google Scholar]
- 38. Weiner MF, Hynan LS, Parikh B, et al. Can Alzheimer's disease and dementias with Lewy bodies be distinguished clinically? J Geriatr Psychiatry Neurol 2003;16:245–250. [DOI] [PubMed] [Google Scholar]
- 39. Caviness JN, Adler CH, Caselli RJ, Hernandez JL. Electrophysiology of the myoclonus in dementia with Lewy bodies. Neurology 2003;60:523–524. [DOI] [PubMed] [Google Scholar]
- 40. Magloczky Z, Halasz P, Vajda J, et al. Loss of calbindin‐D28K immunoreactivity from dentate granule cells in human temporal lobe epilepsy. Neuroscience 1997;76:377–385. [DOI] [PubMed] [Google Scholar]
- 41. Palop JJ, Jones B, Kekonius L, et al. Neuronal depletion of calcium‐dependent proteins in the dentate gyrus is tightly linked to Alzheimer's disease‐related cognitive deficits. Proc Natl Acad Sci USA 2003;100:9572–9577. [DOI] [PMC free article] [PubMed] [Google Scholar]
- 42. Bandopadhyay R, Liu JY, Sisodiya SM, Thom M. A comparative study of the dentate gyrus in hippocampal sclerosis in epilepsy and dementia. Neuropathol Appl Neurobiol 2014;40:177–190. [DOI] [PMC free article] [PubMed] [Google Scholar]
- 43. Caviness JN, Adler CH, Beach TG, et al. Small‐amplitude cortical myoclonus in Parkinson's disease: physiology and clinical observations. Mov Disord 2002;17:657–662. [DOI] [PubMed] [Google Scholar]
- 44. Kojovic M, Cordivari C, Bhatia K. Myoclonic disorders: a practical approach for diagnosis and treatment. Ther Adv Neurol Disord 2011;4:47–62. [DOI] [PMC free article] [PubMed] [Google Scholar]
- 45. Louis ED, Klatka LA, Liu Y, Fahn S. Comparison of extrapyramidal features in 31 pathologically confirmed cases of diffuse Lewy body disease and 34 pathologically confirmed cases of Parkinson's disease. Neurology 1997;48:376–380. [DOI] [PubMed] [Google Scholar]
- 46. Caviness JN, Alving LI, Maraganore DM, et al. The incidence and prevalence of myoclonus in Olmsted County, Minnesota. Mayo Clin Proc 1999;74:565–569. [DOI] [PubMed] [Google Scholar]
- 47. Forsgren L, Bucht G, Eriksson S, Bergmark L. Incidence and clinical characterization of unprovoked seizures in adults: a prospective population‐based study. Epilepsia 1996;37:224–229. [DOI] [PubMed] [Google Scholar]
- 48. McDowell KA, Shin D, Roos KP, Chesselet MF. Sleep dysfunction and EEG alterations in mice overexpressing alpha‐synuclein. J Parkinsons Dis 2014;4:531–539. [DOI] [PMC free article] [PubMed] [Google Scholar]
- 49. Rockenstein E, Nuber S, Overk CR, et al. Accumulation of oligomer‐prone alpha‐synuclein exacerbates synaptic and neuronal degeneration in vivo. Brain 2014;137(Pt 5):1496–1513. [DOI] [PMC free article] [PubMed] [Google Scholar]
- 50. Pillai J, Sperling MR. Interictal EEG and the diagnosis of epilepsy. Epilepsia 2006;47(Suppl 1):14–22. [DOI] [PubMed] [Google Scholar]
- 51. Vossel KA, Beagle AJ, Rabinovici GD, et al. Seizures and epileptiform activity in the early stages of Alzheimer disease. JAMA Neurol 2013;70:1158–1166. [DOI] [PMC free article] [PubMed] [Google Scholar]
- 52. Brown P, Steiger MJ, Thompson PD, et al. Effectiveness of piracetam in cortical myoclonus. Mov Disord 1993;8:63–68. [DOI] [PubMed] [Google Scholar]
- 53. Ikeda A, Shibasaki H, Tashiro K, et al. Clinical trial of piracetam in patients with myoclonus: nationwide multiinstitution study in Japan. The Myoclonus/Piracetam Study Group. Mov Disord 1996;11:691–700. [DOI] [PubMed] [Google Scholar]
- 54. Frucht SJ, Louis ED, Chuang C, Fahn S. A pilot tolerability and efficacy study of levetiracetam in patients with chronic myoclonus. Neurology 2001;57:1112–1114. [DOI] [PubMed] [Google Scholar]
- 55. Caviness JN, Lue LF, Beach TG, et al. Parkinson's disease, cortical dysfunction, and alpha‐synuclein. Mov Disord 2011;26:1436–1442. [DOI] [PMC free article] [PubMed] [Google Scholar]
- 56. Kotsopoulos IA, van Merode T, Kessels FG, et al. Systematic review and meta‐analysis of incidence studies of epilepsy and unprovoked seizures. Epilepsia 2002;43:1402–1409. [DOI] [PubMed] [Google Scholar]
- 57. Masliah E, Rockenstein E, Veinbergs I, et al. β‐Amyloid peptides enhance α‐synuclein accumulation and neuronal deficits in a transgenic mouse model linking Alzheimer's disease and Parkinson's disease. Proc Natl Acad Sci USA 2001;98:12245–12250. [DOI] [PMC free article] [PubMed] [Google Scholar]
- 58. Del Ser T, Hachinski V, Merskey H, Munoz DG. Clinical and pathologic features of two groups of patients with dementia with Lewy bodies: effect of coexisting Alzheimer‐type lesion load. Alzheimer Dis Assoc Disord 2001;15:31–44. [DOI] [PubMed] [Google Scholar]
- 59. Merdes AR, Hansen LA, Jeste DV, et al. Influence of Alzheimer pathology on clinical diagnostic accuracy in dementia with Lewy bodies. Neurology 2003;60:1586–1590. [DOI] [PubMed] [Google Scholar]
- 60. Hamilton RL. Lewy bodies in Alzheimer's disease: a neuropathological review of 145 cases using a‐synuclein immunohistochemistry. Brain Pathol 2000;10:378–384. [DOI] [PMC free article] [PubMed] [Google Scholar]
- 61. Briel RCG, McKeith IG, Barker WA, et al. EEG findings in dementia with Lewy bodies and Alzheimer's disease. J Neurol Neurosurg Psychiatry 1999;66:401–403. [DOI] [PMC free article] [PubMed] [Google Scholar]
- 62. Bakker A, Krauss GL, Albert MS, et al. Reduction of hippocampal hyperactivity improves cognition in amnestic mild cognitive impairment. Neuron 2012;74:467–474. [DOI] [PMC free article] [PubMed] [Google Scholar]
Associated Data
This section collects any data citations, data availability statements, or supplementary materials included in this article.
Supplementary Materials
Table S1. Mouse cohorts analyzed.