

Abstract
Objective
To assess whether, 5 years into the HITECH programs, national data reflect a consistent relationship between EHR adoption and hospital outcomes across three important dimensions of hospital performance.
Data Sources/Study Setting
Secondary data from the American Hospital Association and CMS (Hospital Compare and EHR Incentive Programs) for nonfederal, acute‐care hospitals (2009–2012).
Study Design
We examined the relationship between EHR adoption and three hospital outcomes (process adherence, patient satisfaction, efficiency) using ordinary least squares models with hospital fixed effects. Time‐related effects were assessed through comparing the impact of EHR adoption pre (2008/2009) versus post (2010/2011) meaningful use and by meaningful use attestation cohort (2011, 2012, 2013, Never). We used a continuous measure of hospital EHR adoption based on the proportion of electronic functions implemented.
Data Collection/Extraction Methods
We created a panel dataset with hospital‐year observations.
Principal Findings
Higher levels of EHR adoption were associated with better performance on process adherence (0.147; p < .001) and patient satisfaction (0.118; p < .001), but not efficiency (0.01; p = .78). For all three outcomes, there was a stronger, positive relationship between EHR adoption and performance in 2010/2011 compared to 2008/2009. We found mixed results based on meaningful use attestation cohort.
Conclusions
Performance gains associated with EHR adoption are apparent in more recent years. The large national investment in EHRs appears to be delivering more consistent benefits than indicated by earlier national studies.
Keywords: Health care organizations and systems, hospitals, information technology
Over the past 5 years, there has been a substantial investment of both public and private funds to increase the adoption of electronic health records (EHRs) in hospitals and physician practices across the country. The public investment comes in the form of financial incentives from Medicare and Medicaid for hospitals and physicians that adopt specific EHR functions and use them to meet federally defined meaningful use (MU) criteria. The initial stage of meaningful use criteria (“stage 1”) focused on electronic capture of key data—such as vitals and smoking status—as well as some advanced functions like computerized entry of medication orders. The public investment was premised on the assumption, and compelling empirical evidence from leading delivery systems (Chaudhry et al. 2006), that EHRs used in these ways would enable health care delivery organizations to improve the quality and efficiency of care. However, as the evidence expanded to include national studies, the findings became inconsistent as to whether hospital EHR adoption translates into higher quality, lower cost care. Studies typically found small improvements in some outcomes, no impact for many, and small worsening in a few (Parente and McCullough 2009; DesRoches et al. 2010; Jones et al. 2010; Appari et al. 2012; McCullough, Parente, and Town 2013). This has caused concern that the increased EHR adoption resulting from the federal incentives (Adler‐Milstein et al. 2014) may not produce the anticipated performance gains (Soumerai and Mahjumdar 2009).
The current evidence largely reflects the experiences of hospitals prior to meaningful use and complementary federal programs intended to support effective EHR implementation (Blumenthal 2010). Now, 5 years into these efforts, it is possible that the U.S. health care system may be realizing more consistent performance improvement from EHRs as a result of several time‐related effects. The first time‐related effect is that EHR functions with more consistent benefits (i.e., clinical decision support and computerized provider order entry) (Kaushal, Shojania, and Bates 2003; Garg et al. 2005) are typically adopted after core EHR functions (Adler‐Milstein, Everson, and Lee 2014). And, because these functions with more consistent benefits were emphasized in stage 1 meaningful use (Blumenthal and Tavenner 2010), increases in EHR function adoption in the more recent past, compared to increases earlier on, should reflect greater benefits. We treat this as a time‐related effect because hospitals typically add EHR functions over time, but, in fact, this captures part of the “main effect” of EHR adoption because these functions comprise an EHR.
Second, industry‐wide factors may enable hospitals that adopt EHR functions in the more recent past to realize greater performance gains than hospitals that adopted those same functions earlier on. The greater gains may be a result of improvements in the underlying technology and more extensive knowledge about how to implement EHR functions in ways that avoid common pitfalls and more consistently deliver benefits (“improvements in EHR technology and implementation”). Improvements in technology likely derive from vendor maturity as well as the federal EHR certification process that was introduced alongside the meaningful use program. Accumulated experience of EHR vendors as well as organizations that specialize in helping hospitals implement EHRs—for example, Regional Extension Centers (Maxson et al. 2010) and consulting firms—may help later adopters avoid unintended negative consequences and promote more effective EHR use. While there continue to be concerns about the quality of EHRs—particularly their usability (Middleton et al. 2013)—relative improvement to exceed a set of common certification standards may have enabled more consistent realization of benefits.
Both of these factors would produce more consistent and greater performance benefits compared to equivalent increases in EHR function adoption earlier on. A third and distinct type of time‐related effect derives from individual hospital experience with EHRs (“organizational experience with EHRs”). The longer that a hospital has been working with EHR functions, the more likely it is to have gained intraorganizational experience that can be applied to implementation of future EHR functions and increase the resulting benefits (Zhou et al. 2009; Campbell 2012). For example, the hospital may have established change management processes, and hospital staff may have greater technological familiarity (Brynjolfsson 1993). This would suggest that a hospital that adds EHR functions would be more likely to reap performance gains from those functions if it has a longer track record of EHR experience.
These phenomena point to the need to examine different types of time‐related effects of increased EHR adoption on the quality and efficiency of hospitals over a multiyear timeframe that includes the period following the initiation of the meaningful use program. We therefore studied the relationship between hospital EHR adoption and a range of key outcomes using the most recently available national data. We included process adherence, patient satisfaction, and efficiency outcomes to capture different dimensions of value that may be generated from EHR use. EHR adoption may result in improved process adherence because many EHR functions (e.g., order sets and clinical decision support) directly promote process adherence, and because better access to patient clinical information facilitated by EHRs may make it easier to identify process gaps (Garg et al. 2005; Chaudhry et al. 2006). EHR adoption may result in improved patient satisfaction because EHRs facilitate better access to patient clinical information, decreasing the amount of time clinicians spend on information searching and allowing more time for clinicians to meet patient care needs and communicate with patients (Kazley et al. 2012). Finally, EHR adoption may result in improved efficiency because it could enable a reduction in both personnel and nonpersonnel expenses, particularly those related to medical records management (Dranove et al. 2012).
While a growing number of studies fail to find evidence of such benefits, for the reasons described above we expected that the relationship between EHR adoption and outcomes would improve in more recent years compared to earlier years (i.e., absolute time‐related effects), as well as for hospitals with a longer period of EHR experience (i.e., relative time‐related effects). We examined the first type of time‐related effect using calendar year to assess whether adoption of more EHR functions in 2010/2011 was associated with greater benefit than adoption of more EHR functions in 2008/2009. We examined the second type of time‐related effect by using cohorts of meaningful use attesters to assess whether the longer the hospital had been using EHR functions (i.e., the earlier they first attested to meaningful use), the greater the benefit. Departing from previous research that defines EHR adoption according to whether or not a specific set of electronic functions comprising a “basic” or “comprehensive” EHR is implemented (DesRoches et al. 2010; Jones et al. 2010; Appari, Eric Johnson, and Anthony 2012), thereby treating a hospital that has all but one specified EHR function the same as a hospital that has fewer of the specified functions, we used a continuous measure that captures the proportion of EHR functions a hospital has in place. Our study addresses the following research questions: (1) Is greater adoption of EHR functions associated with better hospital performance, and does the association vary across performance domains? (2) Is there a stronger relationship between the extent of EHR adoption and hospital performance in the years following the initiation of the meaningful use incentive program compared to the years prior to the program? (3) Is there a stronger relationship between the extent of EHR adoption and hospital performance for hospitals that used key EHR functions for a longer period of time? Overall, our findings inform the question of whether the large public investment in EHRs is beginning to pay off, and how benefits are impacted by different types of time‐related effects.
Methods
Data and Sample
Our national sample consisted of nonfederal, acute‐care hospitals in 50 states and the District of Columbia. We used data from four sources. First, data on hospital adoption of EHR functions were drawn from the American Hospital Association's IT Supplement Survey from 2008 to 2011. Second, data on hospital characteristics were drawn from the AHA Annual survey for the same years. We also relied on AHA Annual survey data for one of our outcome measures (hospital efficiency); we used 2009–2012 Annual surveys to enable a 1‐year lag between extent of EHR adoption and outcomes. Our third source of data was CMS's Hospital Compare, also for the years 2009–2012, which we used for two additional outcome measures: process adherence and patient satisfaction. Finally, data on hospital attestation to stage 1 meaningful use and case mix index were drawn from CMS ' EHR Incentive Program reports.
Measures: EHR Adoption
Each year, the AHA IT Supplement asks hospitals to report the extent of adoption of each of 28 EHR functions. These functions fall into five categories: clinical documentation, results viewing, computerized order entry, decision support, and bar coding. Respondents indicate whether each function is implemented in all units, implemented in at least one unit, or in some stage of planning. These 28 items have been shown to reliably and validly measure hospital adoption of EHRs (Everson, Lee, and Friedman 2014).
For our primary analysis, we created a continuous EHR adoption measure for each hospital in each year in which they responded to the AHA IT Supplement. The continuous measure was constructed as follows: for each function that was implemented in all units, a hospital received two points, and for each function that was implemented in at least one unit, a hospital received one point. Therefore, the total possible EHR adoption score ranged from 0 to 56. To improve interpretability, we rescaled our measure to 0–1 by dividing each hospital's total score by 56.
To enable comparability to prior work that uses the dichotomous measure of whether or not hospitals had adopted at least a basic EHR, we report the relationships between our continuous measure of EHR adoption and our focal outcomes based on the marginal effect of moving from 0.42 to 0.77 on our 0–1 scale, which represents moving from the average EHR function adoption among hospitals with less than a basic EHR to the average among those with at least a basic EHR. (See Table A1 for a more detailed comparison of the two types of EHR adoption measures and Table A2 for sensitivity analyses using different scoring methods in the online Appendix.)
Measures: Meaningful Use Attestation
To determine whether or not hospitals had met the CMS requirements for stage 1 MU, and in which year they first attested, we matched CMS publicly reported attestation data for hospitals in the Medicare EHR Incentive Program to the AHA database. We matched the data using hospital NPI and then, for the subset of hospitals missing NPI, we matched using hospital address, nine‐digit zip code, and name. Only 25 of the 3,807 (0.7 percent) hospitals that attested were not successfully matched to the AHA data. We classified hospitals into four groups based on the earliest year of attestation: those who first attested in 2011, those who first attested in 2012, those who first attested in 2013, and those who had not yet attested during our study period.
Measures: Hospital Performance
Our selection of process adherence measures from Hospital Compare was guided by the 2013 CMS Value Based Purchasing (VBP) rule, which excluded 10 of 22 available measures because CMS determined that these measures reached a ceiling where almost all hospitals reported near‐perfect performance. Of the 12 remaining measures, we included only the nine measures for which more than half of hospitals that responded to the AHA IT Supplement also reported data to CMS (CMS 2012) (Table A3). EHRs are likely to improve these process measures by promoting adherence to some or all of the key steps they involve. For example, discharge instructions could be automatically generated from EHR data, an order set could be populated with proper preoperative antibiotics, a reminder could alert clinicians to the need to perform blood cultures in the ED, and medication documentation could make it clearer that appropriate venous thromboembolism prophylaxis was ordered prior to surgery. More generally, EHRs can improve communication within the clinical team to ensure that there is a clear understanding of who is responsible for process completion (e.g., via task lists) as well as make it clear when one or more measures have not been met for an eligible patient (e.g., via an indicator on a dashboard).
Because the nine measures exhibited high intercorrelations, we created a composite scale, which had high reliability (alphas ranging from 0.74 in 2009 to 0.78 in 2012). We took the natural log of each measure to reduce the skewness, standardized the measures across all years to facilitate the creation of a scale (by subtracting the measure's overall mean and dividing the value by the standard deviation of the measure), summed the standardized values for each hospital in each year, and finally divided the sum by the number of measures for which each hospital provided data in each year (mean item response rate = 7.8 of 9 measures). While we assumed measures that were not reported were a result of valid exclusion criteria (e.g., no patients for whom the measure applies), it is also possible that hospitals chose not to report specific measures. However, hospitals risked forgoing reimbursement available through CMS's Hospital Inpatient Quality Initiative if they chose not to report their data. Therefore, it is unlikely that they would fail to report measures for which there are no valid exclusion criteria.
Our measure of patient satisfaction closely followed CMS's VBP approach. We created a composite patient satisfaction measure using the percent of respondents who gave each hospital a top score on eight measures from the Hospital Consumer Assessment of Healthcare and Provider Systems survey, which is gathered as part of the Hospital Compare program. These measures were each standardized across all years and summed within each year to create a composite score, which exhibited high reliability (alphas ranging from 0.92 in 2012 to 0.93 in 2009). We divided the composite score by the number of measures for which each hospital provided data in each year to further standardize the scale by completeness of reporting (mean item response rate = 7.99 of 8 measures).
Our efficiency measure, derived from AHA data, was based on prior studies (Succi, Lee, and Alexander 1997; Lee and Alexander 1999) and was defined as the ratio of a hospital's total expenditures to adjusted patient days. Total expenditures included all payroll and nonpayroll expenses and we used them as a proxy for operating costs. Adjusted patient days were the sum of the number of inpatient days and the number of outpatient visits, multiplied by the ratio of outpatient revenue per outpatient visit to inpatient revenue per inpatient day as an adjustment for the higher intensity of care delivered in inpatient stays. Our efficiency measure is therefore intended to capture productivity, or cost per unit of output. We took the natural log of this measure to reduce the skewness of the distribution and then standardized it to be consistent with the approach used to create our other measures.
Measures: Control Variables
We used AHA data to create a set of hospital‐level control measures that could vary over time and confound the relationship between the extent of EHR adoption and our outcome measures. These included the case mix index (CMI), hospital market share (measured by the proportion of hospital beds controlled by the focal hospital in the hospital referral region), hospital size (small [0–99 beds], medium [100–399 beds], and large [400+ beds]), teaching status (major, minor, and nonteaching), ownership (public, private for‐profit, and private not‐for‐profit), system membership (yes vs. no), and network membership (yes vs. no).
Models
We first examined the relationship between EHR adoption and our three outcome measures using an ordinary least squares model with hospital‐ and year‐level fixed effects and time‐varying control variables. Following other studies examining the impact of health IT adoption on hospital performance (Appari, Eric Johnson, and Anthony 2012; Lammers, Adler‐Milstein, and Kocher 2014), we lagged the EHR adoption measure by 1 year such that the extent of EHR adoption in a given year was related to process, patient satisfaction, and efficiency measures in the following year. We considered examining additional lags but decided against it because we empirically observed EHR function adoption changing from year to year within hospitals. To help visualize the relative impact of EHR adoption on each outcome, we computed the overall average predicted value of each outcome across all years at an EHR adoption level of 0.42 (the mean for hospitals with less than a basic EHR) and 0.77 (the mean for hospitals with at least a basic EHR), with all control variables set at their means, and plotted the results.
Next, to assess whether the effect of EHR adoption increased over time, we examined the independent effect of EHR adoption in the first 2 years of our time period (2008/2009) and in the second 2 years of our time period (2010/2011). We used the same model described above and added an interaction effect for the time period. We then performed an F‐test to assess whether the coefficients on our EHR adoption measure were significantly different between the two periods. We hypothesized that the effect in 2010/2011 would be significantly greater than in 2008/2009 for all outcome measures.
Finally, we examined whether the effect of EHR adoption differed by stage 1 MU attestation cohort using the same base model and then interacting the effect of EHR adoption with the four attestation cohorts. We used F‐tests to assess whether the coefficients on the interaction terms were significantly different from each other. We assumed that earlier attestation cohorts were those with greater EHR experience and hypothesized that the earliest cohorts—those who first attested in 2011 and 2012—would experience a stronger positive relationship between EHR adoption and outcomes than hospitals that first attested in the later cohort (2013) and the cohort that never attested during our study period.
For each model, the sample size varied because not all hospitals provided full data to CMS and responded to the AHA IT supplement in all years. For instance, in 2011, 2,606 of 4,635 (56 percent) hospitals in the AHA Annual Survey responded to the IT Supplement. Of these, 2,227 (87 percent) provided 2012 data on one or more hospital process measures, 2,171 (83 percent) provided 2012 data on one or more patient satisfaction measures, and 2,583 (99 percent) provided 2012 data on efficiency. Our smallest sample size was 9,328 hospital‐year observations for estimates of patient satisfaction, and our largest was 11,363 for estimates of efficiency.
Results
Table 1 and Table A4 report summary statistics for our sample. In general, the values of our main dependent and independent variables increased over time. In 2008, hospitals had, on average, adopted 12.2 of the 28 EHR functions (43.7 percent on our scaled measure) and by 2011, hospitals had, on average, adopted 16.4 of the 28 functions (58.5 percent). The average process adherence composite measure before transformation was 88.2 percent (−0.25 on our log‐standardized scale) in 2009 and reached 94.4 percent (0.39) in 2012. For patient satisfaction, the average composite measure was 70.2 percent (−0.15 on the standardized scale) in 2009 and was 73.6 percent (0.34) in 2012. Finally, our efficiency measure was $1,685 per adjusted patient day on average (−0.04 on the log‐standardized scale) in 2009 and was $1,930 (0.14) in 2012.
Table 1.
Summary Statistics of Hospital Characteristics
| Year 1 | Year 2 | Year 3 | Year 4 | |||||
|---|---|---|---|---|---|---|---|---|
| Obs. | Mean | Obs. | Mean | Obs. | Mean | Obs. | Mean | |
| Process score composite | 2,528 | −0.245 | 2,820 | −0.017 | 2,579 | 0.231 | 2,227 | 0.389 |
| Patient satisfaction composite | 2,253 | −0.146 | 2,489 | 0.046 | 2,416 | 0.162 | 2,171 | 0.343 |
| Efficiency (expenditures per adjusted patient day) | 2,792 | 1,685.6 | 3,085 | 1,700 | 2,906 | 1,804.3 | 2,583 | 1,929.7 |
| EHR adoption (percent of functions) | 2,797 | 0.437 | 3,094 | 0.46 | 2,906 | 0.5 | 2,591 | 0.585 |
| Continuous control variables, 2011a | ||||||||
| Case mix index | 1,800 | 1.48 | ||||||
| System market share | 2,590 | 0.123 | ||||||
| Obs. | Percent | |||||||
|---|---|---|---|---|---|---|---|---|
| Categorical control variables, 2011a | ||||||||
| Hospital size | ||||||||
| 0–99 beds | 1,218 | 47.0 | ||||||
| 100–399 beds | 1,060 | 40.9 | ||||||
| 400 + beds | 313 | 12.1 | ||||||
| Teaching status | ||||||||
| Major teaching | 203 | 7.8 | ||||||
| Minor teaching | 522 | 20.2 | ||||||
| Not teaching | 1,866 | 72.2 | ||||||
| System membership | ||||||||
| Yes | 1,378 | 53.2 | ||||||
| No | 1,213 | 46.8 | ||||||
| Network membership | ||||||||
| Yes | 899 | 34.7 | ||||||
| No | 1,692 | 65.3 | ||||||
| Ownership | ||||||||
| Public | 663 | 25.6 | ||||||
| Private, nonprofit | 1,656 | 63.9 | ||||||
| Private, for‐profit | 272 | 10.5 | ||||||
| Location | ||||||||
| Rural | 1,166 | 45 | ||||||
| Urban | 1,425 | 55 | ||||||
| Earliest stage 1 meaningful use attestation year | ||||||||
| Never | 519 | 20.0 | ||||||
| 2011 (cohort 1) | 469 | 18.1 | ||||||
| 2012 (cohort 2) | 972 | 37.5 | ||||||
| 2013 (cohort 3) | 631 | 24.4 | ||||||
Reported for hospitals that responded to the AHA IT supplement in 2011 and provided at least one outcome variable in 2011. Years 1‐4 correspond to calendar years 2009‐2012 for all outcomes and to calendar years 2008‐2011 for EHR adoption and all control variables.
When we examined the relationship between the extent of EHR adoption and our outcomes of interest, we found evidence that greater EHR adoption was associated with better performance for the process adherence composite and the patient satisfaction composite. Moving from none to full EHR adoption (a one‐unit increase) was associated with an increase of 0.15 (p = .001, Table 2) on the process composite measure. Moving from less than basic to basic EHR was associated with an increase of 0.05, equivalent to 7.3 percent of a standard deviation (Figure 1). A one‐unit increase in EHR adoption was associated with an increase of 0.12 on the patient satisfaction composite (p < .001, Table 2). Moving from less than basic to basic EHR was associated with an increase of 0.041, equivalent to 5.5 percent of a standard deviation (Figure 1). We did not find evidence of an effect on efficiency (coefficient = 0.01; p = .784, Table 2 and Figure 1). Relationships for individual process and patient satisfaction measures are reported in Table A5.
Table 2.
Relationship between EHR Adoption and Hospital Outcomes: Full Model
| Process Compositea | Patient Satisfaction Compositeb | Efficiencyc | |
|---|---|---|---|
| EHR adoption | 0.147*** (0.0455) | 0.118*** (0.0268) | 0.00628 (0.0229) |
| CMI | 0.0891 (0.136) | 0.0287 (0.0758) | 0.535*** (0.126) |
| Market share | −0.195 (0.568) | −0.277 (0.303) | −0.877*** (0.282) |
| Market share squared | 0.0940 (0.815) | 0.177 (0.377) | 1.197*** (0.442) |
| 2009 | 0.245*** (0.0132) | 0.174*** (0.00920) | 0.0357*** (0.00753) |
| 2010 | 0.489*** (0.0153) | 0.268*** (0.0107) | 0.0808*** (0.00923) |
| 2011 | 0.639*** (0.0221) | 0.430*** (0.0123) | 0.169*** (0.0113) |
| Medium | 0.0547 (0.0793) | −0.0224 (0.0401) | −0.105* (0.0621) |
| Large | 0.115 (0.0948) | 0.0597 (0.0532) | −0.102 (0.0749) |
| Minor teaching | −0.0706 (0.0449) | 0.0280 (0.0257) | 0.0285 (0.0195) |
| Major teaching | −0.00826 (0.0925) | 0.000870 (0.0695) | −0.0171 (0.0170) |
| System membership | 0.0287 (0.0546) | −0.0527 (0.0331) | −0.00440 (0.0306) |
| Nonprofit | −0.0701 (0.0957) | 0.0638 (0.0603) | 0.00466 (0.0551) |
| For‐profit | −0.121 (0.153) | −0.102 (0.0795) | −0.0618 (0.0887) |
| Network membership | −0.0645* (0.0357) | 0.0189 (0.0227) | −0.0215 (0.0199) |
| Constant | −0.390* (0.214) | −0.203* (0.121) | −0.646*** (0.175) |
| Observationsd | 10,152 | 9,327 | 11,363 |
| R 2 | 0.229 | 0.277 | 0.091 |
| Number of hospitals | 3,798 | 3,401 | 4,135 |
The Process measure is a composite of 10 process measures drawn from CMS's Hospital Compare data that have been log‐transformed to reduce skew and standardized.
Patient satisfaction is a composite of the Hospital Consumer Assessment of Healthcare Providers and Systems, including measures of Communication with Nurses, Communication with Doctors, Responsiveness of Hospital Staff, Pain Management, Cleanliness and Quietness of Hospital Environment, Communication about Medicines, Discharge Information, and Overall Rating of Hospital.
Efficiency is measured as the total expenditures per adjusted patient day.
The number of observations for each model varies due to the number of respondents to each outcome measure.
***p < .01, *p < .10.
Figure 1.
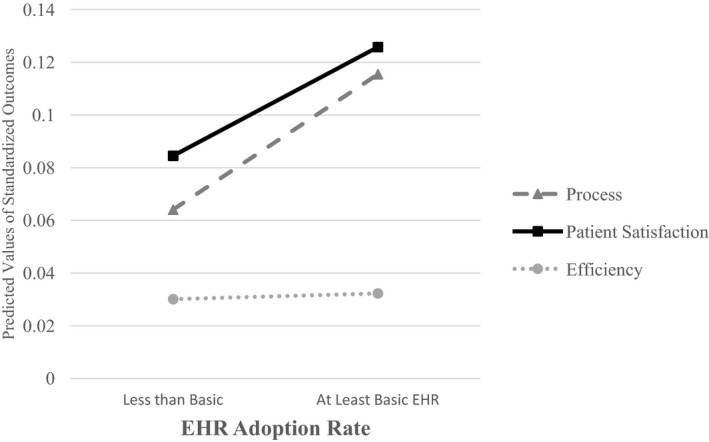
- Notes: Outcome values are predicted at 0.42 and 0.77 on our EHR adoption scale (the average of hospitals with less than basic EHR and at least basic EHR, respectively), with all control variables set at their mean.
When we examined whether the relationship between the extent of EHR adoption and our outcomes varied based on the year of EHR adoption, we found results consistent with our hypothesis for all three measures (Table 3). A one‐unit increase in EHR adoption was not associated with higher process adherence in 2008/2009 (coefficient = 0.06; p = .186; all reported years correspond to the year of EHR adoption, which lags one year behind the outcome year.) but was associated with higher process adherence in 2010/2011 (coefficient = 0.22; p < .001). Moving from less than basic EHR to basic EHR was associated with an increase in the process adherence composite measure of 0.02 in 2008/2009, compared to an increase of 0.08, or 10.8 percent of a standard deviation in 2010/2011. These regression coefficients were significant different from each other (F(1, 3797) = 7.44, p = .006).
Table 3.
Relationship between EHR Adoption and Hospital Outcomes: Pre (2008/2009) and Post (2010/2011) Meaningful Use
| Process Compositea | Patient Satisfaction Compositeb | Efficiencyc | |
|---|---|---|---|
| EHR adoption×2008 and 2009 | 0.0672 | 0.0259 | 0.0810*** |
| EHR adoption×2010 and 2011 | 0.218*** | 0.196*** | −0.0541** |
| Hospital fixed effects | Included | Included | Included |
| Hospital covariates | Included | Included | Included |
| Observationsd | 10,153 | 9,328 | 11,363 |
| F‐test (p‐value) comparing | |||
| 2008/2009 to 2010/2011 | 7.44 (0.0064) | 26.06 (<0.001) | 22.83 (<0.001) |
Covariates include hospital case mix index, market share, size, teaching status, system membership, network membership, ownership, year, and hospital fixed effects. Standard errors are clustered at the hospital level.
The Process measure is a composite of 10 process measures drawn from CMS's Hospital Compare data that have been log‐transformed to reduce skew and standardized.
Patient satisfaction is a composite of the Hospital Consumer Assessment of Healthcare Providers and Systems, including measures of Communication with Nurses, Communication with Doctors, Responsiveness of Hospital Staff, Pain Management, Cleanliness and Quietness of Hospital Environment, Communication about Medicines, Discharge Information, and Overall Rating of Hospital.
Efficiency is measured as the total expenditures per adjusted patient day.
The number of observations for each model varies due to the number of respondents to each outcome measure.
***p < .01, **p < .05. All reported years correspond to the year of EHR adoption, which lags one year behind the outcome year.
We found similar results for the patient satisfaction composite: there was no significant relationship between a one‐unit increase in EHR adoption and patient satisfaction in 2008/2009 (coefficient = 0.03; p = .422 Table 3), but there was a relationship in 2010/2011 (coefficient = 0.20; p < .001). An increase in EHR adoption from less than basic to basic was associated with an increase of 0.01 in 2008/2009, compared to an increase of 0.07, or 9.2 percent of a standard deviation in 2010/2011. Again, these coefficients were significantly different from each other (F(1, 3400) = 26.06, p < .001).
For the efficiency measure, a one‐unit increase in EHR adoption was associated with significantly worse efficiency (coefficient = 0.081; p = .002, Table 3) in 2008/2009 and significantly better efficiency in 2010/2011 (coefficient = −0.054; p = .045). In 2008/2009, moving from less than basic to basic EHR was associated with worse efficiency (0.02 or about 2 percent of a standard deviation) and was associated with improved efficiency (0.014 or about 1.4 percent of a standard deviation) in 2010/2011. Again, the coefficients were significantly different from each other (F(1, 4134) = 22.83, p < .001).
When we examined whether the relationship between the extent of EHR adoption and our outcomes varied based on earliest stage 1 MU attestation cohort, we did not find consistent evidence of a relationship (Table 4). For the process adherence composite, all three attestation cohorts exhibited a positive, statistically significant relationship between a one‐unit increase in EHR adoption and performance while the cohort of nonattesters exhibited a negative, statistically significant relationship. However, the only significant differences across these coefficients were between the attesters and the nonattesters, not among the attesters. We found stronger support for our hypothesis for patient satisfaction; both the first and second cohorts had a positive, statistically significant relationship with EHR adoption, but only the first cohort was significantly different from the other three. Lastly, the measure of efficiency did not support our hypothesis. The only statistically significant relationship between EHR adoption and efficiency was for the third cohort, which exhibited worse efficiency with greater EHR adoption, but this relationship was not statistically distinguishable from the other cohorts.
Table 4.
Relationship between EHR Adoption and Hospital Outcomes by Meaningful Use Attestation Cohort
| Process Compositea | Patient Satisfaction Compositeb | Efficiencyc | |
|---|---|---|---|
| EHR adoption*Attestation cohort 1 | 0.202*** | 0.243*** | −0.0145 |
| EHR adoption*Attestation cohort 2 | 0.194*** | 0.0861** | −0.0184 |
| EHR adoption*Attestation cohort 3 | 0.230*** | 0.0787 | 0.0872** |
| EHR adoption*Never attested | −0.194* | 0.0368 | −0.00645 |
| Observationsd | 10,152 | 9,327 | 11,363 |
| p‐value from F‐test comparing | |||
| Cohort 1 versus 2 | 0.9351 | 0.0059 | 0.9752 |
| Cohort 1 versus 3 | 0.8128 | 0.0123 | 0.1340 |
| Cohort 1 versus never | 0.0021 | 0.0091 | 0.7945 |
| Cohort 2 versus 3 | 0.7431 | 0.9031 | 0.1215 |
| Cohort 2 versus never | 0.0015 | 0.5101 | 0.7644 |
| Cohort 3 versus never | 0.0018 | 0.06049 | 0.1131 |
Covariates include hospital case mix index, market share, size, teaching status, system membership, network membership, ownership, year, and hospital fixed effects. Standard errors are clustered at the hospital level. Bold values indicate those f‐tests that are statistically significant at the level of p < 0.05.
The Process measure is a composite of 10 process measures drawn from CMS's Hospital Compare data that have been log‐transformed to reduce skew and standardized.
Patient satisfaction is a composite of the Hospital Consumer Assessment of Healthcare Providers and Systems, including measures of Communication with Nurses, Communication with Doctors, Responsiveness of Hospital Staff, Pain Management, Cleanliness and Quietness of Hospital Environment, Communication about Medicines, Discharge Information, and Overall Rating of Hospital.
Efficiency is measured as the total expenditures per adjusted patient day.
Hospitals were fairly evenly split across the attestation cohorts. Eighteen percent of hospitals first attested in 2011; 38% first attested in 2012; 24% first attested in 2013; and 20% never attested. The number of observations for each model varies due to the number of respondents to each outcome measure.
***p < .01, **p < .05, *p < .10.
Discussion
In response to a growing set of national studies with mixed evidence on the relationship between EHR adoption and hospital performance, we used the most recent national data to reexamine this relationship, and, more important, to assess whether the relationship was consistent across performance domains and reflected time‐related effects. We found that greater EHR adoption was associated with improved process adherence and patient satisfaction, but we observed no improvement for our efficiency measure, which may reflect the large capital investment required to implement EHR functions. We found strong support for our hypothesis that the relationship between EHR adoption and performance improved over time based on calendar year, with all three measures reflecting improvement in 2010/2011 compared to 2008/2009. We interpret these findings as indication that hospitals across the nation are benefiting in later years from some combination of (1) adopting EHR functions that more consistently improve performance (a trend that we empirically observe, Table A6), and (2) improvements in EHR technology and implementation. In addition, we found modest support for our hypothesis that the relationship between EHR adoption and outcomes varied by meaningful use attestation cohort, suggesting that organizational experience with EHRs may contribute to improved patient satisfaction and process adherence. Taken together, these findings reveal that time‐related effects appear to be important in driving high performance from EHRs in three high‐priority domains of hospital care. This is encouraging with respect to the payoff from the large national investment in EHRs and reflects the experience in other industries in which gains from IT took many years to realize (Jones et al. 2012).
Increases in process adherence and patient satisfaction from greater EHR adoption were of similar magnitude. However, we suspect that the underlying time‐related effects may differ. While process adherence is likely promoted by adoption of EHR functions such as order sets and clinical decision support, patient satisfaction may result from a clinical care team that benefits from better implementation knowledge and more easily incorporates new EHR functions into work and workflow in ways that improve patient communication and care (Robey, Boudreau, and Rose 2000). The fact that we failed to find a significant relationship between EHR adoption and efficiency could reflect two offsetting factors: efficiency losses from EHR investment and efficiency gains from reduced operational costs (Das, Yaylacicegi, and Menon 2011). In later versus earlier years, efficiency losses are likely reduced as a result of improved implementation knowledge while better technology, bolstered by improved implementation knowledge, may help promote efficiency gains.
Our study expands on several past studies that assessed the effects of EHR adoption on hospital performance using national data. In general, past studies focused on the pre‐HITECH years 2003–2007 (DesRoches et al. 2010; Himmelstein, Wright, and Woolhandler 2010; Jones et al. 2010; McCullough et al. 2010; Kazley et al. 2012), though one study examined 2006–2010 (Appari, Eric Johnson, and Anthony 2012). We focused on the most recent period, including several years after the passage of HITECH, to robustly assess time‐related effects. It is, however, difficult to directly compare findings across studies because the studies used differing definitions of EHR adoption: one study used a binary indicator (McCullough et al. 2010), two used a three‐level indicator (DesRoches et al. 2010; Jones et al. 2010), one a five‐level indicator (Appari, Eric Johnson, and Anthony 2012), and one a continuous measure similar to ours (Himmelstein, Wright, and Woolhandler 2010). There are also comparison challenges because, while all of these national studies measured process quality using Hospital Compare, the use of Hospital Compare measures varied: one study (McCullough et al. 2010) measured the effect of EHR adoption on individual measures, three used composite scales divided by disease (DesRoches et al. 2010; Jones et al. 2010; Appari, Eric Johnson, and Anthony 2012), and one used an overall composite scale similar to ours (however, as the scale was not transformed, a direct comparison of results is not informative) (Himmelstein, Wright, and Woolhandler 2010). Nonetheless, compared to prior studies that had mixed results—three studies found some positive and some nonsignificant effects of EHR adoption (DesRoches et al. 2010; Himmelstein, Wright, and Woolhandler 2010; McCullough et al. 2010), one found no benefits from increased EHR adoption (Jones et al. 2010), and one found positive, nonsignificant and negative relationships (Appari, Eric Johnson, and Anthony 2012)—our study advances our understanding of the nature of the relationship between EHR adoption and key hospital outcomes by identifying consistent positive benefits from EHR adoption associated with two types of time‐related effects.
Our study has limitations that should be considered when interpreting the results. First, adherence to the process measures was high across hospitals, leaving less opportunity to observe EHR‐driven improvement. While we were able to reduce the skewness of the process measure using a log transformation, our results may not reflect the true magnitude of process improvement that can be realized from EHR adoption. Instead, our results may better reflect the effect of EHR adoption among low‐performing hospitals that had a greater opportunity to improve on our measure. Second, our measure of meaningful use attestation cohort only reflects attestation for the Medicare incentive program. Attestation status for the Medicaid program is not publicly reported. The implication is that our “Never Attested” category could have included hospitals that attested to stage 1 MU only through the Medicaid program, and this would have made it harder to find support for our hypothesis. It is also possible that some hospitals with the EHR functions in place to attest to MU chose to delay attestation for strategic reasons, and this would call into question our assumption that earlier attesters were those with greater EHR experience. While this may explain the weaker findings, when we empirically explored this possibility, we found that hospitals reporting that they had in place all 11 functions measured on the AHA IT supplement that are required for stage 1 MU had a much higher probability of attesting to stage 1 MU compared to those with 10 or fewer functions in place (43 percent compared to 8.5 percent).
A related limitation is that two of the three MU attestation years occurred after our study period, such that attestation year may imperfectly relate to the length of hospitals' experience with EHRs during our study period. To validate that MU attestation related to experience using EHRs, we examined whether hospitals with at least a basic EHR in 2008 were more likely to attest in 2011 than those with less than a basic EHR, and we found that 29 percent of hospitals with a basic EHR in 2008 attested to MU in 2011, while only 17 percent of hospitals without a basic EHR attested in 2011. This bolsters our confidence that MU attestation year is a reasonable proxy for duration of time using an EHR. Further, we believe that use of MU attestation cohort is preferable to such alternative approaches as assessing the impact of adoption of a specific subset of EHR functions (e.g., clinical decision support), or the impact of adoption of a specific combination of EHR functions (e.g., a basic EHR), multiple years after adoption. These alternatives are inferior because we observe large year‐to‐year changes (in some cases both increases and decreases) in the EHR functions adopted in a given hospital.
Finally, it is possible that the relationships we observe are driven by time‐varying factors that impacted our outcomes in parallel with increases in EHR adoption, such as quality improvement, care management, and payment incentives. However, our empirical strategy included several features that attempted to improve causal inference related to the impact of EHR adoption on hospital performance—hospital‐level fixed effects and a robust set of control measures that capture hospitals' patient, structural, and market characteristics. In addition, EHRs may enhance the effectiveness of hospital improvement efforts and so we may be observing the combined effect of EHR‐enabled performance improvement.
In conclusion, we sought to assess whether the substantial national investment in EHRs over the past 5 years was associated with higher quality, more efficient hospital care, and in particular, focus on time‐related effects. Compared to prior studies, we found consistent and compelling evidence of a relationship between EHR adoption and performance for three key outcomes in the post‐HITECH period. This suggests that the introduction of HITECH policies along with other industry trends and individual hospital experience may have jointly contributed to these results, providing justification for the large investment in EHRs and supporting the belief that these technologies are contributing to better hospital care.
Supporting information
Appendix SA1: Author Matrix.
Table A1: Comparison of Continuous EHR Adoption Measure and Basic/Comprehensive EHR Adoption Measures.
Table A2: Alternative Measures of EHR Adoption.
Table A3: List of Process Measures Included.
Table A4: Representativeness of Hospital Sample in 2011.
Table A5: Relationship between EHR Adoption and Back‐Transformed Individual Process and Patient Satisfaction Outcomes.
Table A6: Increase in EHR Adoption by Function Category: 2008/2009 versus 2010/2011.
Acknowledgments
Joint Acknowledgment/Disclosure Statement: This work was supported by a grant from the Blue Cross Blue Shield of Michigan Foundation (#N017090).
Disclosures: Julia Adler‐Milstein serves on the Advisory Board and holds shares in QPID Health.
Disclaimers: None.
References
- Adler‐Milstein, J. , Everson J., and Lee S.‐Y. D.. 2014. “Sequencing of EHR Adoption among US Hospitals and the Impact of Meaningful Use.” Journal of the American Medical Informatics Association 21 (6): 984–91. [DOI] [PMC free article] [PubMed] [Google Scholar]
- Adler‐Milstein, J. , DesRoches C. M., Furukawa M. F., Worzala C., Charles D., Kralovec P., Stalley S., and Jha A. K.. 2014. “More Than Half of US Hospitals Have At Least a Basic EHR, but Stage 2 Criteria Remain Challenging for Most.” Health Affairs 33: 1664–71. doi:10.1377/hlthaff.2014.0453. [DOI] [PubMed] [Google Scholar]
- Appari, A. , Eric Johnson M., and Anthony D. L.. 2012. “Meaningful Use of Electronic Health Record Systems and Process Quality of Care: Evidence from a Panel Data Analysis of US Acute‐Care Hospitals.” Health Services Research 48 (2): 354–75. [DOI] [PMC free article] [PubMed] [Google Scholar]
- Appari, A. , Carian E. K., Johnson M. E., and Anthony D. L.. 2012. “Medication Administration Quality and Health Information Technology: A National Study of US Hospitals.” Journal of the American Medical Informatics Association 19 (3): 360–7. [DOI] [PMC free article] [PubMed] [Google Scholar]
- Blumenthal, D. 2010. “Launching HITECH.” New England Journal of Medicine 362 (5): 382–5. [DOI] [PubMed] [Google Scholar]
- Blumenthal, D. , and Tavenner M.. 2010. “The “Meaningful Use” Regulation for Electronic Health Records.” New England Journal of Medicine 363: 501–4. [DOI] [PubMed] [Google Scholar]
- Brynjolfsson, E. 1993. “The Productivity Paradox of Information Technology.” Communications of the ACM 36 (12): 66–77. [Google Scholar]
- Campbell, M. 2012. “What a Difference a Year Makes: Time Lag Effect of Information Technology Investment on Firm Performance.” Journal of Organizational Computing and Electronic Commerce 22 (3): 237–55. [Google Scholar]
- Chaudhry, B. , Jerome W., Shinyi W., Maglione M., Mojica W., Roth E., Morton S. C., and Shekelle P. G.. 2006. “Systematic Review: Impact of Health Information Technology on Quality, Efficiency, and Costs of Medical Care.” Annals of Internal Medicine 144 (10): E12–W18. [DOI] [PubMed] [Google Scholar]
- CMS . 2012. “Frequently Asked Questions: Hospital Value‐Based Purchasing Program” [accessed on October 1, 2014]. Available at http://www.cms.gov/Medicare/Quality-Initiatives-Patient-Assessment-Instruments/hospital-value-based-purchasing/Downloads/FY-2013-Program-Frequently-Asked-Questions-about-Hospital-VBP-3-9-12.pdf
- Das, S. , Yaylacicegi U., and Menon N. M.. 2011. “The Effect of Information Technology Investments in Healthcare: A Longitudinal Study of Its Lag, Duration, and Economic Value.” Engineering Management, IEEE Transactions on 58 (1): 124–40. [Google Scholar]
- DesRoches, C. M. , Campbell E. G., Vogeli C., Zheng J., Rao S. R., Shields A. E., Donelan K., Rosenbaum S., Bristol S. J., and Jha A. K.. 2010. “Electronic Health Records' Limited Successes Suggest More Targeted Uses.” Health Affairs 29 (4): 639–46. [DOI] [PubMed] [Google Scholar]
- Dranove, D. , Forman C., Goldfarb A., and Greenstein S.. 2012. The Trillion Dollar Conundrum: Complementarities and Health Information Technology. National Bureau of Economic Research Working Paper Series No. 18281. [Google Scholar]
- Everson, J. , Lee S.‐Y. D., and Friedman C. P.. 2014. “Reliability and Validity of the American Hospital Association's National Longitudinal Survey of Health Information Technology Adoption.” Journal of the American Medical Informatics Association 21 (e2): e257–63. [DOI] [PMC free article] [PubMed] [Google Scholar]
- Garg, A. X. , Adhikari N. K. J., McDonald H., Rosas‐Arellano M. P., Devereaux P. J., Beyene J., Sam J., and Haynes R. B.. 2005. “Effects of Computerized Clinical Decision Support Systems on Practitioner Performance and Patient Outcomes: A Systematic Review.” Journal of the American Medical Association 293 (10): 1223–38. [DOI] [PubMed] [Google Scholar]
- Himmelstein, D. U. , Wright A., and Woolhandler S.. 2010. “Hospital Computing and the Costs and Quality of Care: A National Study.” The American Journal of Medicine 123 (1): 40–6. [DOI] [PubMed] [Google Scholar]
- Jones, S. S. , Adams J. L., Schneider E. C., Ringel J. S., and McGlynn E. A.. 2010. “Electronic Health Record Adoption and Quality Improvement in US Hospitals.” American Journal of Managed Care 16 (12): SP64–71. [PubMed] [Google Scholar]
- Jones, S. S. , Heaton P. S., Rudin R. S., and Schneider E. C.. 2012. “Unraveling the IT Productivity Paradox—Lessons for Health Care.” New England Journal of Medicine 366 (24): 2243–5. [DOI] [PubMed] [Google Scholar]
- Kaushal, R. , Shojania K. G., and Bates D. W.. 2003. “Effects of Computerized Physician Order Entry and Clinical Decision Support Systems on Medication Safety: A Systematic Review.” Archives of Internal Medicine 163 (12): 1409–16. [DOI] [PubMed] [Google Scholar]
- Kazley, A. S. , Diana M. L., Ford E. W., and Menachemi N.. 2012. “Is Electronic Health Record Use Associated with Patient Satisfaction in Hospitals?” Health Care Management Review 37 (1): 23–30. doi:10.1097/HMR.1090b1013e3182307bd3182303. [DOI] [PubMed] [Google Scholar]
- Lammers, E. J. , Adler‐Milstein J., and Kocher K. E.. 2014. “Does Health Information Exchange Reduce Redundant Imaging? Evidence from Emergency Departments.” Medical Care 52 (3): 227–34. [DOI] [PubMed] [Google Scholar]
- Lee, S. , and Alexander J. A.. 1999. “Managing Hospitals in Turbulent Times: Do Organizational Changes Improve Hospital Survival?” Health Services Research 34 (4): 923. [PMC free article] [PubMed] [Google Scholar]
- Maxson, E. , Jain S., Kendall M., Mostashari F., and Blumenthal D.. 2010. “The Regional Extension Center Program: Helping Physicians Meaningfully Use Health Information Technology.” Annals of Internal Medicine 153 (10): 666–70. [DOI] [PubMed] [Google Scholar]
- McCullough, J. S. , Parente S., and Town R.. 2013. “Health Information Technology and Patient Outcomes: The Role of Organizational and Informational Complementarities.” National Bureau of Economic Research Working Paper Series No. 18684.
- McCullough, J. S. , Casey M., Moscovice I., and Prasad S.. 2010. “The Effect of Health Information Technology on Quality in U.S. Hospitals.” Health Affairs 29 (4): 647–54. [DOI] [PubMed] [Google Scholar]
- Middleton, B. , Bloomrosen M., Dente M. A., Hashmat B., Koppel R., Overhage J. M., Payne T. H., Rosenbloom S. T., Weaver C., and Zhang J.. 2013. “Enhancing Patient Safety and Quality of Care by Improving the Usability of Electronic Health Record Systems: Recommendations from AMIA.” Journal of the American Medical Informatics Association 20 (e1): e2–8. [DOI] [PMC free article] [PubMed] [Google Scholar]
- Parente, S. T. , and McCullough J. S.. 2009. “Health Information Technology and Patient Safety: Evidence from Panel Data.” Health Affairs 28 (2): 357–60. [DOI] [PubMed] [Google Scholar]
- Robey, D. , Boudreau M.‐C., and Rose G. M.. 2000. “Information Technology and Organizational Learning: A Review and Assessment of Research.” Accounting, Management and Information Technologies 10 (2): 125–55. [Google Scholar]
- Soumerai, S. B. , and Mahjumdar S. R.. 2009. A Bad $50 Billion Bet. Washington, DC: The Washington Post. [Google Scholar]
- Succi, M. J. , Lee S.‐Y., and Alexander J. A.. 1997. “Effects of Market Position and Competition on Rural Hospital Closures.” Health Services Research 31 (6): 679. [PMC free article] [PubMed] [Google Scholar]
- Zhou, L. , Soran C. S., Jenter C. A., Volk L. A., Orav E. J., Bates D. W., and Simon S. R.. 2009. “The Relationship between Electronic Health Record Use and Quality of Care over Time.” Journal of the American Medical Informatics Association 16 (4): 457–64. [DOI] [PMC free article] [PubMed] [Google Scholar]
Associated Data
This section collects any data citations, data availability statements, or supplementary materials included in this article.
Supplementary Materials
Appendix SA1: Author Matrix.
Table A1: Comparison of Continuous EHR Adoption Measure and Basic/Comprehensive EHR Adoption Measures.
Table A2: Alternative Measures of EHR Adoption.
Table A3: List of Process Measures Included.
Table A4: Representativeness of Hospital Sample in 2011.
Table A5: Relationship between EHR Adoption and Back‐Transformed Individual Process and Patient Satisfaction Outcomes.
Table A6: Increase in EHR Adoption by Function Category: 2008/2009 versus 2010/2011.