Summary
We previously discovered mediastinal fat‐associated lymphoid clusters (MFALCs) as novel lymphoid clusters associated with mediastinal fat tissue in healthy mice. However, no data about their morphology in immune‐associated disease conditions, and their relationship with lung infiltration, is available to date. In the present study, we compared the morphological features of MFALCs in 4‐month‐old male murine autoimmune disease models (MRL/MpJ‐lpr mice and BXSB/MpJ‐Yaa mice) with those of the corresponding control strains (MRL/MpJ and BXSB/MpJ, respectively). In addition, we analysed their correlation with lung infiltration. Furthermore, immunohistochemistry for CD3, B220, Iba1, Gr1 and BrdU was performed to detect T cells and B cells, macrophages, granulocytes and proliferating cells, respectively. The spleen weight to body weight ratios and anti‐double‐stranded DNA autoantibody titres were found to be significantly higher in the autoimmune models than in the control strains. Furthermore, the autoimmune model presented prominent MFALCs, with a significantly greater ratio of lymphoid cluster area to total mediastinal fat tissue area, and more apparent diffused cellular infiltration into the lung lobes than the other studied strains. Higher numbers of T and B cells, macrophages and proliferating cells, but fewer granulocytes, were observed in the autoimmune models than in the control strains. Interestingly, a significant positive Pearson's correlation between the size of the MFALCs and the density of CD3‐, B220‐ and Iba1‐positive cells in the lung was observed. Therefore, our data suggest a potentially important role for MFALCs in the progression of lung disease. However, further investigation is required to clarify the pathological role of MFALCs in lung disease, especially in inflammatory disorders.
Keywords: autoimmune disease model, lymphoid cluster, mediastinal adipose tissue
Abbreviations
- H&E
haematoxylin and eosin
- LCs
lymphoid clusters
- MFALCs
mediastinal fat‐associated lymphoid clusters
- MFT
mediastinal fat tissue
- RA
rheumatoid arthritis
- SLE
systemic lupus erythematosus
Introduction
The immune response against microbes and toxins involves cooperation between both innate and adaptive immunity.1 The innate immune system, which mounts an immediate response against infection, thereby constituting the first line of defence,2 is also required for the activation of the adaptive immune response through antigen presentation. There are two types of adaptive immune responses: humoral immunity, which is mediated by antibody‐producing B cells, and cell‐mediated immunity, mediated by T cells. The lymphocytes of the innate immune system do not express antigen receptors, as observed in T and B cells; however, these lymphocytes produce cytokines and rapidly exert cytotoxic activity against virus‐infected cells.3, 4 The innate lymphocytes include classical natural killer and lymphoid tissue inducer cells, in addition to the recently reported T helper type 2 (Th2) innate lymphocytes, such as natural helper cells.5 Natural helper cells were first discovered in novel lymphoid structures associated with mesenteric adipose tissue in both humans and mice.6 These lymphoid structures are referred to as mesenteric fat‐associated lymphoid clusters (FALCs). Recently, we found similar lymphoid clusters associated with mediastinal adipose tissue in mice, and referred to these as mediastinal FALCs (MFALCs).7
Our previous study revealed strain‐related differences in MFALCs among three strains of healthy mice: Th1‐biased C57BL/6N, Th2‐biased DBA/2Cr and autoimmune‐prone MRL/MpJ mice. We revealed that C57BL/6N mice presented a significantly larger number and size of MFALCs compared with DBA/2Cr and MRL/MpJ strains.7 Interestingly, Th1‐biased C57BL/6 mice are susceptible to hypersensitive pneumonitis, a granulomatous inflammatory lung disease caused by repeated inhalation of organic antigens in humans and mice;8, 9 however, Th2‐biased DBA/2 mice are resistant.10, 11 This suggests that the development of MFALCs may affect intrapleural immune conditions. However, there have been no data suggesting an association between MFALCs and intrapleural organs such as the lung.
In humans, systemic lupus erythematosus (SLE) may affect numerous organs, including the intrapleural organs.12 The most common thoracic manifestation of SLE is pleuritis.13 Pleuritis occurs in 17–60% of patients at some point during the course of SLE.14 Although severe parenchymal lung disease is uncommon, pulmonary complications of SLE include acute lupus pneumonitis, diaphragmatic dysfunction and shrinking lung syndrome, cavitating pulmonary nodules, pulmonary hypertension, pulmonary vasculitis, pulmonary embolism (often due to circulating anti‐cardiolipin antibodies), alveolar haemorrhage (reflecting diffuse endothelial injury) and chronic interstitial pneumonitis.15, 16, 17, 18
Murine SLE models also exhibit thoracic manifestations.19 The MRL/MpJ‐lpr mouse model carries the lymphoproliferation (lpr) mutation in the apoptosis‐related Fas gene, resulting in autoreactive lymphocyte proliferation. This mouse model, which closely mimics SLE in humans, exhibits lymphadenopathy, splenomegaly and hypergammaglobulinaemia with anti‐double‐stranded DNA (anti‐dsDNA) antibodies leading to tissue deposition and injury in various organs, including the lung and kidney.20, 21, 22 These pathophysiological processes are mediated by immune complex deposition, complement activation and infiltration of inflammatory leucocytes.23, 24 The BXSB/MpJ‐Yaa model also develops systemic autoimmune disease at around 5–7 months of age, and males show more severe autoimmune symptoms than females because of the Y‐linked autoimmune acceleration (Yaa) mutation on the Y chromosome.25, 26, 27 Autoimmune disease phenotypes of this strain were characterized by the presence of autoantibodies, hypergammaglobulinaemia, splenomegaly, glomerulonephritis and dacryoadenitis.28 However, the pathological features of intrapleural organs in SLE remain unclear.
In the present study, we demonstrate that MFALCs are significantly larger in size in autoimmune disease model mice than in the corresponding control strains. Additionally, we show that the size of these MFALCs is positively correlated with immune cell infiltration into the lung tissue. This is the first report of the development of MFALCs in autoimmune disease model mice, and of the pathological correlation between MFALCs and inflammatory processes in the lung. These data emphasize the crucial roles of MFALCs in immunological functions in the intrathoracic environment.
Materials and methods
Experimental animals
Autoimmune disease model mice (MRL/MpJ‐lpr and BXSB/MpJ‐Yaa) and healthy control mice (MRL/MpJ and BXSB/MpJ) were used in the present study. Mice were purchased from Japan SLC, Inc., (Shizuoka, Japan) (n = 5/strain) and examined at 4 months of age. In handling the experimental animals, the investigators adhered to the Guide for the Care and Use of Laboratory Animals, Hokkaido University, Graduate School of Veterinary Medicine (approved by the Association for Assessment and Accreditation of Laboratory Animal Care International).
Tissue preparation and microscopy
Mice were killed by deep anaesthesia and blood was collected from the carotid arteries; the mediastinal fat tissue (MFT), the lungs and spleens were removed and fixed with 4% paraformaldehyde. To preserve lung architecture, the lungs were inflated with 4% paraformaldehyde before immersion in fixative solution. After overnight fixation, specimens were dehydrated in graded alcohol and embedded in paraffin. Subsequently, 3‐μm‐thick paraffin sections of MFTs were deparaffinized, rehydrated, stained with haematoxylin & eosin (H&E) and observed under a light microscope.
Immunohistochemistry
Immunohistochemical analysis for B220, CD3, Gr1 (Ly‐6G) and Iba1 was performed using 3‐μm‐thick paraffin sections to detect B cells, pan‐T cells, granulocytes and macrophages, respectively. Immunohistochemical procedures were performed according to our previous report.29 To detect cell proliferation, bromodeoxyuridine (BrdU) ‐positive cells were observed within the MFALCs and lungs of the strains studied. The detection of BrdU‐positive cells was performed according to our previous report.7 The details of the antigen retrieval method used, as well as of the sources and dilutions of antibodies used, are listed in Table 1. Sections of the spleen were used as positive controls and stained simultaneously with the MFTs and lung lobes (cranial right, middle right, caudal right, accessory right lobes and left lobe) using the above‐mentioned antibodies. The sections representing negative controls were incubated in 0·01 m PBS without primary antibody (data not shown).
Table 1.
List of antibodies, working dilutions, and methods for antigen retrieval
| Antibody | Source | Dilution | Antigen retrieval | Heating condition |
|---|---|---|---|---|
| Rabbit anti‐CD3 | Nichirei (Tokyo, Japan) | 1 : 200 | Target retrieval solution (high pH) (produced by Dako) | 105°, 20 min |
| Rat anti‐B220 | Cedarlane (Ontario, Canada) | 1 : 1600 | 10 mm citrate buffer (pH 6·0) | 105°, 20 min |
| Rabbit anti‐Iba1 | Wako (Osaka, Japan) | 1 : 1200 | 10 mm citrate buffer (pH 6·0) | 105°, 20 min |
| Rat anti‐Gr1 | R and D system (Minneapolis, USA) | 1 : 800 | 0·1% pepsin/0·2 m HCl | 37°, 5 min |
| Rat anti‐BrdU | Abcam (Tokyo, Japan) | 1 : 200 | 10 mm citrate buffer (pH 6·0) | 105°, 20 min |
ELISA for serum autoantibody
Serum levels of anti‐dsDNA autoantibodies were determined by ELISA using dsDNA‐coated plates purchased from Alpha Diagnostic Intl. Inc. (M‐5110; San Antonio, TX). The assay was performed according to the manufacturer's instructions.
Histoplanimetry
For histoplanimetry, five mice were analysed per strain. The spleen weights and spleen weight to body weight ratios were compared between the different mouse strains. For measurement of the ratio of lymphoid cluster (LC) area to the total MFT area, light micrographs of H&E‐stained MFT sections from each strain were prepared. The areas of LCs and the total areas of the mediastinal white adipose tissue within the MFT were measured using imageJ software (ver. 1.32j, http://rsb.info.nih.gov/ij) and the ratio of LC area to total MFT area was calculated as reported previously.7
Based on the immunohistochemistry staining images, the percentages of B220‐, CD3‐, Gr1‐ and Iba1‐positive cells in MFALCs were calculated in three different sections from each mouse. These were presented as the positive cell index for each cell population by counting the number of immunopositive cells and dividing them by the total number of mononuclear cells within the MFALCs. In addition, the densities of immunopositive cells/unit area (0·094 mm2) in different lung lobes were compared between the different strains.
Statistical analysis
All numerical results are presented as the means ± standard error (SE). The results for the different groups were compared using analysis of variance. We used the non‐parametric Mann–Whitney U‐test for comparison between the autoimmune disease mouse models and the normal control strains (P < 0·05). The correlation between the density of CD3‐, B220‐, Gr1‐ and Iba1‐positive cells in different lung lobes, and the percentage of lymphoid cluster areas in the total MFT areas, in the mouse strains was analysed by Pearson's correlation test (* indicating a significant value, P < 0·05; ** indicating a highly significant value, P < 0·01).
Results
Autoimmune disease onset
Spleen weights and spleen weight to body weight ratios were found to be significantly higher in the autoimmune mouse models (MRL/MpJ‐lpr and BXSB/MpJ‐Yaa) than in the controls (MRL/MpJ and BXSB/MpJ) (Fig. 1a and b, respectively). The spleen weights of the MRL/MpJ‐lpr and BXSB/MpJ‐Yaa mice were almost 3·2‐fold and 3·3‐fold higher than those of the MRL/MpJ and BXSB/MpJ mice, respectively. Moreover, the spleen weight to body weight ratios of the MRL/MpJ‐lpr and BXSB/MpJ‐Yaa mice were almost 2·8‐fold and 3·1‐fold higher than those of the MRL/MpJ and BXSB/MpJ mice, respectively. With respect to serum anti‐dsDNA antibody levels, a significantly higher titre was observed in MRL/MpJ‐lpr and BXSB/MpJ‐Yaa mice than in MRL/MpJ and BXSB/MpJ mice (Fig. 1c).
Figure 1.
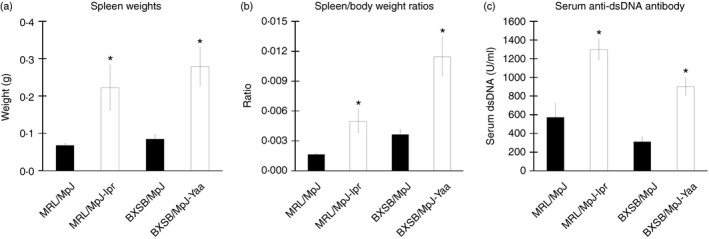
Indices of autoimmune disease onset in mice. Graph showing the spleen weight (n = 5 mice for each strain) (a), spleen weight to body weight ratio (n = 5 mice for each strain) (b), and serum anti‐double‐stranded DNA (anti‐dsDNA) level (n = 4 mice for each strain) (c). Statistically significant difference, as determined using the Mann–Whitney U‐test (P < 0·05), between autoimmune disease models (MRL/MpJ‐lpr and BXSB/MpJ‐Yaa) and the control strains (MRL/MpJ, BXSB/MpJ), respectively, is indicated, *P < 0·05. Values are shown as the means ± SE.
Morphological features of MFALCs
Analysis of the H&E‐stained sections indicated that MFALCs were observed in the white adipose tissue of the MFTs in all mice examined, with varying sizes among the studied strains (Fig. 2). The size of the MFALCs was more prominent in the autoimmune models, MRL/MpJ‐lpr and BXSB/MpJ‐Yaa (Fig. 2b and d) than in the MRL/MpJ and BXSB/MpJ mice (Fig. 2a and c). With respect to the histological index of MFALC development (as expressed by the ratio of the LC area to the total MFT area), a significantly higher LC area to MFT area ratio was observed in the autoimmune disease models than in the control strains (Fig. 2e).
Figure 2.
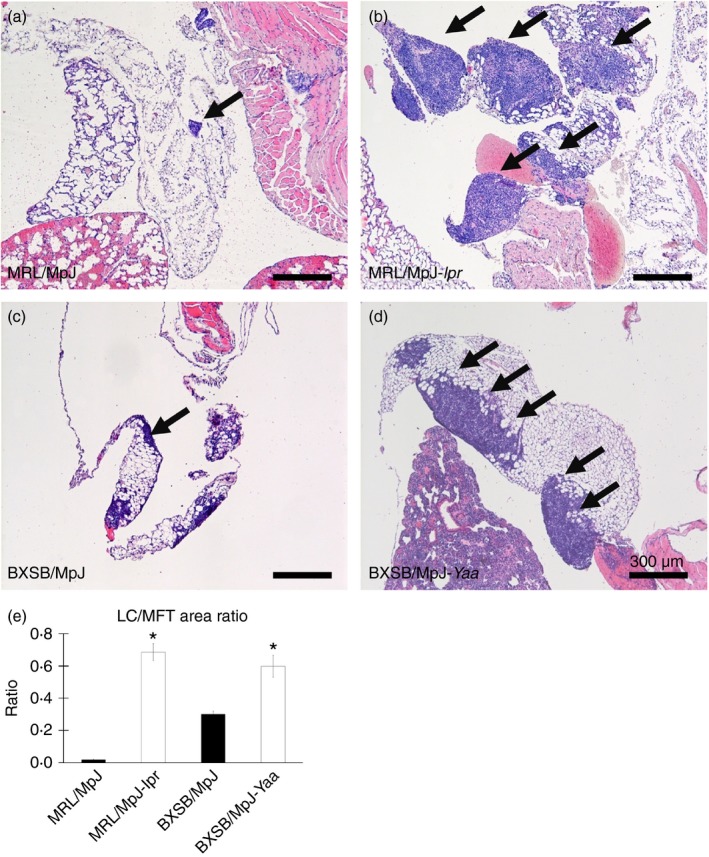
Histological features of mediastinal fat‐associated lymphoid clusters (MFALCs) in mice. Light microscopic images of haematoxylin & eosin (H&E)‐stained mediastinal fat tissues (MFTs) of MRL/MpJ, MRL/MpJ‐lpr, BXSB/MpJ and BXSB/MpJ‐Yaa mice, respectively (a–d). Note that MFALCs (indicated by arrows) are more prominent in both MRL/MpJ‐lpr (b) and BXSB/MpJ‐Yaa mice (d). (e) Graph showing the ratio of lymphoid cluster (LC) area to the total MFT area in the H&E‐stained sections (×40). Statistically significant difference, as determined using the Mann–Whitney U‐test; n = 5 mice for each strain, between autoimmune disease models (MRL/MpJ‐lpr and BXSB/MpJ‐Yaa) and the control strains (MRL/MpJ, BXSB/MpJ), respectively, is indicated (*P < 0·05). Values are shown as the means ± SE.
MFALC immune cell populations
To assess the population of immune cells in the MFALCs, immunohistochemical analysis for CD3, B220, Iba1 and Gr1 was performed to detect pan‐T cells, B cells, macrophages and granulocytes, respectively. CD3‐, B220‐ and Iba1‐positive cells (Fig. 3a–c) were found to predominate in all strains examined, with the presence of a few Gr1‐positive cells (Fig. 3d).
Figure 3.
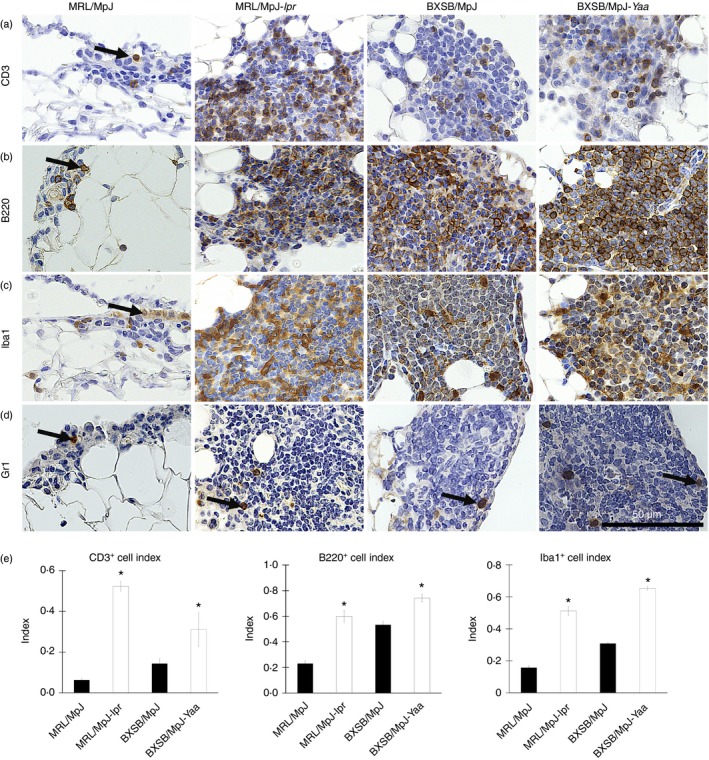
Immune cells from mediastinal fat‐associated lymphoid clusters (MFALCs) in mice. Light microscopic photographs showing immunohistochemical staining of mouse MFALCs with CD3 (a), B220 (b), Iba1 (c), and Gr1 (d). Numerous CD3‐positive T cells, B220‐positive B cells, and Iba1‐positive macrophages (a–c), but only a few Gr1‐positive granulocytes (d), are present in mouse MFALCs, and their appearance differs between the strains. Arrows indicate immunopositive cells. Bars (a–d) = 100 μm. Graphs showing the indices of immunopositive cells for CD3 (a), B220 (b), and Iba1 (c) in MRL/MpJ, MRL/MpJ‐lpr, BXSB/MpJ, and BXSB/MpJ‐Yaa mice (e). Statistically significant difference, as determined using the Mann–Whitney U‐test; n = 5 mice for each strain, between autoimmune disease models (MRL/MpJ‐lpr and BXSB/MpJ‐Yaa) and the control strains (MRL/MpJ, BXSB/MpJ), respectively, is indicated (*P < 0·05). Values are shown as the means ± SE.
To assess the immune cell populations in MFALCs, the percentages of immunopositive cells in the total cells detected in MFALCs were analysed in the different mouse strains and represented as cell indices (Fig. 3e). A significant difference was observed between the cell indices of CD3‐, B220‐ and Iba1‐positive populations in the autoimmune disease models and the corresponding control strains (Fig. 3e). No significant difference was observed between the strains in terms of the percentage of Gr1‐positive cells (data not shown).
Proliferating cells in the MFALCs
BrdU‐positive cells, whose numbers varied by strain, were observed in the MFALCs (Fig. 4). A greater number of BrdU‐positive cells was observed within the MFALCs of the autoimmune disease model mice (Fig. 4b and d) than in the MFALCs of the control strains (Fig. 4a and c). In particular, the number of BrdU‐positive cells in the MFALCs of MRL/MpJ‐lpr mice was greater than in those of the other strains studied (Fig. 4b).
Figure 4.
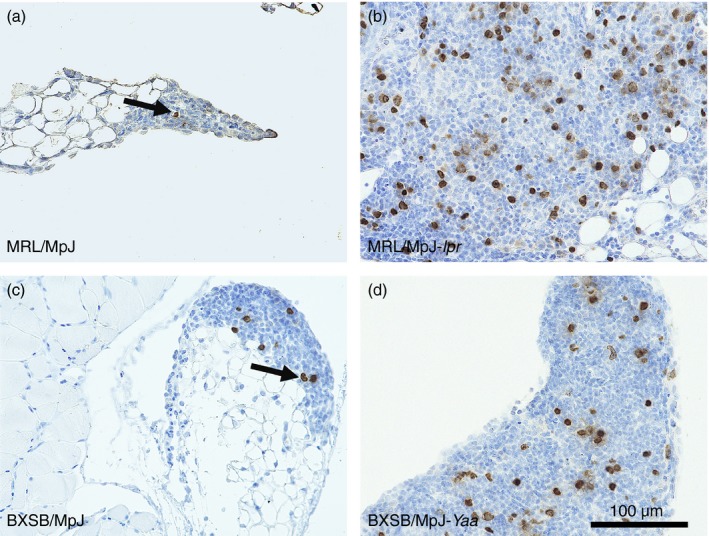
Proliferating cells in the mediastinal fat‐associated lymphoid clusters (MFALCs) of the mice. Immunohistochemistry for bromodeoxyuridine (BrdU) in MRL/MpJ (a), MRL/MpJ‐lpr (b), BXSB/MpJ (c), and BXSB/MpJ‐Yaa (d) mice. Fewer BrdU‐positive cells are visible within the MFALCs of MRL/MpJ and BXSB/MpJ mice (a, c) than in the MFALCs of MRL/MpJ‐lpr and BXSB/MpJ‐Yaa mice (b, d) at 4 months.
Histopathological features of the lungs
Analysis of the H&E‐stained sections indicated that MRL/MpJ (Fig. 5a and b) mice showed normal histological lung architecture, characterized by normal blood vessels, thin interalveolar septum, and a low degree of cell infiltration. However, the lungs in MRL/MpJ‐lpr and BXSB/MpJ‐Yaa mice, as well as BXSB/MpJ mice, showed several histopathological alterations characterized by the presence of numerous congested blood vessels, high numbers of extravasated red blood cells, large accumulations of mononuclear cells, thicker interalveolar septa, and numerous abnormal and collapsed alveoli (Fig. 5c–h).
Figure 5.
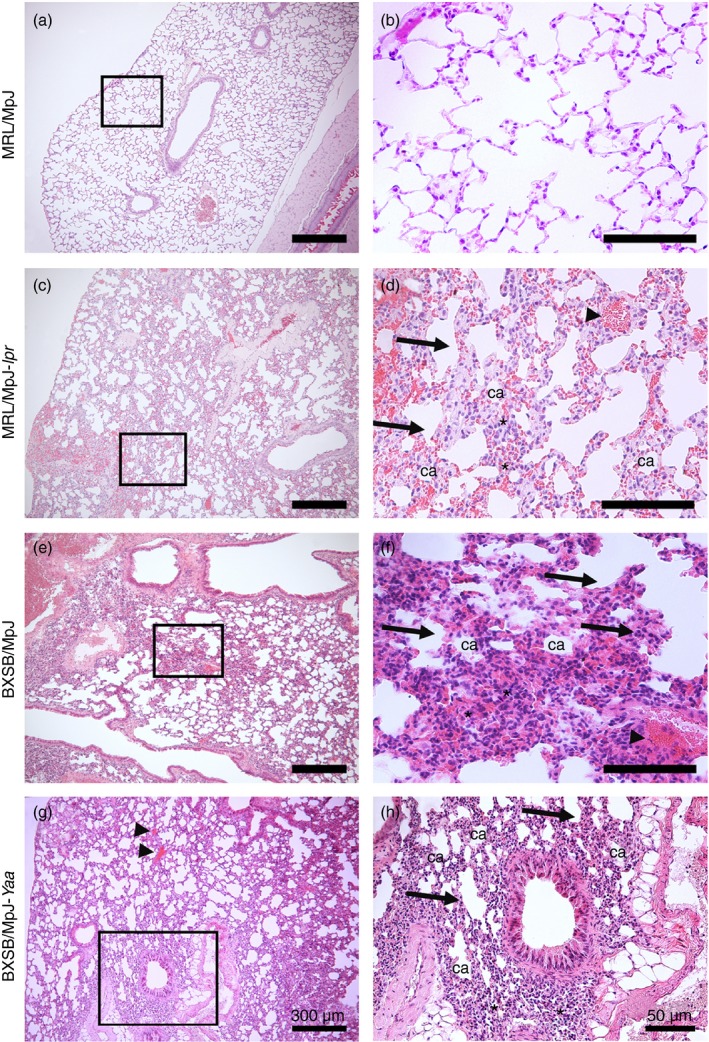
Histopathological features of the lungs in mice. Light microscopic photographs of haematoxylin & eosin (H&E)‐stained mouse lung sections of MRL/MpJ (a and b), MRL/MpJ‐lpr (c and d), BXSB/MpJ (e and f), and BXSB/MpJ‐Yaa (g and h), mice. The squares in (a), (c), (e) and (g) indicate the same areas as those in (b), (d), (f) and (h), respectively. A greater accumulation of mononuclear cells (asterisks), thicker interalveolar septa (arrows), congested blood vessels (arrowheads), and collapsed alveoli (ca) are visible in the lung tissue of MRL/MpJ‐lpr, BXSB/MpJ and BXSB/MpJ‐Yaa mice (c–h) than in that of MRL/MpJ mice (a and b). Bars = 300 μm (a, c, e and g). Bars = 50 μm (b, d, f and h).
Immune cell infiltration in the lung lobes
Immunohistochemical analysis revealed the infiltration of CD3‐, B220‐, Iba1‐ and Gr1‐positive cells in the mouse lungs (Fig. 6a–d). Mononuclear cells positive for CD3, B220 and Gr1 were mainly observed in the interalveolar septum and interstitium (Fig. 6a, b, and d). Iba1‐positive cells were mainly observed in the connective tissues of the peribronchial regions as well as in the lung dust cells (Fig. 6d).
Figure 6.
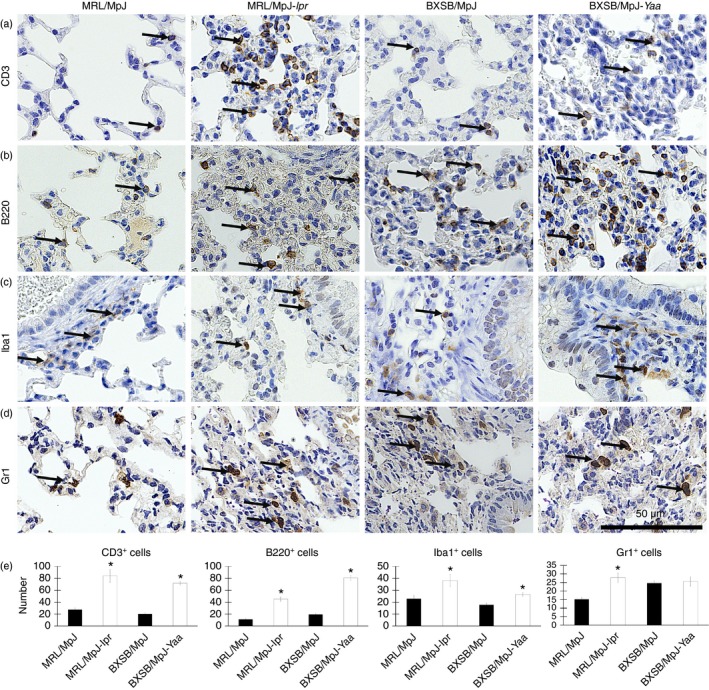
Immune cells in the mouse lungs. (a–d) Light microscopic photographs showing immunohistochemical staining of the mouse lungs with CD3 (a), B220 (b), Iba1 (c), and Gr1 (d). Immunopositive cells (indicated by arrows) are present in the lungs of MRL/MpJ, MRL/MpJ‐lpr, BXSB/MpJ and BXSB/MpJ‐Yaa mice, and their appearance differs between the strains. In particular, the MRL/MpJ‐lpr and BXSB/MpJ‐Yaa mice show a greater abundance of positive cells within the infiltration area. Bars = 50 μm (a–d). Graph showing the average density of CD3‐positive (a), B220‐positive (b), Iba1‐positive (c), and Gr1‐positive (d) cells/unit area in all the lobes in the lungs of MRL/MpJ, MRL/MpJ‐lpr, BXSB/MpJ and BXSB/MpJ‐Yaa mice (e). Statistically significant difference, as determined using the Mann–Whitney U‐test; n = 5 mice for each strain, between autoimmune disease models (MRL/MpJ‐lpr and BXSB/MpJ‐Yaa) and the control strains (MRL/MpJ, BXSB/MpJ), respectively, is indicated by asterisk (*P < 0·05). Values are shown as the means ± SE.
Within the same strain, no significant difference was observed in the density of immunopositive cells in the left and right (cranial, middle, caudal and accessory) lobes (data not shown). However, a significant difference was observed in the density of CD3‐, B220‐ and Iba1‐positive cell infiltration between the lungs of autoimmune disease model mice (MRL/MpJ‐lpr and BXSB/MpJ‐Yaa mice) and those of the control strains (Fig. 6e). There was a significant difference in the density of Gr1‐positive cell infiltration between MRL/MpJ‐lpr mice and the corresponding normal control strain; however, no significant difference was observed between the lung of BXSB/MpJ‐Yaa mice and its counterpart control strain (Fig. 6e).
Correlation between the MFLAC development, autoimmune disease indices, and cellular infiltration of the lungs
Significant positive correlation was observed between the autoimmune disease model mice (MRL/MpJ‐lpr and BXSB/MpJ‐Yaa) and the control strains in terms of the size of the MFALCs and the spleen weights, spleen weight to body weight ratios, and serum anti‐dsDNA antibody levels (Table 2). The size of the MFALCs was also significantly positively correlated with the density of CD3‐, B220‐ and Iba1‐positive cell infiltration in the lung lobes (Table 3). Positive correlation was also observed between the size of MFALCs and the density of Gr1‐positive cell infiltration in the lung lobes (Table 3). The later correlations were found to be significant between the BXSB/MpJ‐Yaa mice and corresponding controls (r = 0·733; P < 0·05). However, no significant correlation was observed between MRL/MpJ‐lpr and the counterpart control strain (r = 0·077).
Table 2.
Pearson's correlation between the average number of CD3‐, B220‐, Iba1‐ and Gr1‐positive cells in all lung lobes and the proportion of lymphoid cluster area in the total mediastinal fat tissue areas (expressed as percentages) in autoimmune disease model mice and the normal control strains
| Immune cells | CD3 | B220 | Iba1 | Gr1 |
|---|---|---|---|---|
| MRL/MpJ and MRL/MpJ‐lpr | ||||
| r | 0·865** | 0·944** | 0·656* | 0·733* |
| P | 0·001 | 0·000 | 0·040 | 0·016 |
| BXSB/MpJ and BXSB/MpJ‐Yaa | ||||
| r | 0·935** | 0·948** | 0·762* | 0·077 |
| P | 0·000 | 0·000 | 0·010 | 0·832 |
Pearson's correlation test, n = 10, (*P < 0·05).
Table 3.
Pearson's correlation between spleen weights, spleen weight to body weight ratios, serum anti‐dsDNA antibody level, and the proportion of lymphoid cluster area in total mediastinal fat tissue areas (expressed as a percentage) in autoimmune disease model mice and the normal control strains
| Mouse strain | Spleen weight | Spleen weight tobody weight ratios | Serum anti‐dsDNA antibody level |
|---|---|---|---|
| MRL/MpJ and MRL/MpJ‐lpr | |||
| r | 0·647* | 0·685* | 0·816* |
| P | 0·043 | 0·029 | 0·013 |
| BXSB/MpJ and BXSB/MpJ‐Yaa | |||
| r | 0·685* | 0·632* | 0·745* |
| P | 0·029 | 0·050 | 0·034 |
Pearson's correlation test, n ≥ 8, (*P < 0·05).
Discussion
In previous studies, we demonstrated the presence of LCs associated with MFT, similar to those discovered in the mesenteric adipose tissue of both humans and mice,6 in apparently normal mouse strains. These were termed MFALCs.7 In addition, we showed that there are significant differences in MFALC size in normal mice, and determined that the predominant cells in MFALCs were lymphocytes.7 However, there have been no data on the morphology of such MFALCs in autoimmune disease model mice. We reported an association between the LCs and mediastinal white adipose tissue. In addition, we found that the autoimmune disease models (MRL/MpJ‐lpr and BXSB/MpJ‐Yaa) exhibit better developed MFALCs than the control strains. White adipose tissue, which secretes adipokines such as leptin, adiponectin, visfatin and resistin, is considered the largest endocrine organ. These adipokines function as hormones in glucose homeostasis and appetite regulation, and as cytokines in the immune system, where they mediate effects on autoimmunity.30, 31, 32, 33 In addition, they have been reported to play roles in autoimmune rheumatic diseases, such as SLE and rheumatoid arthritis.33
In the present study, the autoimmune disease models, MRL/MpJ‐lpr and BXSB/MpJ‐Yaa, were reported to develop SLE‐like disorders characterized by lymphoid activation and hyperplasia, nephritis, splenomegaly, and elevated serum autoantibodies against dsDNA.20, 34 MRL/MpJ‐lpr and BXSB/MpJ‐Yaa mice presenting MFALCs of larger size also exhibited higher spleen weights and spleen weight to body weight ratios as well as higher serum anti‐dsDNA autoantibody levels than the normal control strains. Numerous mononuclear cells within the MFALCs of the autoimmune disease model mice showed BrdU‐incorporating activity, suggesting local cell proliferation.7 Therefore, we suggest that the presence of prominent lymphoproliferation in the MFTs of the autoimmune model mice examined may represent an SLE‐like phenotype in addition to other previously reported phenotypes.
It has been reported that pulmonary involvement may be an important contributor to morbidity and mortality in human SLE.15, 35, 36 The MRL/MpJ‐lpr mouse model has been used to study the progress of pulmonary inflammation in SLE.37 Perivascular lymphocytic infiltration in the lung has been reported to precede renal involvement in such murine models of lupus.38 Lung disorders secondary to SLE include interstitial pneumonitis with mononuclear cellular infiltration, interstitial fibrosis, oedema and pulmonary vasculitis.35 Accordingly, our findings revealed a greater accumulation of mononuclear cells with histopathological changes such as numerous congested blood vessels, thicker interalveolar septa, and several abnormal and collapsed alveoli in the lungs of MRL/MpJ‐lpr and BXSB/MpJ‐Yaa mice as well as in BXSB/MpJ mice than in the other strains studied. The interstitial mononuclear infiltration in the lung lobes observed in these strains may reflect the inflammatory processes associated with interstitial pneumonitis in human SLE.15, 36
CD3‐positive T cells, B220‐positive B cells, Iba1‐positive macrophages, and Gr1‐positive granulocytes were observed in both MFALCs and the lung. Interestingly, the autoimmune disease models showed significantly higher numbers of CD3‐, B220‐ and Iba1‐positive cells, in both the MFALCs and the lung, than the control strains. Furthermore, both the MFALCs and lungs in MRL/MpJ‐lpr mice showed a higher number of CD3‐positive cells than those of the other strains. Massive T‐cell proliferation was also reported in the spleen and mesenteric lymph node of MRL/MpJ‐lpr mice compared with C57BL/6 mice.38 Furthermore, it has been reported that the majority of proliferating lymphoid cells in the lymph nodes of MRL/MpJ‐lpr mice are T cells rather than B cells.39 Such lymphoproliferation was reported to be due to a massive accumulation of double‐negative (CD3+/CD4−/CD8−) T‐cells in the secondary lymphoid organs40 resulting from lpr mutation of Fas.41, 42 On the other hand, the BXSB/MpJ‐Yaa mice presented a higher number of B220‐positive cells, in both MFALCs and lungs, than the other strains studied. Furthermore, we previously reported that BXSB/MpJ‐Yaa mice develop dacryoadenitis with T‐cell and B‐cell infiltration, and demonstrated that B cells were the predominant infiltrating cells in the lacrimal glands of these mice.28 Moreover, in BXSB/MpJ‐Yaa mice, B cells with the Yaa mutation are intrinsically biased towards nucleolar antigens because of increased expression of Toll‐like receptors in duplicated regions of the Y chromosome.43 Therefore, the increased cell infiltration of the lungs would reflect the autoimmune disease conditions in MRL/MpJ‐lpr and BXSB/MpJ‐Yaa mice because of the mutation of immune‐associated genes (lpr mutation of Fas in MRL/MpJ‐lpr mice and mutation in Y chromosome in BXSB/MpJ‐Yaa). These mutations may characterize the specific immune cell populations of the MFALCs and lungs in each strain.
Our data reveal a significantly positive correlation between the size of MFALCs and autoimmune disease indices, including the spleen weights, spleen weight to body weight ratios, and serum autoantibody levels, as well as cellular infiltration in the lung, in the autoimmune disease models and control strains. These data clearly indicate a pathological association between MFALCs and autoimmune disease‐associated lung pathology. However, differences in the spleen weights and serum autoantibody levels between strains did not fully correspond to differences in MFALC size or density of cellular infiltration in the lung. Briefly, MRL/MpJ mice showed a higher titre of anti‐dsDNA antibodies than the other healthy controls, but presented the smallest MFALCs, lowest levels of cellular infiltration in the lung, and lowest spleen weights among the examined strains. Furthermore, although BXSB/MpJ mice presented a relatively higher positive B‐cell density in the lung than MRL/MpJ mice, the spleen weights and serum anti‐dsDNA antibody levels were comparable to those of the latter strain. These results indicate that the spleen weights and serum anti‐dsDNA antibody levels were not directly associated with the development of MFALCs or cellular infiltration in the lung. In addition, the data suggest that not only autoimmune disease phenotypes, but also other factors, are involved in these processes.
As reported in our previous study, the MFALCs of Th1‐prone C57BL/6 mice were found to be larger in size than those of Th2‐prone DBA/2 mice.7 Furthermore, we recently reported that not only male BXSB/MpJ‐Yaa mice, but also female BXSB/MpJ mice, clearly exhibit symptoms of age‐related autoimmune disease onset, such as increased spleen weights, elevated serum autoantibodies and glomerulonephritis, without the contribution of the Yaa mutation.44, 45 For the BXSB/MpJ strain, age‐related autoimmune disease onset was attributed to the expression of immune‐associated genes in the telomeric regions of chromosome 1.45 Therefore, gene mutations as well as genetic backgrounds associated with the immune response may also be important in the development of MFALCs and lung cellular infiltration in murine autoimmune disease models.
In conclusion, our findings indicate a possible role for MFALCs in the development of autoimmune‐associated lung diseases. In particular, the elucidation of a positive correlation between the size of MFALCs and density of lung infiltration with mononuclear cells provides insights into the pathogenesis of several intrapleural diseases.
Disclosures
The authors declare no conflict of interest.
Acknowledgements
This work was supported by the Japan Society for the Promotion of Science, postdoctoral fellowship (JSPS, Number 14F04400). YE designed and performed the experiments, analysed the data and wrote the manuscript. OI designed the experiments and wrote the manuscript. YK conceptualized the research, designed the experiments and wrote the manuscript.
References
- 1. Zygmunt B, Veldhoen M. T helper cell differentiation more than just cytokines. Adv Immunol 2011; 109:159–96. [DOI] [PubMed] [Google Scholar]
- 2. Rasmussen SB, Reinert LS, Paludan SR. Innate recognition of intracellular pathogens: detection and activation of the first line of defense. APMIS 2009; 117:323–37. [DOI] [PubMed] [Google Scholar]
- 3. Andoniou CE, Andrews DM, Degli‐Esposti MA. Natural killer cells in viral infection: more than just killers. Immunol Rev 2006; 214:239–50. [DOI] [PubMed] [Google Scholar]
- 4. Lodoen MB, Lanier LL. Natural killer cells as an initial defense against pathogens. Curr Opin Immunol 2006; 18:391–8. [DOI] [PMC free article] [PubMed] [Google Scholar]
- 5. Moro K, Yamada T, Tanabe M, Takeuchi T, Ikawa T, Kawamoto H et al Innate production of TH2 cytokines by adipose tissue‐associated c‐Kit+ Sca‐1+ lymphoid cells. Nature 2010; 463:540–4. [DOI] [PubMed] [Google Scholar]
- 6. Koyasu S, Moro K. Innate Th2‐type immune responses and the natural helper cell, a newly identified lymphocyte population. Curr Opin Allergy Clin Immunol 2011; 11:109–14. [DOI] [PubMed] [Google Scholar]
- 7. Elewa YH, Ichii O, Otsuka S, Hashimoto Y, Kon Y. Characterization of mouse mediastinal fat‐associated lymphoid clusters. Cell Tissue Res 2014; 357:731–41. [DOI] [PubMed] [Google Scholar]
- 8. Fink JN. Hypersensitivity pneumonitis. Clin Chest Med 1992; 13:303–9. [PubMed] [Google Scholar]
- 9. Sharma OP, Fujimura N. Hypersensitivity pneumonitis: a noninfectious granulomatosis. Semin Respir Infect 1995; 10:96–106. [PubMed] [Google Scholar]
- 10. Gudmundsson G, Monick MM, Gary W. IL‐12 modulates expression of hypersensitivity pneumonitis. J Immunol 1998; 161:991–9. [PubMed] [Google Scholar]
- 11. Butler NS, Monick MM, Yarovinsky TO, Powers LS, Hunninghake GW. Altered IL‐4 mRNA stability correlates with Th1 and Th2 bias and susceptibility to hypersensitivity pneumonitis in two inbred strains of mice. J Immunol 2002; 169:3700–9. [DOI] [PubMed] [Google Scholar]
- 12. Todd NW, Wise RA. Respiratory complication in the collagen vascular diseases. Clin Pulm Med 1996; 3:101–12. [Google Scholar]
- 13. Orens JB, Martinez FJ, Lynch JP III. Pleuropulmonary manifestations of systemic lupus erythematosus. Rheum Dis Clin North Am 1994; 20:159–93. [PubMed] [Google Scholar]
- 14. Pandya MR, Agus B, Grady RF. In vivo LE phenomenon in pleural fluid. Arthritis Rheum 1976; 19:962–3. [DOI] [PubMed] [Google Scholar]
- 15. Haupt HM, Moore GW, Hutchins GM. The lung in systemic lupus erythematosus. Analysis of the pathologic changes in 120 patients. Am J Med 1981; 71:791–8. [DOI] [PubMed] [Google Scholar]
- 16. Hedgpeth MT, Boulware DW. Interstitial pneumonitis in antinuclear antibody‐negative systemic lupus erythematosus: a new clinical manifestation and possible association with anti‐Ro (SS‐A) antibodies. Arthritis Rheum 1988; 31:545–8. [DOI] [PubMed] [Google Scholar]
- 17. Weinrib L, Sharma OP, Quismorio FP Jr. A long‐term study of interstitial lung disease in systemic lupus erythematosus. Semin Arthritis Rheum 1990; 20:48–56. [DOI] [PubMed] [Google Scholar]
- 18. Murin S, Wiedemann HP, Matthay RA. Pulmonary manifestations of systemic lupus erythematosus. Clin Chest Med 1998; 19:641–65. [DOI] [PubMed] [Google Scholar]
- 19. Souza‐Fernandes AB, Rocco PR, Contador RS, Menezes SL, Faffe DS, Negri EM et al Respiratory changes in a murine model of spontaneous systemic lupus erythematosus. Respir Physiol Neurobiol 2006; 153:107–14. [DOI] [PubMed] [Google Scholar]
- 20. Theofilopoulos AN, Dixon FJ. Murine models of systemic lupus erythematosus. Adv Immunol 1985; 37:269–390. [DOI] [PubMed] [Google Scholar]
- 21. Andrews BS, Eisenberg RA Theofilopoulos AN. Spontaneous murine lupus‐like syndromes. Clinical and immunopathological manifestations in several strains. J Exp Med 1978; 148:1198–215. [DOI] [PMC free article] [PubMed] [Google Scholar]
- 22. Reilly CM, Gilkeson GS. Use of genetic knockouts to modulate disease expression in a murine model of lupus, MRL/lpr mice. Immunol Res 2002; 25:143–53. [DOI] [PubMed] [Google Scholar]
- 23. Tesch GH, Maifert S, Schwarting A, Rollins BJ, Kelley VR. Monocyte chemoattractant protein 1‐dependent leukocytic infiltrates are responsible for autoimmune disease in MRL‐Fas (lpr) mice. J Exp Med 1999; 190:1813–24. [DOI] [PMC free article] [PubMed] [Google Scholar]
- 24. Manderson AP, Botto M, Walport MJ. The role of complement in the development of systemic lupus erythematosus. Annu Rev Immunol 2004; 22:431–56. [DOI] [PubMed] [Google Scholar]
- 25. Maibaum MA, Haywood ME, Walport MJ, Morley BJ. Lupus susceptibility loci map within regions of BXSB derived from the SB/Le parental strain. Immunogenetics 2000; 51:370–2. [DOI] [PubMed] [Google Scholar]
- 26. Haywood ME, Rogers NJ, Rose SJ, Boyle J, McDermott A, Rankin JM et al Dissection of BXSB lupus phenotype using mice congenic for chromosome 1 demonstrates that separate intervals direct different aspects of disease. J Immunol 2004; 173:4277–85. [DOI] [PubMed] [Google Scholar]
- 27. Kimura J, Ichii O, Otsuka S, Kanazawa T, Namiki Y, Hashimoto Y et al Quantitative and qualitative urinary cellular patterns correlate with progression of murine glomerulonephritis. PLoS ONE 2011; 6: e16472. [DOI] [PMC free article] [PubMed] [Google Scholar]
- 28. Kosenda K, Ichii O, Otsuka S, Hashimoto Y, Kon Y. BXSB/MpJ‐Yaa mice develop autoimmune dacryoadenitis with the appearance of inflammatory cell marker messenger RNAs in the lacrimal fluid. Clin Experiment Ophthalmol 2013; 41:788–97. [DOI] [PubMed] [Google Scholar]
- 29. Elewa YH, Bareedy MH, Abuel‐Atta AA, Ichii O, Otsuka S, Kanazawa T et al Cytoarchitectural differences of myoepithelial cells among goat major salivary glands. Vet Res Commun 2010; 34:557–67. [DOI] [PubMed] [Google Scholar]
- 30. Tilg H, Moschen AR. Adipocytokines: mediators linking adipose tissue, inflammation and immunity. Nat Rev Immunol 2006; 6:772–83. [DOI] [PubMed] [Google Scholar]
- 31. Lago F, Dieguez C, Gomez‐Reino J, Gualillo O. The emerging role of adipokines as mediators of inflammation and immune responses. Cytokine Growth Factor Rev 2007; 18:313–25. [DOI] [PubMed] [Google Scholar]
- 32. Guzik TJ, Mangalat D, Korbut R. Adipocytokines– novel link between inflammation and vascular function? J Physiol Pharmacol 2006; 57:505–28. [PubMed] [Google Scholar]
- 33. Barbosa VS, Rego J, da Silva NA. Possible role of adipokines in systemic lupus erythematosus and rheumatoid arthritis. Rev Bras Reumatol 2012; 52:271–87. [PubMed] [Google Scholar]
- 34. Perry D, Sang A, Yin Y, Zheng Y‐Y, Morel L. Murine models of systemic lupus erythematosus. J Biomed Biotechnol 2011; 2011:271694. [DOI] [PMC free article] [PubMed] [Google Scholar]
- 35. Matthay RA, Schwartz MI, Petty TL, Standord RE, Gupta RC, Sahn SA et al Pulmonary manifestations of systemic lupus erythematosus: review of twelve cases of acute lupus pneumonitis. Medicine 1974; 54:397–409. [DOI] [PubMed] [Google Scholar]
- 36. Gross M, Esterly JR, Earle RH. Pulmonary alterations in systemic lupus erythematosus. Am Rev Respir Dis 1972; 105:572–7. [DOI] [PubMed] [Google Scholar]
- 37. Sunderrajan EV, McKenzie WN, Lieske TR, Kavanaugh JL, Braun SR, Walker SE. Pulmonary inflammation in autoimmune MRL/Mp‐lpr/lpr mice. Histopathology and bronchoalveolar lavage evaluation. Am J Pathol 1986; 124:353–62. [PMC free article] [PubMed] [Google Scholar]
- 38. Theofilopoulos AN, Eisenberg RA, Bourdon M, Crowell JS, Dixon FJ. Distribution of lymphocytes identified by surface markers in murine strain with systemic lupus erythematosus‐like syndromes. J Exp Med 1979; 149:516–34. [DOI] [PMC free article] [PubMed] [Google Scholar]
- 39. Lewis DE, Grorgi JV, Warner NL. Flow cytometry analysis of T‐cells and continuous T‐cell lines from autoimmune MRL/I mice. Nature 1981; 289:298–300. [DOI] [PubMed] [Google Scholar]
- 40. Morse H, Davidson W, Yetter R, Murphy E, Roths J, Coffman R. Abnormalities induced by the mutant gene lpr: expansion of a unique lymphocytes subset. J Immunol 1982; 129:2612–5. [PubMed] [Google Scholar]
- 41. Suda T, Takahashi T, Golstein P, Nagata S. Molecular cloning and expression of the Fas ligand, a novel member of the tumor necrosis factor family. Cell 1993; 75:1169–78. [DOI] [PubMed] [Google Scholar]
- 42. Watanabe‐Fukunaga R, Brannan C, Copeland N, Jenkins N, Nagata S. Lymphoproliferation disorder in mice explained by defects in Fas antigen that mediates apoptosis. Nature 1992; 356:314–7. [DOI] [PubMed] [Google Scholar]
- 43. Santiago‐Raber ML, Kikuchi S, Bore l, Uematsu S, Akira S, Kotzin BL et al Evidence for genes in addition to Tlr7 in the Yaa translocation linked with acceleration of systemic lupus erythematosus. J Immunol 2008; 181:1556–62. [DOI] [PubMed] [Google Scholar]
- 44. Merino R, Fossati L, Izui S. The lupus‐prone BXSB strain: the Yaa gene model of systemic lupus erythematosus. Springer Semin Immunopathol 1992; 14:141–57. [DOI] [PubMed] [Google Scholar]
- 45. Kimura J, Ichii O, Nakamura T, Horino T, Otsuka S, Kon Y. BXSB‐type genome causes murine autoimmune glomerulonephritis: pathological correlation between telomeric region of chromosome 1 and Yaa . Genes Immun 2014; 15:182–9. [DOI] [PubMed] [Google Scholar]


