

Summary
The tissue accumulation of M1 macrophages in patients with metabolic diseases such as obesity and type 2 diabetes mellitus has been well‐documented. Interestingly, it is an accumulation of M2 macrophages that is observed in the adipose, liver and lung tissues, as well as in the circulation, of patients who have had major traumas such as a burn injury or sepsis; however, the trigger for the M2 polarization observed in these patients has not yet been identified. In the current study, we explored the effects of chronic palmitate and high glucose treatment on macrophage differentiation and function in murine bone‐marrow‐derived macrophages. We found that chronic treatment with palmitate decreased phagocytosis and HLA‐DR expression in addition to inhibiting the production of pro‐inflammatory cytokines. Chronic palmitate treatment of bone marrows also led to M2 polarization, which correlated with the activation of the peroxisome proliferator‐activated receptor‐γ signalling pathway. Furthermore, we found that chronic palmitate treatment increased the expression of multiple endoplasmic reticulum (ER) stress markers, including binding immunoglobulin protein. Preconditioning with the universal ER stress inhibitor 4‐phenylbutyrate attenuated ER stress signalling and neutralized the effect of palmitate, inducing a pro‐inflammatory phenotype. We confirmed these results in differentiating human macrophages, showing an anti‐inflammatory response to chronic palmitate exposure. Though alone it did not promote M2 polarization, hyperglycaemia exacerbated the effects of palmitate. These findings suggest that the dominant accumulation of M2 in adipose tissue and liver in patients with critical illness may be a result of hyperlipidaemia and hyperglycaemia, both components of the hypermetabolism observed in critically ill patients.
Keywords: bone marrow, endoplasmic reticulum stress, free fatty acids, macrophage, palmitate
Abbreviations
- Arg 1
arginase 1
- BiP
binding immunoglobulin protein
- BMM
bone marrow‐derived macrophages
- CHOP
C/EBP homologous protein
- ER
endoplasmic reticulum
- FFAs
free fatty acids
- HG
high glucose
- iNOS
inducible nitric oxide synthase
- M‐CSF
macrophage colony‐ stimulating factor
- PBA
4‐phenylbutyrate
- PCNA
proliferating cell nuclear antigen
- PGC‐1α
PPARγ co‐activator‐1α
- PPARγ
peroxisome proliferator‐activated receptor‐γ
- pTHP‐1
PMA‐activated THP‐1 cells
- TLR4
Toll‐like receptor 4
Introduction
Metabolic disturbances are common in critically ill patients. These acute responses typically occur in the early days following insult and are generally considered appropriate and adaptive; however, many of the endocrine responses in these patients result in a persistent hypermetabolic response and this is increasingly seen as potentially deleterious in the long run.1, 2, 3 Critically ill patients present with various lipid disorders: high levels of triglycerides and free fatty acids (FFA); low levels of low‐density lipoproteins; and low levels of high‐density lipoproteins.4 Increased lipolysis after burn injuries causes increased circulating triglycerides and FFA levels, which lead to fatty infiltration of vital organs such as the liver. Hepatic steatosis is associated with poor prognoses.5, 6 Both hyperglycaemia and dyslipidaemia in critical illness contribute to elevated morbidity and mortality. Consequently, glycaemic control is an important adjuvant therapy in these patients.
Recent studies demonstrate that obesity‐related adipose tissue expansion induces an infiltration of ‘classically activated’ or M1 macrophages, which produce pro‐inflammatory cytokines such as tumour necrosis factor‐α (TNF‐α).7 These increased pro‐inflammatory cytokines lead to local and systemic chronic inflammation and insulin resistance. As opposed to the chronic low‐grade inflammatory state of M1‐dominant metabolic diseases, Langouche et al. found that subcutaneous and visceral adipose tissue from non‐surviving, prolonged, critically ill patients had been infiltrated with high numbers of ‘alternatively activated’ or M2 macrophages.8 These macrophages displayed elevated gene expression of M2 macrophage markers, such as arginase‐1, interleukin‐10 (IL‐10) and CD163, and low levels of M1 macrophage markers TNF‐α and inducible nitric‐oxide synthase (iNOS).8 Studies in severe burn injury also found a dominance of M2 macrophages in the peripheral blood. Increased levels of catecholamines post‐burn are believed to play a role in the conversion of M1 to M2.9 These M2 macrophages inhibit conversion from resident macrophage to M1;9, 10 however, the mechanisms underlying M2 dominance in these tissues in critical illness are not fully understood.
Previous studies using bone marrow‐derived macrophages (BMM) and bone marrow‐derived dendritic cells found that a short period (3 hr) of exposure to FFA leads to a pro‐inflammatory phenotype in mouse bone marrow‐derived dendritic cells and in a mouse monocytic cell line, but was without effect on BMM.11, 12 Conversely, several studies have shown that short‐term (6 and 18 hr) treatment of BMM with palmitate promotes a pro‐inflammatory phenotype.13 Another study found that macrophages from diabetic patients that were alternatively stimulated (M2) lead to increased uptake of lipid by increasing SR‐A1 and CD36.14 Despite a growing literature, whether palmitate can directly drive M2 differentiation is still not understood. In the current study, we addressed the effects of hyperlipidaemia and hyperglycaemia on macrophage activation and polarization by exploring the effects of chronic palmitate and high glucose exposure on BMM differentiation and function. We found that chronic palmitate treatment of bone marrow during the macrophage differentiation period led to alternatively activated macrophage polarization by inducing endoplasmic reticulum (ER) stress. We also investigated the effects of palmitate on differentiated macrophages from murine bone marrow and PMA‐activated THP‐1 cells (pTHP‐1), an immortalized human monocyte cell line.
Material and methods
Reagents and antibodies
FITC‐Dextran (MW: 40K), sodium palmitate and lipopolysaccharide (LPS) from Escherichia coli O111:B4 were purchased from Sigma‐Aldrich (Oakville, ON, Canada). Recombinant murine macrophage colony‐stimulating factor (M‐CSF) was purchased from PeproTech (Rocky Hill, NJ) and stock solution (40 ng/ml) was stored at −80°. Fatty‐acid‐free BSA was purchased from Roche Diagnostics (Indianapolis, IN).
Conjugation of palmitate to BSA was carried out as described previously with some modifications.15 Briefly, palmitate was dissolved in 50% ethanol at 70° and then complexed with 10% low‐endotoxin BSA at 55° for 10 min at a final concentration of 8 mm. Stock solutions were stored at −80° and diluted with fresh media.
Phycoerythrin‐conjugated rat anti‐mouse CD206, NOS2, CD11b, Peridinin chlorophyll protein‐Cy5·5‐conjugated rat anti‐mouse F4/80 and allophycocyanin‐conjugated rat anti‐mouse CSF‐1 receptor and ELISA kits of mouse IL‐12 and mouse IL‐10 were purchased from Biolegend (San Diego, CA). FITC‐conjugated mouse anti‐mouse I‐Ab was from BD Biosciences (Franklin Lakes, NJ). FITC‐conjugated anti mouse TNF‐α, IL‐12, IL‐10, IL‐1β monoclonal antibodies and rat IgG2bκ isotope control were purchased from eBioscience (San Diego, CA). Anti‐binding immunoglobulin protein (BiP), anti‐peroxisome proliferator‐activated receptor‐γ (PPARγ); anti‐phospho‐protein kinase A subunit C (PKA C), anti‐proliferating cell nuclear antigen (PCNA), and anti‐cleaved‐caspase 3 antibodies were purchased from Cell Signaling Technologies (Danvers, MA). Anti‐PPARγ co‐activator‐1α (PGC‐1α) antibody was purchased from EMD Millipore (Billerica, MA). Anti‐CD206 antibody was purchased from Abcam (Cambridge, MA).
Cell line
The human monocytic cell line, THP‐1, was a kind gift from Dr Dawn Bowdish (McMaster University, Canada). Differentiation of THP‐1 into macrophage‐like cells was induced by exposure of the cells to PMA as described previously with some modifications.16 THP‐1 cells were activated by a low dose of PMA (20 ng/ml) for 24 hr followed by 48 hr resting, during which time palmitate and/or glucose were added to the culture.
Animals and isolation of mouse bone marrow‐derived macrophages
All mice used in this study were female C57BL/6 mice and were purchased from Charles River Laboratories (St Constant, QC, Canada). All animal procedures were approved by the Sunnybrook Health Science Centre Animal Care Committee.
Murine bone marrow isolation was conducted as previously described.17 Briefly, for experiments carried out in differentiating macrophages, total bone marrow cells were treated with various doses of glucose (7·5, 10 and 12·5 mm) or various doses of palmitate (0·1, 0·2 and 0·4 mm) or in combination (10 mm glucose plus 0·2 mm palmitate) during the differentiation period. Macrophages were then harvested on day 7. For experiments carried out in differentiated macrophages, various doses of palmitate were added for 24 hr after 7 days of differentiation. To prime the macrophages, 100 ng/ml of LPS was added to the culture media 24 hr before harvesting. In some experiments, 4‐phenylbutyrate (PBA; 20 ng/ml) was added to the BMM culture before adding 0·4 mm of palmitate. In the experiments designed to test the combined effects of glucose and palmitate, 10 mm glucose and 0·2 mm palmitate were added into the culture.
Cell proliferation assay
Proliferation of BMM was determined by a CyQUANT Cell Proliferation assay kit (Molecular Probes, Eugene, OR) according to the manufacturer's instructions.
Cell staining and flow cytometry
Cells were incubated with Fc receptor blocker for 10 min for mouse cells at room temperature followed by incubation with antibodies against the surface markers CD11b, F4/80, I‐Ab and CSF‐1R in PBS containing 1% BSA. The pTHP‐1 cells were incubated directly with fluorescence‐conjugated antibodies. All samples were run on a BD LSR II flow cytometer (Becton Dickinson, Franklin Lakes, NJ). In all, 100 000 events were collected for each sample and data were analysed using flowjo (v. 8.7) software (Flowjo, Ashland, OR).
Phagocytosis assay
Phagocytosis of FITC‐Dextran by BMM or pTHP‐1 cells was measured as the cellular uptake of FITC‐Dextran and quantified by flow cytometry as described previously.17 Internalization ability was evaluated at the percentage or mean fluorescence intensity of FITC‐positive cells gated on the CD11b+ F4/80+ BMM or gated on THP‐1 cells.
Intracellular cytokine staining
Cytokine‐producing BMM were calculated by gating on CD11b+ F4/80+ BMM as described previously.17 Cytokine‐producing pTHP‐1 cells were calculated by gating on all collected cells. Data were collected with a BD LSR II flow cytometer and analysed by flowjo software.
Quantification of IL‐10 and IL‐12 by ELISA
Levels of IL‐10 and IL‐12 in the supernatants were determined using ELISA kits (Biolegend Inc.) according to the manufacturer's instructions. The values were normalized to the cell numbers.
Gene expression analysis
Total RNA was isolated from cell lysates following the manufacturer's instructions (RNeasy Mini Kit; Qiagen, Hilden, Germany), quantified using a Nanodrop spectrophotometer (NanoDrop Technologies, Wilmington, DE) and reverse transcribed (Applied Biosystems, San Diego, CA). Real‐time quantitative PCR was performed on cDNA with the housekeeping gene rRNA 18S. The sequences of primers are listed in the Supplementary material, Table S1.
Western blotting
Western blotting was performed with 30 μg of protein per well. Band intensities were detected, normalized and quantified with the chemidoc and image lab 5.0 software (Bio‐Rad Laboratories, Hercules, CA). GAPDH and tubulin were used as loading controls depending on the molecular weights of the target proteins.
Statistics
Comparisons of two means were carried out using Student's t‐test and comparisons of three or more means were carried out using one‐way analysis of variance. Graphs were prepared using graphpad prism version 6 (GraphPad Software, San Diego, CA). Statistical significance was set at P < 0·05.
Results
Chronic exposure of bone marrow to palmitate leads to an anti‐inflammatory response
The BMM were differentiated by M‐CSF treatment of murine bone marrow cells. As we have shown previously, over 98% of the cells are CD11b+ F4/80+ macrophages following 7 days of treatment with M‐CSF.17 We evaluated the effect of palmitate on proliferation during BMM differentiation by measuring cellular DNA content and PCNA protein expression. As shown in Fig. 1(a), high doses of palmitate (0·2 and 0·4 mm) inhibited BMM proliferation in a dose‐dependent manner in comparison to vehicle control (P < 0·05 and P < 0·01, respectively). The decreased BMM cell counts were due in part to decreased CSF‐1R (CD115), the receptor for M‐CSF (Fig. 1b). This inhibition of proliferation was confirmed by a decrease in levels of PCNA protein (Fig. 1c). In comparison to vehicle control, high doses of palmitate (0·2 and 0·4 mm) significantly decreased CD115 expression (P < 0·01 and P < 0·001, respectively). In addition, 0·2 mm palmitate treatment of BMM produced a lower level of CD115 expression (P < 0·05 versus 0·1 mm). A low dose of palmitate (0·1 mm) protected BMM from apoptosis, but high doses of palmitate were toxic and stimulated apoptosis of BMM both with and without LPS priming (Fig. 1c).
Figure 1.
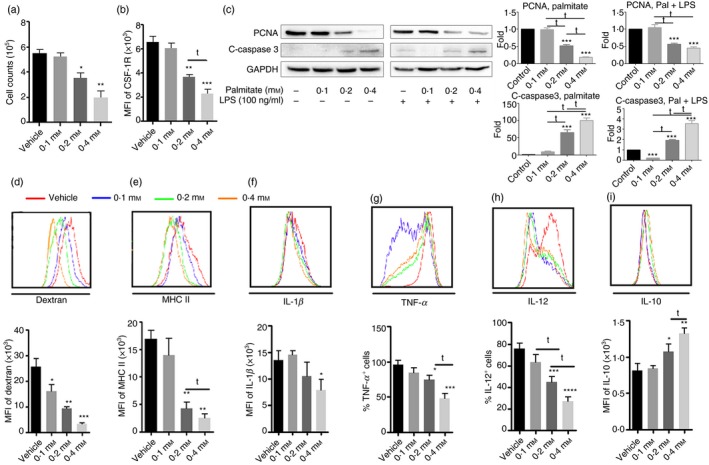
Chronic exposure of bone marrow to palmitate leads to anti‐inflammatory responses during bone marrow‐derived macrophages (BMM) differentiation. Bone marrow was cultured with various doses of palmitate (0·1, 0·2 and 0·4 mm) for 7 days. To activate macrophages, lipopolyaccharide (LPS; 100 ng/ml) was added in the last 24 hr. Macrophages without LPS treatment were set up as control. Based on gating of CD11b+ F4/80+ BMM, MHC II, CD115 and intracellular cytokine production were determined. Some cells were used for the cell proliferation assay and phagocytosis assay. (a) BMM numbers; (b) mean fluorescence intensity (MFI) of CD115 expression; (c) Western blot and densitometric analysis of proliferating cell nuclear antigen (PCNA) and cleaved‐caspase 3; (d) phagocytosis of Dextran‐FITC and its graphic format; (e) MHC II expression; (f) interleukin‐1 (IL‐1β); (g) tumour necrosis factor‐α (TNF‐α); (h) IL‐12; (i) IL‐10. Graph bars represent the mean ± SD of at least three independent experiments. *P < 0·05, **P < 0·01, ***P < 0·001 and ****P < 0·0001 compared with vehicle control. t P < 0·05 as comparison within treatments.
To examine whether palmitate influences antigen presentation by BMM, we first determined the ability of these cells to take up a fluorescence‐conjugated model antigen, FITC‐Dextran. As shown in Fig. 1(d), palmitate significantly inhibited the uptake of Dextran by BMM in all doses tested, in comparison to vehicle control (P < 0·05, P < 0·01 and P < 0·001 versus vehicle, respectively). Palmitate decreased Dextran uptake by almost 80% at a concentration of 0·4 mm (Fig. 1d). In addition, high doses of palmitate (0·2 and 0·4 mm) significantly inhibited MHC II expression compared with vehicle control (P < 0·001 for all comparisons) (Fig. 1e). Compared with 0·1 mm palmitate, 0·2 mm resulted in a lower level of MHC II expression (P < 0·05).
To examine whether palmitate influences cytokine secretion, we determined the intracellular levels of IL‐1β, TNF‐α and IL‐12 in BMM in response to LPS stimulation. As shown in Fig. 1(f), only 0·4 mm palmitate significantly inhibited IL‐1β production, as determined by intracellular cytokine staining (P < 0·05); however, both 0·2 and 0·4 mm palmitate significantly decreased TNF‐α production (P < 0·01 and P < 0·0001, respectively) (Fig. 1g). Compared with BMM treated with 0·2 mm palmitate, 0·4 mm palmitate led to a lower percentage of TNF‐α‐positive BMM (P < 0·01). In addition, both 0·2 and 0·4 mm palmitate significantly inhibited IL‐12 (Fig. 1h). In contrast to inhibited pro‐inflammatory cytokine production by high doses of palmitate (0·2 and 0·4 mm), IL‐10 expression was increased in response to LPS stimulation (Fig. 1i). Furthermore, there were significant differences between 0·1 mm versus 0·2 mm palmitate for IL‐12 production (P < 0·05) and between 0·2 mm versus 0·4 mm palmitate for TNF‐α, IL‐12 and IL‐10 production (P < 0·05 for all).
Overall, our results demonstrate that high doses of palmitate significantly influence BMM differentiation from bone marrow and promote an anti‐inflammatory phenotype.
High doses of palmitate drive mouse macrophage polarization to M2 from bone marrow by stimulating the PPARγ signalling pathway
Upon observing the inhibition of pro‐inflammatory cytokine secretion and reduced MHC II expression by palmitate, we set out to determine whether chronic palmitate treatment could induce M2 polarization. As shown in Fig. 2(a), 4 mm palmitate increased CD206 expression compared with vehicle control (P < 0·01). Quantitative RT‐PCR and Western blot analysis also confirmed increased expression of CD206 upon palmitate treatment (see Supplementary material, Fig. S1). To distinguish between the effects of palmitate and LPS, mRNA and protein samples from BMM with and without LPS treatment were analysed. We observed a significant increase in CD206 expression upon treatment with a high dose of palmitate in unprimed groups. Even with LPS priming, palmitate still showed significant stimulation of CD206 expression. In addition, 0·4 mm palmitate significantly inhibited Toll‐like receptor 4 (TLR4) expression (P < 0·05) (Fig. 2b), which is consistent with inhibited cytokine production as shown in Fig. 1. Secondly, we determined the levels of IL‐10 and IL‐12 in the culture media of BMM that had been treated with palmitate and the ratio of IL‐10/IL‐12 was calculated. As shown in Fig. 2(c,d), palmitate treatment significantly increased IL‐10 (P < 0·05) but decreased IL‐12 (P < 0·05). Consequently, the ratio of IL‐10/IL‐12 was elevated almost threefold in comparison to vehicle (P < 0·05) (Fig. 2e). Third, we measured PPARγ expression, an essential transcriptional factor that influences macrophage polarization.18 Palmitate significantly increased PPARγ expression. Expression of LXRα, the PPARγ integrator, and Arg 1, a PPARγ downstream modulator, were both increased (Fig. 2f). The significant elevation of the ratio of Arg 1 versus iNOS in response to a high dose of palmitate is suggestive of M2 polarization (Fig. 2f and see Supplementary material, Fig. S2). In Fig. 2(g,h), high doses of palmitate (0·2 and 0·4 mm) significantly increased protein levels of PPARγ (P < 0·05 and P < 0·01 versus vehicle control, respectively). Since PGC‐1α is a transcriptional coactivator of several nuclear receptors that regulate key metabolic steps in energy homeostasis, such as PPARγ,19 we determined its expression as well. In contrast to the elevated protein levels of PPARγ, high doses of palmitate (0·2 and 0·4 mm) significantly decreased PGC‐1α protein levels (P < 0·01 and P < 0·001 versus vehicle control, respectively) (Fig. 2g,i).
Figure 2.
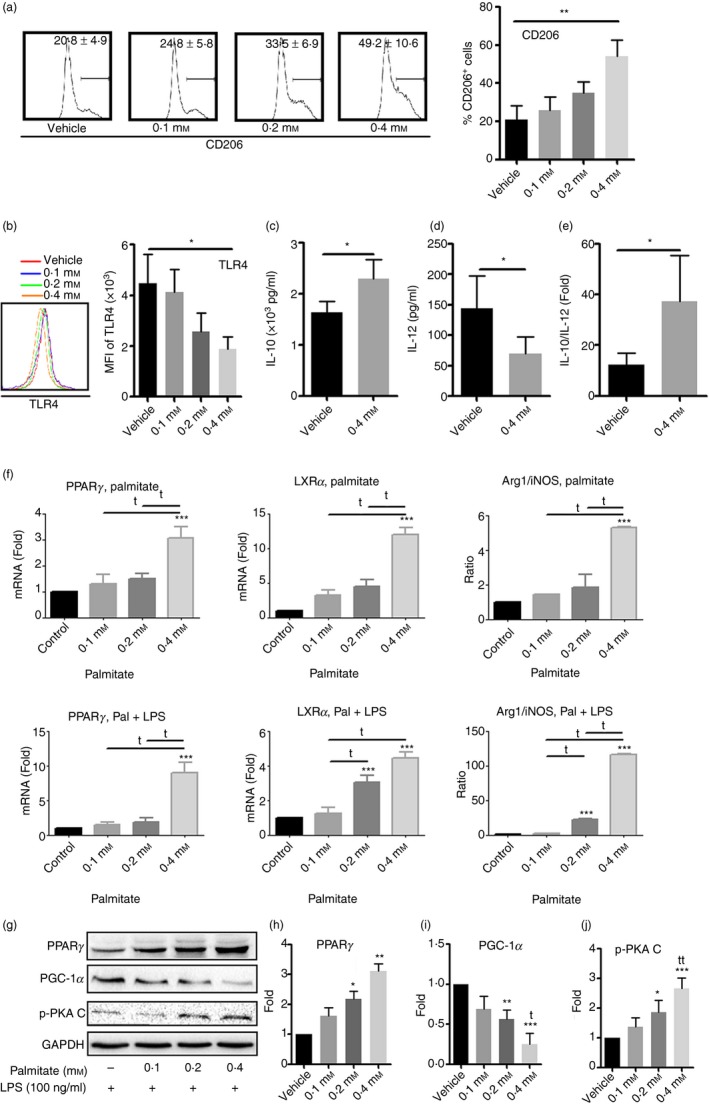
High doses of palmitate drive bone marrow‐derived macrophages (BMM) towards M2 polarization. Bone marrow was cultured with various doses of palmitate for 7 days. Expression of CD206, Toll‐like receptor 4 (TLR4) and peroxisome proliferator‐activated receptor‐γ (PPAR‐γ) as well as interleukin‐12 (IL‐12) and IL‐10 secretion in response to lipopolysaccharide (LPS) stimulation were determined. (a) Flow cytometry analysis of CD206 expression; (b) TLR4 expression by flow cytometry; (c) IL‐10 levels and (d) IL‐12 levels by ELISA and (e) IL‐10/IL‐12 ratio; (f) quantitative RT‐PCR analysis of PPARc, LXRa, Arginase 1 (Arg 1) and inducible nitric oxide synthase (iNOS) with or without LPS; (g‐j) Western blot and densitometric analysis of PPAR‐c, PGC‐1α and phospho‐Protein Kinase A, catalyst unit C (PKA C). Values represent the mean ± SD of three independent experiments. *P < 0·05, **P < 0·01 and ***P < 0.001 compared with vehicle control. t P < 0.05, tt P < 0.01 as comparison within treatment.
Overall, we found that palmitate treatment of bone marrow cells led to M2 polarization in tandem with up‐regulation of PPARγ and PGC‐1α.
The effect of palmitate on M2 polarization is ER dependent
It has been reported that ER stress can drive M2 polarization.14 We found that palmitate treatment significantly increased mRNA expression of multiple ER stress markers, including C/EBP homologous protein (CHOP), inositol‐requiring protein 1 alpha (IRE‐1α), spliced X‐box binding protein 1 (XBP‐1s) and activating transcription factor 6 (ATF6) (Fig. 3a). We observed a significant increase in the protein levels of the ER stress marker, BiP (P < 0·05) (Fig. 3b). In comparison to vehicle control, 0·1, 0·2 and 0·4 mm palmitate elevated protein levels of BiP approximately fivefold, fivefold and eightfold, respectively. PBA is one member of a group of chemical chaperones known to stabilize protein conformation, improve the protein folding capacity in the ER, and facilitate the trafficking of mutant proteins.20 It has potential anti‐diabetic effects in obese and diabetic mice by inhibiting the ER stress response.21 To examine the possible actions of PBA on palmitate, we pre‐conditioned bone marrow cells with PBA before adding palmitate at day 0, as well as before all media changes. As shown in Fig. 3(b), PBA treatment significantly attenuated the BiP response compared with 0·4 mm palmitate alone (P < 0·05). Typically, almost all BMM produce TNF‐α in response to overnight LPS stimulation; however, 0·4 mm palmitate treatment significantly inhibited TNF‐α production, and PBA reversed this effect (Fig. 3c). Conversely, 0·4 mm palmitate increased CD206 production, and PBA partially reversed this effect (P < 0·05) (Fig. 3d). PBA treatment also attenuated the effect of palmitate on BMM on MHC II, CD86 and IL‐12 production (data not shown).
Figure 3.
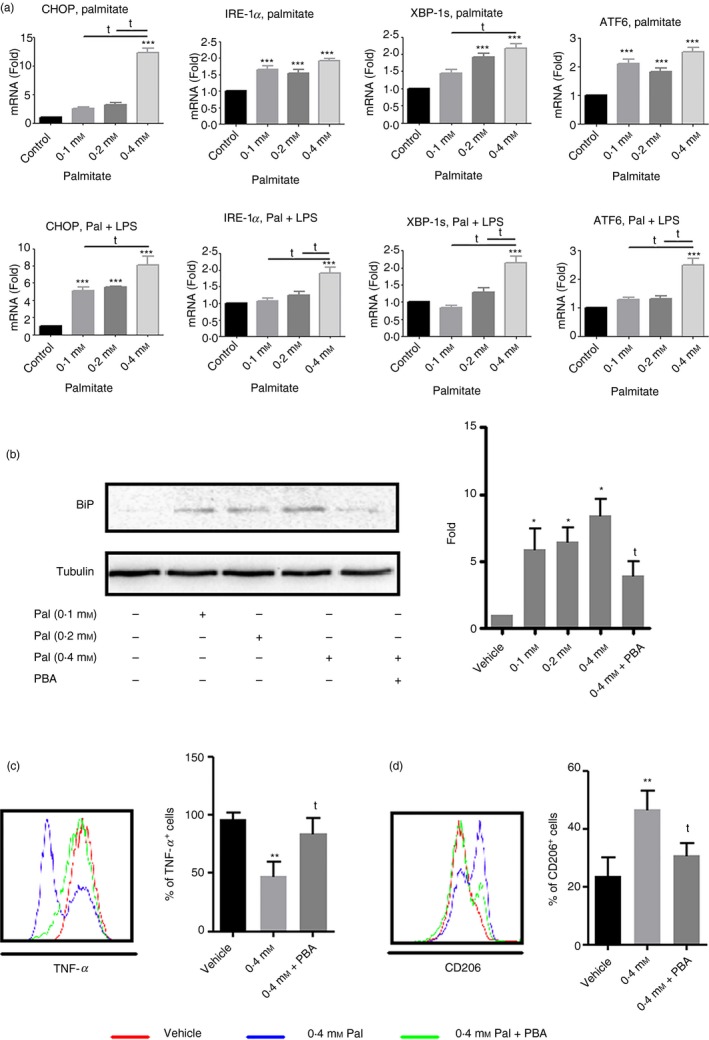
The effect of palmitate on M2 polarization is endoplasmic reticulum (ER) ‐dependent. Bone marrow cells were cultured with various doses of palmitate or preconditioned with 4‐phenylbutyrate (PBA); 20 ng/ml) followed by 0·4 mm palmitate treatment. After 7 days of culture, cells were harvested for quantitative RT‐PCR, Western blot analysis or for flow cytometry. A group of cells were activated with lipopolysaccharide (LPS) (100 ng/ml) for 24 hr. (a) Quantitative RT‐PCR of ER stress markers: CHOP, IRE‐1α, XBP‐1s and ATF6; (b) binding immunoglobulin protein (BiP) expression; (c) tumour necrosis factor‐α (TNF‐α) production and (d) CD206 expression after PBA treatment. *P < 0·05, **P < 0.01 and ***P < 0·001 versus vehicle control; t P < 0·05 and tt P < 0·01 versus 0·4 mm palmitate.
Palmitate induces a pro‐inflammatory response in differentiated mouse macrophages
To examine how palmitate affects differentiated mouse bone marrow‐derived macrophages (as opposed to its effect on the differentiation process, described above), we treated BMM that had been differentiating for 7 days with varying doses of palmitate. First, we determined the expression levels of markers that are commonly used to characterize macrophages, such as CD86, TLR4, MHC II and CD36. As shown in Fig. 4(a), all three doses of palmitate increased CD86 expression (P < 0·001, P < 0·01 and P < 0·01, for 0·1, 0·2 and 0·4 mm, respectively). Higher doses of palmitate (0·2 and 0·4 mm) had no effect on TLR4 expression, whereas low‐dose palmitate (0·1 mm) significantly increased it (Fig. 4b). Lower doses of palmitate had no effect on MHC II expression, although 0·4 mm palmitate significantly decreased it (P < 0·05) (Fig. 4c). A recent study showed that CD36 is not required for palmitate uptake, rather, it is important for low‐density lipoprotein uptake.22 Consistent with these findings, low doses of palmitate had no effect on CD36 expression, but 0·4 mm palmitate significantly decreased it (P < 0·001) (Fig. 4d). High doses of palmitate (0·2 and 0·4 mm) caused a decrease in CD115 expression (P < 0·05) (Fig. 4e). In line with the pattern of TLR4 expression, low‐dose palmitate significantly increased NOS2 production (75·5 ± 5·4% versus 51·7 ± 6·5%) (P < 0·05), whereas high doses of palmitate had no effect (Fig. 4f).
Figure 4.
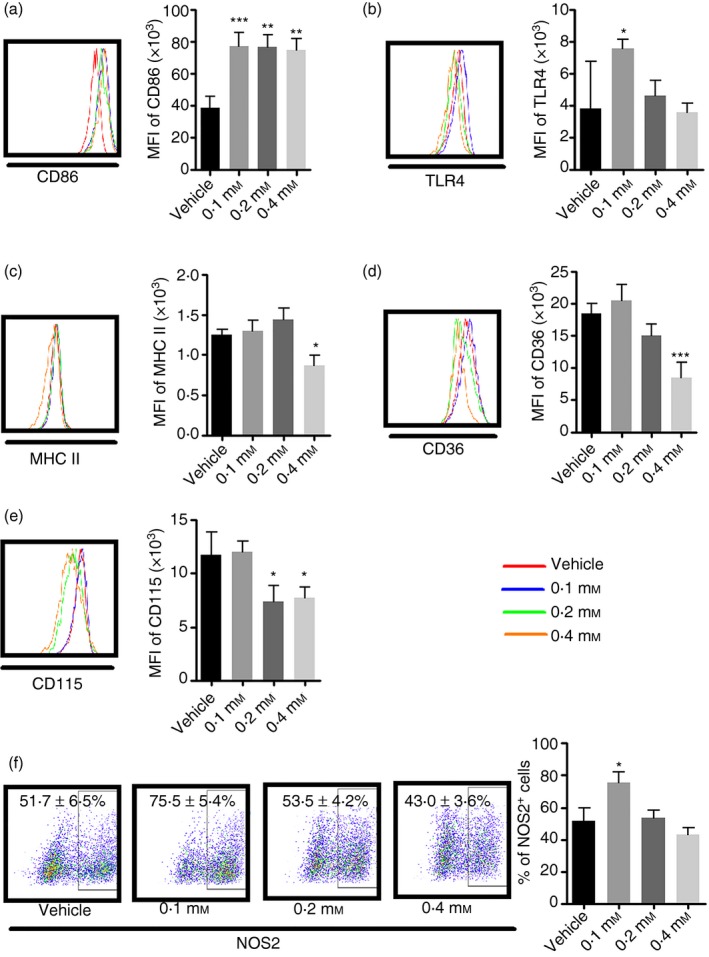
Palmitate induces a pro‐inflammatory immune response in differentiated macrophages. On the 7th day of bone marrow‐derived macrophages (BMM) culture, various doses of palmitate were added into the culture for a further 24 hr culture. Then the phenotype and cytokine secretion in response to lipopolysaccharide (LPS) stimulation was determined. (a) CD86 expression; (b) Toll‐like receptor 4 (TLR4) expression; (c) MHC II expression; (d) CD36 expression; (e) CD115 expression; (f) NOS2 expression by intracellular staining. Values represent the mean ± SD of three independent experiments. *P < 0·05 and **P < 0·01 compared with vehicle control.
In general, in contrast to the anti‐inflammatory effects of palmitate on differentiating BMM, low‐dose palmitate leads to pro‐inflammatory responses in already differentiated BMM. This effect was not dependent on treatment duration because treatment with low doses of palmitate for up to 72 hr also led to a pro‐inflammatory response (data not shown here).
Palmitate treatment leads to an anti‐inflammatory response in differentiating THP‐1 cells
As observed in mouse BMM, high doses of palmitate inhibited pTHP‐1 proliferation and stimulated apoptosis (Fig. 5a and see Supplementary material, Fig. S3) as well as inducing M2 polarization, as measured by mRNA expression and protein levels of PPARγ, LXRα and CD206 (Fig. 5b,c and see Supplementary material, Fig. S4).
Figure 5.
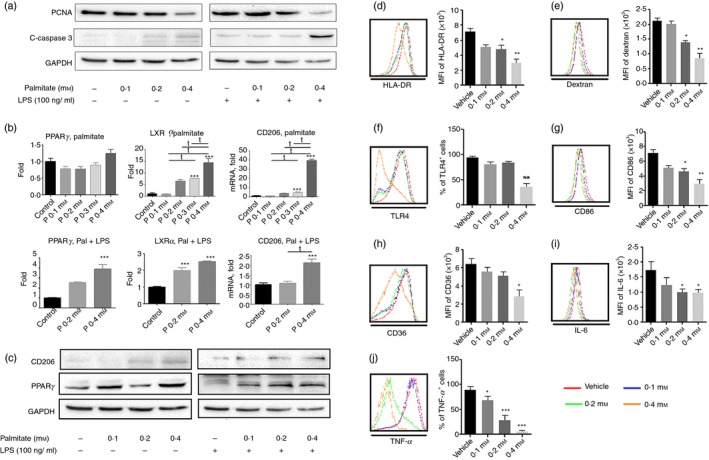
Palmitate induces anti‐inflammatory responses in differentiating human macrophages. PMA‐activated THP‐1 cells were treated with various doses of palmitate for 48 hr. Then the phenotypes and cytokine secretion levels with or without lipopolysaccharide ( LPS) stimulation were determined. (a) Western blot analysis of proliferating cell nuclear antigen (PCNA) and cleaved‐caspase 3; (b) quantitative RT‐PCR of PPARg, LXRa and MR (CD206); (c) Western blot analysis of MR (CD206) and peroxisome proliferator‐activated receptor‐γ (PPAR γ); (d) HLA‐DR expression; (e) Dextran uptake; (f) Toll‐like receptor 4 (TLR4) expression; (g) CD86 expression; (h) CD36 expression; (i) interleukin‐6 (IL‐6) and (j) tumour necrosis factor‐α (TNF‐α) by intracellular staining. Values represent the mean ± SD of three independent experiments. *P < 0·05, **P < 0·01 and ***P < 0·001 compared with vehicle control; t P < 0·05 versus 0·4 mm palmitate.
Palmitate inhibited HLA‐DR expression and phagocytosis of pTHP‐1 cells. Both 0·2 and 0·4 mm palmitate significantly inhibited HLA‐DR expression (P < 0·05 and P < 0·01, respectively) (Fig. 5d) and Dextran uptake (P < 0·05 and P < 0·01, respectively) (Fig. 5e). Palmitate also decreased CD86 and TLR4 expression. Whereas both 0·2 and 0·4 mm palmitate significantly decreased CD86 expression (P < 0·05 and P < 0·01, respectively) (Fig. 5g), only 0·4 mm palmitate inhibited TLR4 expression (P < 0·01) (Fig. 5f). Consequently, palmitate depressed TNF‐α and IL‐6 expression. In comparison to vehicle control, all doses of palmitate tested inhibited TNF‐α production (P < 0·05, P < 0·001 and P < 0·001 versus vehicle, respectively) (Fig. 5j). The 0·4 mm palmitate dose dampened its production in response to LPS stimulation. Consistent with decreased TNF‐α production, both 0·2 and 0·4 mm palmitate significantly inhibited IL‐6 secretion (P < 0·05) (Fig. 5i). We also found that palmitate regulated CD36 expression. Higher doses of palmitate (0·4 mm) inhibited CD36 expression (P < 0·05) (Fig. 6h).
Figure 6.
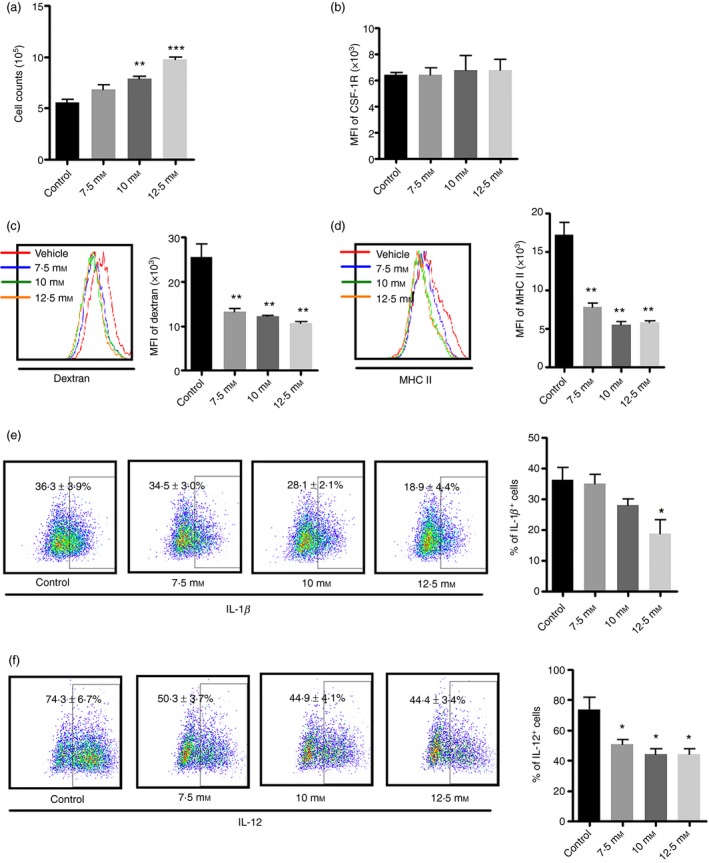
Chronic exposure of bone marrow to hyperglycaemia leads to anti‐inflammatory macrophage responses during bone marrow‐derived macrophages (BMM) differentiation. Bone marrow was cultured with various doses of glucose (7·5, 10 and 12·5 mm). lipopolysaccharide (LPS; 100 ng/ml) was added in the last 24 hr. Based on gating of CD11b+ F4/80+ BMMs, MHC II, CD115 and intracellular cytokine production were determined. Some cells were used for the cell proliferation assay and phagocytosis assay. (a) BMM numbers; (b) mean fluorescence intensity (MFI) of CD115 expression; (c) phagocytosis of Dextran‐FITC and its graphic format; (d) MHC II expression; (e) interleukin‐1β (IL‐1β); (f) IL‐12. Graph bars represent the mean ± SD of three independent experiments. *P < 0·05, **P < 0·01 and ***P < 0·001 compared with vehicle control.
Overall, palmitate also induced anti‐inflammatory responses in differentiating THP‐1 cells.
High glucose impairs inflammatory response of bone marrow macrophages
Like palmitate, high glucose (HG) also had remarkable effects on BMM. As shown in Fig. 6(a), HG promoted BMM proliferation as reflected by increased BMM numbers in a dose‐dependent manner, but only 10 and 12·5 mm glucose had significant effects in comparison with control (P < 0·01 and P < 0·001, respectively). The increase in the number of BMM was probably not due to CD115 expression as we did not observe a coordinated decrease of CD115 expression (Fig. 6b). Since we used unfractionated bone marrow in our BMM culture system, this increase in cell number might be due to increased neutrophil production of S100A8/S100A9, which promotes the differentiation of common myeloid progenitor cells and so leads to enhanced myelopoiesis.23 HG also inhibited BMM antigen uptake of Dextran and MHC II expression (Fig. 6c,d). All doses of glucose tested significantly decreased phagocytosis of Dextran (P < 0·01 for all) and MHC II expression in BMM (P < 0·01 for all). In comparison to the control, roughly only 50% of BMM treated with glucose were Dextran positive. In addition, HG inhibited the production of pro‐inflammatory cytokines (Fig. 6e,f). Glucose at 12·5 mm significantly repressed IL‐1β production, as determined by intracellular cytokine staining (Fig. 6e). In addition, all doses of glucose decreased IL‐12 production (P < 0·05 versus control for all) (Fig. 6f). HG only slightly decreased TNF‐α secretion and did not have an effect on IL‐10 expression (data not shown here).
Taken together, our data demonstrate that chronic exposure of bone marrow to HG impairs inflammatory responses of the macrophages.
HG exacerbates the effect of palmitate
As the levels of both FFA and glucose are elevated in many critical illnesses, we examined whether they have combined effects on BMM function. Previous studies have shown that FFA and HG induce a combined effect on the pro‐inflammatory response in a human monocyte cell line;15, 24 however, their combined effects on BMM and human macrophages have not yet been investigated. We therefore examined their combined effects in both BMM and differentiated THP‐1 cells. We treated bone marrow with either glucose (10 mm) or palmitate (0·2 mm) alone or in combination and then examined antigen uptake and cytokine secretion. As expected, the combination of palmitate and HG resulted in lower MHC II expression compared with either palmitate or HG alone (P < 0·05 and P < 0·001, respectively) (Fig. 7a). BMM also had a significantly lower antigen uptake of Dextran when treated with both HG and palmitate (P < 0·01 versus HG and P < 0·05 versus palmitate, respectively) (Fig. 7b). Palmitate plus HG significantly decreased TNF‐α expression (P < 0·01 versus HG and P < 0·05 versus palmitate) (Fig. 7c), but increased IL‐10 expression (P < 0·05 versus HG) (Fig. 7d), even though HG alone did not have significant effects. In combination with palmitate, HG also attenuated expression of IL‐12 and IL‐1β (data not shown).
Figure 7.
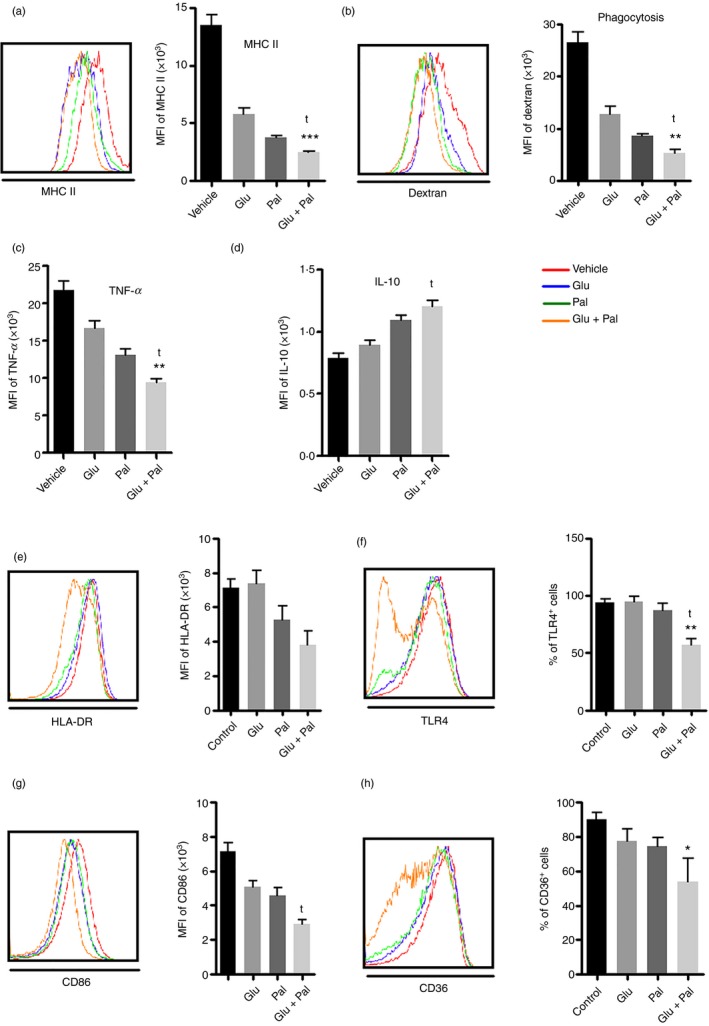
Hyperglycaemia exacerbates the effect of palmitate. Bone marrow (a–d) or pTHP‐1 cells (e–h) were treated with 0·4 mm palmitate with or without hyperglycaemia (10 mm glucose). (a) MHC II expression; (b) Dextran uptake; (c) tumour necrosis factor‐α (TNF‐α) and (d) interleukin‐10 (IL‐10) production by intracellular staining; (e) HLA‐DR expression; (f) Toll‐like receptor 4 (TLR4) expression; (g) CD86 expression; (h) CD36 expression. Values represent the mean ± SD of three independent experiments. *P < 0·05, **P < 0·01 and ***P < 0·001 compared with glucose alone. t P < 0·05 as compared to palmitate alone.
We also examined the combined effects of HG and palmitate on human pTHP‐1 cells. High doses of glucose could not regulate the phenotypes and functions of differentiating THP‐1 cells (data not shown here). However, as shown in Fig. 7(e,f), in combination with HG, palmitate significantly inhibited HLA‐DR (P < 0·05 versus HG) and TLR4 (P < 0·01 versus HG and P < 0·05 versus palmitate, respectively). In addition, their combination also led to a significant decrease of CD86 (P < 0·05 versus palmitate) (Fig. 7g) and CD36 expression (P < 0·05 versus HG) (Fig. 7h).
Taken together, in combination with HG, palmitate had more profound effects on macrophages.
Discussion
Our study demonstrates that high doses of palmitate drive M2 polarization, which occurs in tandem with the activation of the PPARγ signalling pathway in murine BMM. Palmitate treatment of bone marrow significantly decreased pro‐inflammatory cytokine secretion, CD206 and MHC II expression during macrophage differentiation. This effect was mediated by inducing ER stress, as demonstrated by PBA inhibition of the effects of palmitate. HG alone did not lead to M2 polarization. Rather, it had synergistic effects when used simultaneously with palmitate. Consistent with many recently published studies,11, 12 we found that 24‐hr treatment of differentiated macrophages with palmitate led to a pro‐inflammatory phenotype. It is interesting to note that the immune responses of macrophages are dependent on whether palmitate is added during the differentiation process (at day 0) or to fully differentiated macrophages (after 7 days of differentiation). Palmitate induces macrophage polarization towards an M2 phenotype when it is added into bone marrow cells during differentiation; however, it induces a pro‐inflammatory phenotype when it is added to already differentiated macrophages. The induction of an anti‐inflammatory response in differentiating macrophages by palmitate was also confirmed in a human monocyte cell line (THP‐1). The mechanisms underlying these differential responses are unknown. It is possible that macrophage progenitor cells and mature macrophages have different nutrient requirements.
The network of molecular mediators that regulate M2 polarization in response to hypermetabolism is not fully understood, but PPARγ, PGC‐1α and PPARγ target genes, such as Arg 1 and CD36 are implicated in this process. The nuclear receptor PPARγ is a ligand‐activated transcription factor that plays an important role in the control of gene expression linked to a variety of physiological processes, particularly glucose and lipid metabolism.25 PPARγ has been increasingly considered as a master regulator that skews human monocytes toward an anti‐inflammatory M2 phenotype.26 Consequently, synthetic high‐affinity PPARγ ligands, such as thiazolidinediones, have been widely used for the treatment of type 2 diabetes mellitus in clinical practice. PGC‐1α is a transcriptional co‐activator of several nuclear receptors that regulate key metabolic steps in energy homeostasis, such as PPARγ. Recent studies indicate that over‐expression of PGC‐1α inhibits foam cell formation in BMM27 and is required for an acute LPS‐induced TNF‐α response in skeletal muscle.28 The repressed PGC‐1α expression in our study might therefore be involved in M2 polarization, as foam cell formation is believed to be essential for M2 polarization in response to hyperlipidaemia. As the co‐modulator of PPARγ in macrophage polarization, LXRα functions to maintain whole sterol homeostasis and so transcriptionally controls lipid homeostasis. Transcriptional stimulation of LXRα by palmitate is consistent with the transrepression signalling of pro‐inflammatory activation of macrophages. Moreover, LXRα activation by palmitate may also contribute to the inhibition of proliferation.29 CD36 is a member of the scavenger receptor family with a broad cell type expression and has been recognized as a lipid and fatty acid receptor. CD36 is important for macrophage foam cell formation and M2 polarization.14 Although it is not required for increased palmitate uptake by M2 macrophages, it is important for low‐density lipoprotein uptake and M2 activation.22, 30 Consistent with this, we did not find up‐regulation of CD36, rather, we found that high‐dose palmitate inhibits CD36 expression.
Macrophages are a major player in the dysfunctional immune response in many critical illnesses because of their large numbers in the tissues and, consequently, as the major cell source of cytokines during injuries.31 Classical activation of macrophage provides a rapid response to invading pathogens and coping with a hypoxic microenvironment over a range of hours to days. In contrast, M2 macrophages carry out long‐term activities such as tissue remodelling and repair. Accordingly, they have distinct metabolic provisional requirements. Whereas anaerobic glycolysis in M1‐polarized macrophages provides quick energy requirements, oxidative glucose metabolism and fatty acid oxidation provides M2 macrophages with more efficient and sustainable energy.32 Consistent with this, infiltration of subcutaneous and visceral adipose tissue with a large number of alternatively activated macrophages has been observed in non‐surviving patients with prolonged critical illness.8 This is not likely to be the result of the M2 activators because the circulating levels of IL‐4 and IL‐13 are low, rather, PPARγ is significantly elevated, which may lead to M2 polarization.8 Another study in patients with severe burns found a dominant presence of M2b monocytes in the periphery. Catecholamines are believed to play a significant role in M2 polarization in burn patients.9 Other factors like IL‐10, glucocorticoid, hormones, apoptotic cells, immune complexes, all of which are increased in critical illness, can also polarize macrophages to an M2‐like phenotype.26 Our results demonstrate that in addition to the factors mentioned above, hyperglycaemia and hyperlipidaemia can also modify the phenotype of macrophages. M2 polarization resulting from chronic exposure of macrophage precursors to palmitate is important because it may represent another mechanism of M2 polarization in critical illness. This therefore raises the possibility that better therapeutic action may be achieved by targeting multiple factors including hyperglycaemia and hyperlipidaemia.
Immunosuppression resulting from critical illness is a serious problem that is associated with increased mortality and secondary infection.33 Down‐regulated HLA‐DR is a sensitive and reliable marker for immunosuppression. Many factors contribute to decreased expression of HLA‐DR, such as IL‐10, LPS and catecholamines.17 Our findings indicate that hyperglycaemia and hyperlipidaemia (which are present in many critical illnesses) could dampen the adaptive immunity by inhibiting MHC II expression; therefore, in addition to the factors mentioned above, hyperglycaemia and hyperlipidaemia are potential contributors to immunosuppression in severely burned patients. Moreover, the alternative activation of macrophages driven by palmitate leads to inhibited pro‐inflammatory cytokine secretion, such as TNF‐α and IL‐12, which might contribute to the immunosuppression in critical illness as well.
Developing new therapies for immunosuppression resulting from sepsis and severe trauma has been particularly challenging. As macrophages are major players in sepsis, not only in removal of pathogens and apoptotic cells but also an important part of adaptive immunity, the identification of mechanisms and molecules associated with macrophage plasticity and polarized activation are essential for macrophage‐centred diagnostic and therapeutic strategies. Accumulating studies indicate that glycaemic control is an important adjuvant therapy in such patients and improves their survival.6, 34, 35 Based on our findings, the combination of glycaemic and lipid control might improve the immune response in prolonged critical illness.
Disclosures
No conflicts of interest are declared by the authors.
Supporting information
Figure S1. Palmitate increases CD206 expression in bone marrow‐derived macrophages (BMM) with and without lipopolyaccharide (LPS). (a) Quantitative RT‐PCR and (b) Western blot analysis of CD206 in BMM upon palmitate treatment with and without LPS activation. Values represent the mean ± SD of three independent experiments. *P < 0·05, **P < 0·01 and ***P < 0·001 compared with vehicle control; t P < 0·05 between treatment groups.
Figure S2. Impact of palmitate treatment on mRNA expression of arginase 1 (Arg 1) and inducible nitric oxide synthase (iNOS) in bone marrow‐derived macrophages (BMM) with and without lipopolysaccharide (LPS) activation. Values represent the mean ± SD of three independent experiments. ***P < 0·001 compared with vehicle control; t P < 0·05 between treatment groups.
Figure S3. Densitometry of proliferating cell nuclear antigen (PCNA) and cleaved‐Caspase 3 Western blot of pTHP‐1 upon palmitate treatment with and without lipopolysaccharide (LPS) activation. Values represent the mean ± SD of three independent experiments. *P < 0·05, **P < 0·01 and ***P < 0·001 compared with vehicle control; t P < 0·05 between treatment groups.
Figure S4. Densitometry of CD206 and peroxisome proliferator‐activated receptor‐γ (PPAR‐γ) Western blot of pTHP‐1 upon palmitate treatment with and without lipopolysaccharide (LPS) activation. Values represent the mean ± SD of three independent experiments. *P < 0·05, **P < 0·01 and ***P < 0·001 compared with vehicle control; t P < 0·05 between treatment groups.
Table S1. Primer sequences for quantitative RT‐PCR.
Acknowledgements
This work is supported by grants from the National Institutes of Health (R01 GM087285‐01); CIHR Funds (123336), CFI Leader's Opportunity Fund (Project #25407); Physician's Services Incorporated Foundation: Health Research Grant Program. The authors thank Dr D Patsouris, Dr X Dai and Dr E Bogdanovic for critical review of the manuscript. The authors thank Dr S Costford for final reviewing and editing of the manuscript. FX and MJ designed the study. FX and LD performed most experiments, PQ and MC performed some experiments. FX and LD contributed equally to the work.
References
- 1. Laird AM, Miller PR, Kilgo PD, Meredith JW, Chang MC. Relationship of early hyperglycemia to mortality in trauma patients. J Trauma 2004; 56:1058–62. [DOI] [PubMed] [Google Scholar]
- 2. Krinsley JS. Association between hyperglycemia and increased hospital mortality in a heterogeneous population of critically ill patients. Mayo Clin Proc 2003; 78:1471–8. [DOI] [PubMed] [Google Scholar]
- 3. van den Berghe G, Wouters P, Weekers F, Verwaest C, Bruyninckx F, Schetz M et al Intensive insulin therapy in critically ill patients. N Engl J Med 2001; 345:1359–67. [DOI] [PubMed] [Google Scholar]
- 4. Cappi SB, Noritomi DT, Velasco IT, Curi R, Loureiro TC, Soriano FG. Dyslipidemia: a prospective controlled randomized trial of intensive glycemic control in sepsis. Intensive Care Med 2012; 38:634–41. [DOI] [PubMed] [Google Scholar]
- 5. Kraft R, Herndon DN, Finnerty CC, Hiyama Y, Jeschke MG. Association of postburn fatty acids and triglycerides with clinical outcome in severely burned children. J Clin Endocrinol Metab 2013; 98:314–21. [DOI] [PMC free article] [PubMed] [Google Scholar]
- 6. Williams FN, Herndon DN, Jeschke MG. The hypermetabolic response to burn injury and interventions to modify this response. Clin Plast Surg 2009; 36:583–96. [DOI] [PMC free article] [PubMed] [Google Scholar]
- 7. Lumeng CN, Bodzin JL, Saltiel AR. Obesity induces a phenotypic switch in adipose tissue macrophage polarization. J Clin Invest 2007; 117:175–84. [DOI] [PMC free article] [PubMed] [Google Scholar]
- 8. Langouche L, Marques MB, Ingels C, Gunst J, Derde S, Vander Perre S et al Critical illness induces alternative activation of M2 macrophages in adipose tissue. Crit Care 2011; 15:R245. [DOI] [PMC free article] [PubMed] [Google Scholar]
- 9. Kobayashi M, Jeschke MG, Asai A, Kogiso M, Yoshida S, Herndon DN et al Propranolol as a modulator of M2b monocytes in severely burned patients. J Leukoc Biol 2011; 89:797–803. [DOI] [PubMed] [Google Scholar]
- 10. Katakura T, Miyazaki M, Kobayashi M, Herndon DN, Suzuki F. CCL17 and IL‐10 as effectors that enable alternatively activated macrophages to inhibit the generation of classically activated macrophages. J Immunol 2004; 172:1407–13. [DOI] [PubMed] [Google Scholar]
- 11. Nguyen MT, Favelyukis S, Nguyen AK, Reichart D, Scott PA, Jenn A et al A subpopulation of macrophages infiltrates hypertrophic adipose tissue and is activated by free fatty acids via Toll‐like receptors 2 and 4 and JNK‐dependent pathways. J Biol Chem 2007; 282:35279–92. [DOI] [PubMed] [Google Scholar]
- 12. Bunn RC, Cockrell GE, Ou Y, Thrailkill KM, Lumpkin CK Jr, Fowlkes JL. Palmitate and insulin synergistically induce IL‐6 expression in human monocytes. Cardiovasc Diabetol 2010; 9:73. [DOI] [PMC free article] [PubMed] [Google Scholar]
- 13. Chan KL, Pillon NJ, Sivaloganathan DM, Costford SR, Liu Z, Theret M et al Palmitoleate Reverses High Fat‐induced Proinflammatory Macrophage Polarization via AMP‐activated Protein Kinase (AMPK). J Biol Chem 2015; 290:16979–16988. [DOI] [PMC free article] [PubMed] [Google Scholar]
- 14. Oh J, Riek AE, Weng S, Petty M, Kim D, Colonna M et al Endoplasmic reticulum stress controls M2 macrophage differentiation and foam cell formation. J Biol Chem 2012; 287:11629–41. [DOI] [PMC free article] [PubMed] [Google Scholar]
- 15. Dasu MR, Jialal I. Free fatty acids in the presence of high glucose amplify monocyte inflammation via Toll‐like receptors. Am J Physiol Endocrinol Metab 2011; 300:E145–54. [DOI] [PMC free article] [PubMed] [Google Scholar]
- 16. Takashiba S, Van Dyke TE, Amar S, Murayama Y, Soskolne AW, Shapira L. Differentiation of monocytes to macrophages primes cells for lipopolysaccharide stimulation via accumulation of cytoplasmic nuclear factor kappaB. Infect Immun 1999; 67:5573–8. [DOI] [PMC free article] [PubMed] [Google Scholar]
- 17. Xiu F, Stanojcic M, Jeschke MG. Norepinephrine inhibits macrophage migration by decreasing CCR2 expression. PLoS One 2013; 8:e69167. [DOI] [PMC free article] [PubMed] [Google Scholar]
- 18. Ivashkiv LB. Epigenetic regulation of macrophage polarization and function. Trends Immunol 2013; 34:216–23. [DOI] [PMC free article] [PubMed] [Google Scholar]
- 19. Puigserver P, Spiegelman BM. Peroxisome proliferator‐activated receptor‐γ coactivator 1α (PGC‐1α): transcriptional coactivator and metabolic regulator. Endocr Rev 2003; 24:78–90. [DOI] [PubMed] [Google Scholar]
- 20. Welch WJ, Brown CR. Influence of molecular and chemical chaperones on protein folding. Cell Stress Chaperones 1996; 1:109–15. [DOI] [PMC free article] [PubMed] [Google Scholar]
- 21. Ozcan U, Yilmaz E, Ozcan L, Furuhashi M, Vaillancourt E, Smith RO et al Chemical chaperones reduce ER stress and restore glucose homeostasis in a mouse model of type 2 diabetes. Science 2006; 313:1137–40. [DOI] [PMC free article] [PubMed] [Google Scholar]
- 22. Huang SC, Everts B, Ivanova Y, O'Sullivan D, Nascimento M, Smith AM et al Cell‐intrinsic lysosomal lipolysis is essential for alternative activation of macrophages. Nat Immunol 2014; 15:846–55. [DOI] [PMC free article] [PubMed] [Google Scholar]
- 23. Nagareddy PR, Murphy AJ, Stirzaker RA, Hu Y, Yu S, Miller RG et al Hyperglycemia promotes myelopoiesis and impairs the resolution of atherosclerosis. Cell Metab 2013; 17:695–708. [DOI] [PMC free article] [PubMed] [Google Scholar]
- 24. Lamharzi N, Renard CB, Kramer F, Pennathur S, Heinecke JW, Chait A et al Hyperlipidemia in concert with hyperglycemia stimulates the proliferation of macrophages in atherosclerotic lesions: potential role of glucose‐oxidized LDL. Diabetes 2004; 53:3217–25. [DOI] [PubMed] [Google Scholar]
- 25. Wahli W, Michalik L. PPARs at the crossroads of lipid signaling and inflammation. Trends Endocrinol Metab 2012; 23:351–63. [DOI] [PubMed] [Google Scholar]
- 26. Sica A, Mantovani A. Macrophage plasticity and polarization: in vivo veritas . J Clin Invest 2012; 122:787–95. [DOI] [PMC free article] [PubMed] [Google Scholar]
- 27. McCarthy C, Lieggi NT, Barry D, Mooney D, de Gaetano M, James WG et al Macrophage PPARγ Co‐activator‐1 alpha participates in repressing foam cell formation and atherosclerosis in response to conjugated linoleic acid. EMBO Mol Med 2013; 5:1443–57. [DOI] [PMC free article] [PubMed] [Google Scholar]
- 28. Olesen J, Larsson S, Iversen N, Yousafzai S, Hellsten Y, Pilegaard H. Skeletal muscle PGC‐1α is required for maintaining an acute LPS‐induced TNFα response. PLoS One 2012; 7:e32222. [DOI] [PMC free article] [PubMed] [Google Scholar]
- 29. Kidani Y, Bensinger SJ. Liver X receptor and peroxisome proliferator‐activated receptor as integrators of lipid homeostasis and immunity. Immunol Rev 2012; 249:72–83. [DOI] [PMC free article] [PubMed] [Google Scholar]
- 30. Podrez EA, Poliakov E, Shen Z, Zhang R, Deng Y, Sun M et al A novel family of atherogenic oxidized phospholipids promotes macrophage foam cell formation via the scavenger receptor CD36 and is enriched in atherosclerotic lesions. J Biol Chem 2002; 277:38517–23. [DOI] [PubMed] [Google Scholar]
- 31. Schwacha MG. Macrophages and post‐burn immune dysfunction. Burns 2003; 29:1–14. [DOI] [PubMed] [Google Scholar]
- 32. Odegaard JI, Chawla A. Alternative macrophage activation and metabolism. Annu Rev Pathol 2011; 6:275–97. [DOI] [PMC free article] [PubMed] [Google Scholar]
- 33. Hotchkiss RS, Monneret G, Payen D. Immunosuppression in sepsis: a novel understanding of the disorder and a new therapeutic approach. Lancet Infect Dis 2013; 13:260–8. [DOI] [PMC free article] [PubMed] [Google Scholar]
- 34. Xiu F, Stanojcic M, Diao L, Jeschke MG. Stress hyperglycemia, insulin treatment, and innate immune cells. Int J Endocrinol 2014; 2014:486403. [DOI] [PMC free article] [PubMed] [Google Scholar]
- 35. Mesotten D, Swinnen JV, Vanderhoydonc F, Wouters PJ, Van den Berghe G. Contribution of circulating lipids to the improved outcome of critical illness by glycemic control with intensive insulin therapy. J Clin Endocrinol Metab 2004; 89:219–26. [DOI] [PubMed] [Google Scholar]
Associated Data
This section collects any data citations, data availability statements, or supplementary materials included in this article.
Supplementary Materials
Figure S1. Palmitate increases CD206 expression in bone marrow‐derived macrophages (BMM) with and without lipopolyaccharide (LPS). (a) Quantitative RT‐PCR and (b) Western blot analysis of CD206 in BMM upon palmitate treatment with and without LPS activation. Values represent the mean ± SD of three independent experiments. *P < 0·05, **P < 0·01 and ***P < 0·001 compared with vehicle control; t P < 0·05 between treatment groups.
Figure S2. Impact of palmitate treatment on mRNA expression of arginase 1 (Arg 1) and inducible nitric oxide synthase (iNOS) in bone marrow‐derived macrophages (BMM) with and without lipopolysaccharide (LPS) activation. Values represent the mean ± SD of three independent experiments. ***P < 0·001 compared with vehicle control; t P < 0·05 between treatment groups.
Figure S3. Densitometry of proliferating cell nuclear antigen (PCNA) and cleaved‐Caspase 3 Western blot of pTHP‐1 upon palmitate treatment with and without lipopolysaccharide (LPS) activation. Values represent the mean ± SD of three independent experiments. *P < 0·05, **P < 0·01 and ***P < 0·001 compared with vehicle control; t P < 0·05 between treatment groups.
Figure S4. Densitometry of CD206 and peroxisome proliferator‐activated receptor‐γ (PPAR‐γ) Western blot of pTHP‐1 upon palmitate treatment with and without lipopolysaccharide (LPS) activation. Values represent the mean ± SD of three independent experiments. *P < 0·05, **P < 0·01 and ***P < 0·001 compared with vehicle control; t P < 0·05 between treatment groups.
Table S1. Primer sequences for quantitative RT‐PCR.