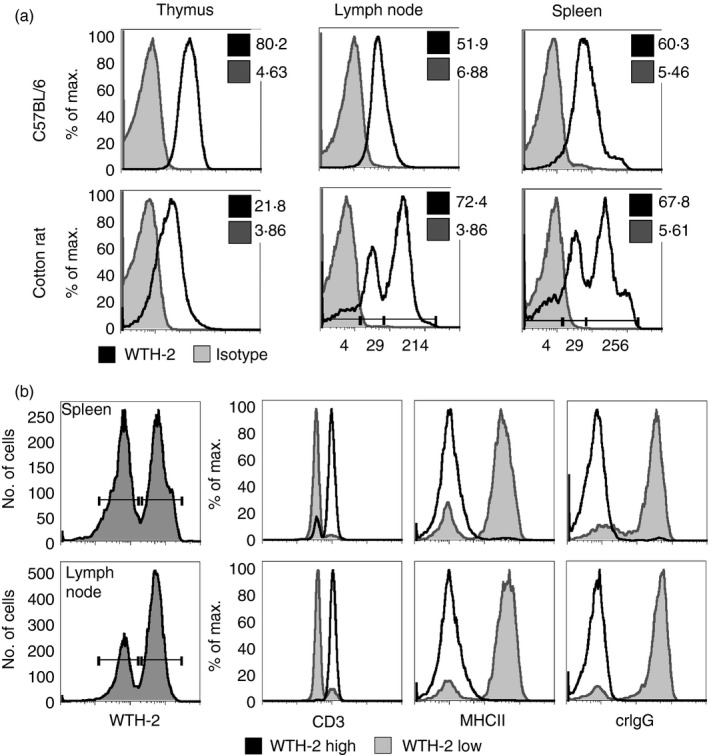
Figure 3.

Organ‐specific CD1d expression in cotton rat primary cells. (a) Representative data for a total of three experiments are shown. Cells (5 × 10⁵) isolated from mouse tissue or cotton rat tissues were stained with the monoclonal antibody (mAb) WTH‐2 FITC (2 μg/ml) or an isotype control. Geometric means of isotype control (tinted grey) or CD1d staining (black) are indicated in each graph. Geometric means of different expression levels (cotton rat lymph node and spleen) are additionally indicated below the histogram. (b) Primary cells (5 × 10⁵) where stained with biotinylated WTH‐2 (3·6 μg/ml) and antibodies against CD3 (2 μg/ml), MHC class II (5 μg/ml, GαM R‐PE) and cotton rat IgG (10 μg/ml, GαR FITC). WTH‐2 positive cells from cotton rat spleen and lymph node were divided into low and high expression and CD3, MHC class II and cotton rat IgG expression of those two populations are compared in histograms. Representative data for two independent experiments are shown.
