

Abstract
The quantitative characterization of mutational landscapes is a task of outstanding importance in evolutionary and medical biology: It is, for example, of central importance for our understanding of the phenotypic effect of mutations related to disease and antibiotic drug resistance. Here we develop a novel inference scheme for mutational landscapes, which is based on the statistical analysis of large alignments of homologs of the protein of interest. Our method is able to capture epistatic couplings between residues, and therefore to assess the dependence of mutational effects on the sequence context where they appear. Compared with recent large-scale mutagenesis data of the beta-lactamase TEM-1, a protein providing resistance against beta-lactam antibiotics, our method leads to an increase of about 40% in explicative power as compared with approaches neglecting epistasis. We find that the informative sequence context extends to residues at native distances of about 20 Å from the mutated site, reaching thus far beyond residues in direct physical contact.
Keywords: mutational landscape, genotype–phenotype mapping, epistasis, coevolution, statistical inference
Introduction
Protein mutational landscapes are genotype-to-phenotype mappings quantifying how mutations affect the biological functionality of a protein. They are closely related to fitness landscapes describing the replicative capacity of an organism as a function of its genotype (Wright 1932). Their comprehensive and accurate characterization is a task of outstanding importance in evolutionary and medical biology: It has a key role in our understanding of mutational pathways accessible in the course of evolution (Kauffman and Levin 1987; Weinreich et al. 2006; Poelwijk et al. 2007), it can lead to the identification of genetic determinants of complex diseases based on rare variants (Cirulli and Goldstein 2010), and it can guide toward the understanding of the functional contribution of molecular alterations to oncogenesis (Reva et al. 2011). In the context of antibiotic resistance, one of the most challenging problems in modern medicine, the understanding of the association between genetic variation and phenotypic effects can help to unveil patterns of adaptive mutations of the pathogens to gain drug resistance, and thereby hopefully guide toward the discovery of new therapeutic strategies (Ferguson et al. 2013).
One key issue in the description of a mutational landscape is to understand how much the effect of a mutation depends on the genetic background in which it appears (Weinreich et al. 2006; Chou et al. 2011; Khan et al. 2011). For instance, in the field of human genetic diseases, is the presence of a mutation enough to predict a pathology or do we have to know the whole genotype to make that assertion? In a more formal way, this question is equivalent to quantifying how epistasis, that is, the interaction between mutations through fitness, is shaping the mutational landscape. At the protein level, a destabilizing mutation might have a negligible phenotypic effect in a very stable protein, but a large one in an unstable protein (Bloom et al. 2005; Jacquier et al. 2013). If this destabilizing mutation increases, for example, the enzymatic activity, it will be beneficial in a stable protein, and deleterious in an unstable one (cf. Harms and Thornton 2013). Hence, the mutation is expected to be context dependent. Moreover, once a mutation has fixed, further mutations will build upon the specificity of that focal mutation, thereby creating a new genetic background with its specific interactions and interdependencies (Pollock et al. 2012). There are ample proofs of the existence of epistasis and condition-dependent effects (Breen et al. 2012; Harms and Thornton 2013; Schenk et al. 2013; de Visser and Krug 2014; Podgornaia and Laub 2015). Yet, it is not totally clear whether such interactions have a dominant or a minor effect in determining a mutation’s phenotypic impact.
Recent technological advances have made it possible to simultaneously quantify the effects of thousands to hundreds of thousands of mutants through either growth competition (Deng et al. 2012; McLaughlin Jr et al. 2012; Melamed et al. 2013; Roscoe et al. 2013; Podgornaia and Laub 2015) or isolated allele experiments (Jacquier et al. 2013; Firnberg et al. 2014; Romero et al. 2015). Experimental resolution can be good enough to detect even the effects of synonymous mutations (Firnberg et al. 2014). Despite the development of such high-throughput methods, measured genotypes cover only a tiny fraction of sequence space: The number of possible mutants grows exponentially with the number of single mutations, such that checking the viability of all possible genotypes further than one or two mutations away from a reference sequence becomes infeasible, even for short polypeptides. More precisely, the number of distinct single-residue mutants for typical proteins is in the range of . The number of all double mutants reaches the range of . Although this number is not yet experimentally accessible, it is needed to accurately assess the importance of epistasis. It has been argued that existing mutagenesis data are not sufficient for accurate landscape regression (Otwinowski and Plotkin 2014). Novel computational approaches exploring alternative data—in our case distant homologs—are thus urgently needed to gain a comprehensive picture of mutational landscapes. In this context, the growing amount of mutagenesis data offers the possibility to rigorously evaluate the performance of in silico models of mutational landscapes.
Several computational methods for predicting mutational effects on protein function have been proposed over the years. A first class relies on “structural” information, more precisely on changes in the thermodynamic stability (Capriotti et al. 2005; Cheng et al. 2006; Ng and Henikoff 2006; Capra and Singh 2007; Lonquety et al. 2009; Dehouck et al. 2011), which have been argued to play a key role in determining mutational effects (Bloom and Glassman 2009; Wylie and Shakhnovich 2011; Serohijos and Shakhnovich 2014; Echave et al. 2015). A second class (Ng and Henikoff 2003; Adzhubei et al. 2010) relies on “evolutionary” information extracted from independently evolving homologous proteins, showing variable amino acid sequences but conserved structure and function. Evolution provides a multitude of informative “experiments” on mutational landscapes. Critically important residues tend to be conserved, whereas unfavorable residues are observed less frequently.
None of these methods is able to model the effects of epistasis and sequence-context dependence of mutational effects. To overcome this limitation, we take inspiration from a recent development in structural biology. It has been recognized that coevolutionary information contained in large families of homologous proteins allows to extract accurate structural information from sequences alone (de Juan et al. 2013): Residues in contact in a protein’s fold, even if distant along the primary sequence, tend to show correlated patterns of amino acid occurrences. Inversely, correlated residues are not necessarily in contact, as correlations are inflated by indirect effects. Two residues, both being in contact to a third residue, will coevolve even if they are not in direct contact. The Direct-Coupling Analysis (DCA) (Weigt et al. 2009; Morcos et al. 2011) has been proposed to disentangle such indirect effects from direct (i.e., epistatic) couplings, which in turn have been observed to accurately predict residue–residue contacts. DCA and closely related methods thereby guide tertiary (Hopf et al. 2012; Marks et al. 2012; Nugent and Jones 2012; Sułkowska et al. 2012) and quaternary (Schug et al. 2009; Dago et al. 2012; Hopf et al. 2014; Ovchinnikov et al. 2014) protein structure prediction; and shed light on specificity and crosstalk in bacterial signal transduction (Procaccini et al. 2011; Cheng et al. 2014).
In this study, we propose a variant of DCA which assigns to each mutant sequence a statistical score, which in a next step is used for predicting the phenotype of the mutant sequence relative to the wild-type sequence. To evaluate the approach, we take the Escherichia coli beta-lactamase TEM-1, a model enzyme in biochemistry which provides resistance to beta-lactam antibiotics. Its mutational landscape has been quantitatively characterized measuring the minimum inhibitory concentration (MIC) of the antibiotic (Davison et al. 2000; Jacquier et al. 2013; Firnberg et al. 2014). This abundance of mutagenesis data, the rich homology information, and its well-defined 3D structure make it a well-suited system for testing any computational model of protein mutational landscapes.
We will show that coevolutionary models for mutational landscapes do not only provide quantitative predictions of mutational effects but, more importantly, they are able to capture the context dependence of these effects. In this way, the new approach manages to clearly outperform state-of-the-art approaches such as SIFT (Ng and Henikoff 2003) and PolyPhen-2 (Adzhubei et al. 2010), which are based on independent-site models (even if, like in the case of PolyPhen-2, additional structural information is integrated into the prediction of mutational effects), which themselves outperform predictors based on structural stability. The approach is broadly applicable, as illustrated in a small set of completely different systems: An RNA recognition motif (Melamed et al. 2013), the glucosidase enzyme (Romero et al. 2015), and a PDZ domain (McLaughlin Jr et al. 2012). In the last system, positions most sensitive to mutation had been shown previously to fall into clusters of coevolving residues termed sectors (Halabi et al. 2009): Appling statistical inference we are able to get a more “quantitative” prediction of the impact of single point mutations in the domain. These findings illustrate the potential of coevolutionary landscape models in biomedical applications, through the in silico prediction of mutational effects related to not only antibiotic drug resistance but also the role of mutations in rare diseases and cancer.
Results
Evolutionary Modeling of Diverged Beta-Lactamase Sequences to Predict Mutational Effects of Single-Residue Mutations in TEM-1
The pipeline of our approach is illustrated in figure 1.
Fig. 1.

Pipeline of the mutational-landscape prediction: The homologous Pfam family containing the protein of interest (the Beta-lactamase2 family PF13354 in the case of TEM-1) is used to construct a global statistical model using the DCA. This model allows to score mutations by differences in the inferred genotype-to-phenotype mapping between the mutant and the wild-type amino acid sequence. This score, which is expected to incorporate (co-)evolutionary constraints acting across the entire family, is used as a predictor of the phenotypic effects of single (or few) amino acid substitutions in the protein of interest.
In technical terms, a mutational landscape is given as a genotype-to-phenotype mapping. To each possible amino acid sequence consisting of L amino acids or gaps (L denotes the alignment width), a quantitative phenotype is assigned. The phenotypic effect of a mutation substituting the wild-type amino acid ai at position i with amino acid b is measured by the difference score
| (1) |
between the mutant and the wild-type sequence. This function has, however, parameters, an astronomic number being far beyond any possibility of inference from data. Simplified parameterizations of reducing the number of parameters are needed. In general, a simple model can be inferred more robustly from limited data, but it risks to miss important effects. Even if these might be captured in more complex models, these latter risk to suffer from undersampling and thus overfitting effects. One of our aims is to find a good compromise between these two limitations.
The simplest nontrivial parameterization assumes position-specific but independent contributions of each residue,
| (2) |
The contribution measuring the contribution of amino acid ai in position i can be easily estimated from a multiple-sequence alignment (MSA) of homologous proteins using the framework of profile models (also called position-specific weight matrices) (cf. Materials and Methods for details). Possibly existing epistatic effects are neglected. Within this modeling scheme, the score for a single amino acid substitution simplifies from equation (1) to . It becomes immediately evident that the independent-residue model is unable to capture the context dependence of mutations, the substitution is predicted to have identical effects if introduced into different sequence backgrounds. The score of a double mutation is simply given by the sum of the -values of the two single-residue mutations.
The relation between statistically derived scores and the experimental MIC values may be nonlinear. The discrete nature of the latter introduces saturation effects, in particular for strongly deleterious mutations with MIC values below the lowest measured antibiotic concentration. To address these issues, we have designed a robust mapping of to predicted MIC values (cf. Materials and Methods) and compared them with the experimental MIC values by linear correlation. A direct measurement of Spearman rank correlations between and μexp leads to numerically very similar, but slightly less robust results.
The MIC predictions using the independent-residue model show a Pearson correlation of R = 0.63 with the experimental MIC measurements of single-residue substitutions in TEM-1. About of the variability of the experimental results is thus explainable by an independent-site model built on the sequence variability between homologous sequences. Very similar correlations () are found when comparing experimental results and the probabilities of being tolerated as predicted by SIFT, which, like most state-of-the-art methods, is based on conservation profiles in sequence alignments. Higher accuracy is found for PolyPhen-2 (): Its improved performance results from the integration of a profile-based score with structural features and amino acid properties.
However, all these predictions are based on the assumption that epistasis between mutations and context dependence can be neglected. The simplest model to challenge this assumption takes into account “pairwise epistatic interactions” between different residue positions in the MSA,
| (3) |
(cf. Materials and Methods). The terms parameterize the epistatic couplings between amino acids ai and aj in aligned positions i and j; if they would be set to zero the model would reduce to the independent-site model . This model has been recently introduced within the DCA of residue coevolution with the aim to infer contacts between residues from sequence information alone, and to enable the prediction of tertiary and quaternary protein structures (cf. the references in the “Introduction” of this article).
Estimating parameters from aligned sequences is a computationally hard task, but over the last years a number of accurate and computationally efficient approximate algorithms have been developed (Weigt et al. 2009; Morcos et al. 2011; Ekeberg et al. 2013; Baldassi et al. 2014). Here, we extend the mean-field scheme of Morcos et al. (2011) (cf. Materials and Methods). For TEM-1, standard DCA accurately predicts tertiary contacts (cf. supplementary fig. S1, Supplementary Material online): More than 60 nontrivial residue–residue contacts (minimum separation of five residues along the sequence) are predicted without error, and more than 200 at a precision of 80%.
Having estimated from the MSA, we can follow the same strategy as in the independent-residue case. First, a mutational score is introduced as the difference of the -values of the mutated and the wild-type sequences (cf. eq. 1). The inclusion of epistatic couplings leads to an “explicit context dependence” of the statistical score of a mutation in position i on all other residues in the wild-type sequences,
| (4) |
In a second step, this difference score is mapped to predicted MIC values and compared with the experimental values by linear correlation.
Resulting predictions outperform the independent-residue modeling. DCA-predicted MIC values show a correlation of R = 0.74 with the experimental MIC measurements of single-residue substitutions in TEM-1, that is, about of the variability of the experimental results is explained by the DCA-inferred mutational landscape, see figure 3, as compared with the 39% reported before for the independent-residue model (IND) model. We find that DCA even outperforms the integrative modeling of PolyPhen-2 combining sequence profiles with structural and other prior biological knowledge, demonstrating the power of DCA in capturing epistatic effects in the TEM-1 mutational landscape.
Fig. 3.
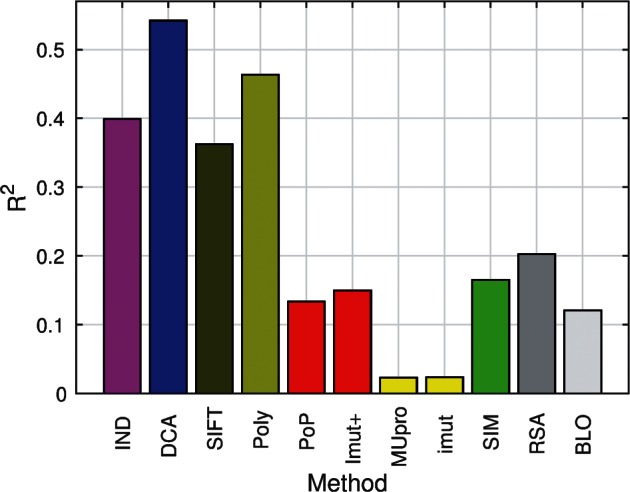
R2 between experimental fitness and predicted fitness for the following features: Independent-residue model (IND), DCA, SIFT (SIFT), Polyphen-2 (Poly), PoPMuSiC (PoP), I-Mutant2.0(sequence+structure) (Imut+), MUpro (MUpro), I-Mutant2.0 (Imut), molecular simulations (SIM), relative solvent accessibility (RSA), and Blosum62 substitution matrix (BLO).
Applying the same procedure to the data of Firnberg et al. (2014), which are highly correlated with the data from Jacquier et al. (2013) (R = 0.94), but slightly more precise than that, the correlation is slightly higher (). Excluding from the analysis those data which display large discrepancies between the two experiments (such discrepancies could be either due to experimental errors or due to antibiotic-specific effects) correlations between our computational score and both data sets rise above (cf. supplementary fig. S2, Supplementary Material online).
We conclude that sequence variability in the Pfam sequence alignments of distant homologs is highly informative about the local mutational landscape of TEM-1, despite the low typical sequence identity of only about 20% between the homologs and TEM-1. Moreover, accounting for context dependence has a crucial impact on the accuracy of an evolution-based approach, and that global inference methods such as DCA can efficiently capture such dependencies.
Assessing the Context Dependence of Mutational Effects
To quantify more precisely the range of context dependence, we apply DCA to reduced MSA. These MSAs contain the residue position carrying the mutation of interest, and all residues, which are, in a representative TEM-1 crystal structure (PDB: 1M40; Minasov et al. 2002), within a distance dmax (we use the minimal distance between heavy atoms as the interresidue distance). When using a very small Å, the mutated residue is considered on its own, when dmax is chosen to be larger than the maximum distance 46.9 Å existing within the PDB structure, we are back to the full DCA modeling of the previous section. Intermediate dmax interpolate between the two extreme cases. Doing so, we run DCA on subalignments of residues, which are not necessarily consecutive in the primary sequence but connected in the native fold (cf. the illustration of the procedure in fig. 2A). Figure 2B shows the resulting correlations between MIC data and statistical predictions, in function of the cutoff distance dmax. We observe a rapid increase in predictive power when a structural neighborhood is taken into account, but the increase in correlation extends well beyond the directly contacting residues (Å). The maximum correlation () is reached around Å, followed by a shallow decrease when including also more distant residues. This small decrease results probably from overfitting effects, as the number of model parameters grows quadratically in sequence length. The inset of figure 2B shows the average fraction of residues included into the sub-MSA. At 20 Å it is slightly higher than 50%, that is, the informative context of a mutation is given by more than half of the total number of residues in the protein.
Fig. 2.

Context dependence of mutational effects: (A) Procedure of including all residues within a maximal native distance dmax into the prediction of the mutational effects of the residue of interest (labeled i in the figure). This leads to residue-specific subalignments, which consist of columns, which are not necessarily consecutive, but connected in 3D. The results are given in (B). The main figure shows the correlation R2 between MIC data and our predictions, as a function of the cutoff distance dmax. The inset shows the average fraction of residues included into the reduced MSAs, again in dependence of dmax.
It is interesting to observe that the IND model makes more predictions with very large deviations from the experimental data than the DCA model: There is an increased number of mutations, which are either predicted to be strongly deleterious even if they are close to neutral, or vice versa. Many of these strong errors are at least partially corrected by the DCA landscape model (cf. supplementary tables S1–S3, Supplementary Material online). By the definition of the independent model in terms of frequency counts in individual MSA sequences (cf. Materials and Methods), a mutation with a low predicted IND score leads from a more frequent to a rare amino acid in the concerned MSA column. However, in the mutagenesis experiments some of these mutations are found to be admissible in the specific sequence context of TEM-1, that is, they are actually found to be close to neutral, examples being G52A, E61V, T112M, N152Y, A183V, T186P, D207V, D250Y (all target amino acids are present in few tens of sequences in the MSA out of the about 2,500 functional homologous sequences). For all of these cases, DCA is able to correct at least partially the statistical prediction. On the contrary, the independent-site model predicts that any mutation between two amino acids of similar frequency in the corresponding MSA column is close to neutral. Looking to the experimental MIC, substitutions D177N, A235D, I243N, and G248E all predicted to be close to neutral have strongly deleterious effects (). DCA corrects the mispredictions by at least two, on average by three MIC classes.
There is a small set of nine mutations badly predicted by DCA. In none of these cases, the independent modeling significantly ameliorates predictions. Interestingly, six of these nine mutations fall into the highly gapped part of the MSA: DCA displays a significant loss of predictive power in the highly gapped positions of the MSA, and correlation between predicted and experimental MIC increases above when disregarding mutations in this region (see supplementary fig. S3, Supplementary Material online).
Structural-Stability Predictions Show Lower Correlations to MIC Changes than Sequence-Based Modeling
It has been proposed before that the role of most residues is to make the protein properly fold, and that mutations on these sites mainly alter protein stability and not its activity (Wylie and Shakhnovich 2011): Hence, an accurate estimation of the change in protein stability should be able to account for a large fraction of mutational effects.
Many bioinformatic programs have been developed for estimating protein stability change upon mutation: Among them MUpro (Cheng et al. 2006) and I-Mutant2.0 (Capriotti et al. 2005), which take the sole sequence as input, PoPMuSiC (Dehouck et al. 2011) and I-Mutant2.0(sequence+structure) (Capriotti et al. 2005), which consider both sequence and structure. As these methods show incoherent predictions in between each other (cf. supplementary fig. S4, Supplementary Material online), we complement them by extensive force-field molecular simulations at all-atom resolution to estimate protein stability changes induced by single point mutations (cf. Materials and Methods for details). A score can be assigned to any substitution of amino acid ai in position i by amino acid b,
| (5) |
and then mapped to predicted MIC values using the before-mentioned scheme. Pearson correlations between predicted and experimental MIC are calculated: We find that, although those methods which consider not only sequence but also structural information ( for PoPMuSiC and I-Mutant2.0 (sequence+structure)) largely outperform those who do not ( for MUpro and I-Mutant), one gets only a modest further improvement letting the mutated polypeptide relax through molecular simulations ( for molecular simulations, see fig. 3).
It is well known that residues buried in the protein core are important determinants of protein stability. Mutation affecting these sites tends to be highly destabilizing (Ponder and Richards 1987; Bustamante et al. 2000; Franzosa and Xia 2009; Abriata et al. 2015). Therefore, we test also to what extent solvent accessibility explains the experimental mutation effects. Upon defining
| (6) |
where αi is the relative solvent accessible surface area (RSA) of residue ai in position i. We use Michel Sanner’s Molecular Surface algorithm (Sanner et al. 1996) applied to the PDB structure 1M40 to estimate surface accessible surface areas (SAS), normalized by the maximum accessibilities given in Tien et al. (2013). We find that of the variability of the experimental fitness is explainable through RSA. In general, we find that different accessibility estimates provide very similar results, including the absolute SAS (cf. supplementary material, Supplementary Material online). Indeed, a simple binary classifier roughly distinguishing buried from exposed residues is almost as informative as RSA and SAS values (supplementary fig. S5, Supplementary Material online). Note that the score does not depend on the target amino acid b, but only on the wild-type structure. Note also that this R2 value, while been greater than those achieved through molecular simulations, is substantially smaller than all statistical sequence scores derived from homologs.
The failure of stability-based predictions of mutational effects may result from strong-effect mutations in or close to the active site, whose phenotypic effect is unrelated to protein stability. To assess this effect, we have repeated our analysis including only 111 mutations falling into the extended active site (cf. the supplementary fig. S6, Supplementary Material online, for details). The R2 values for both statistical models (IND and DCA) go up strongly (), whereas the structure-based predictors show little or no gain at all. This demonstrates that evolutionary information accurately predicts the effects of mutation falling into the active site, and structural information does not.
Being grounded on complementary sources of information, predictions by evolution- and structure-based methods are not strongly correlated, as shown in supplementary figure S4, Supplementary Material online. A linear combination of DCA with structural predictors, however, yields only little increase in correlation: The explained variance of experimental data gets to when performing a bivariate linear regression between DCA scores and either solvent accessibility or Polyphen-2 predictions, as displayed in supplementary figure S7, Supplementary Material online.
DCA Landscape Modeling Spots Stabilizing Mutations and Captures Protein-Specific Substitution Scores
The TEM-1 beta-lactamase has been the subject of intense studies with regard to protein structure, function, and evolution, and a number of structurally stabilizing substitutions have been identified (Raquet et al. 1995; Wang et al. 2002; Kather et al. 2008; Deng et al. 2012): P62S, V80I, G92D, R120G, E147G, H153R, M182T (strongly stabilizing), L201P, I208M, A184V, A224V, I247V, T265M, R275L/Q, and N276D (positions are indicated using standard Ambler numbering; Ambler et al. 1991). Some of them were found to influence the resistance phenotype (Salverda et al. 2010). Notably, the five highest DCA scores out of all considered mutants belong to this set: M182T, H153R, E147G, L201P, and G92D (with a large gap separating the likelihood of the strongly stabilizing M182T from the scores of the other four, cf. fig. 4). More quantitatively, we found that the Gibbs Free Energy change relative to wild-type of a different, small set of mutations (most of which not affecting Amoxicillin resistance) characterized by four independent studies (Raquet et al. 1995; Wang et al. 2002; Kather et al. 2008; Deng et al. 2012) is highly correlated with DCA scores (RDCA = 0.81) but less correlated when using independent model (RIND = 0.62).
Fig. 4.

Statistical scores and thermodynamic stabilities. (A) Scatter plot of the log odd ratio versus the experimental fitness μexp, stabilizing mutations mentioned in the text are highlighted in red. The highest scoring mutations are M182T, G92D, H153R, L201P and E147G, all reported as stabilizing. (B) for a smaller set of single mutations is now plotted versus the change in Gibbs Free Energy relative to wild type , as measured by four independent studies (Ref1, Ref2, Ref3 and Ref4 are Kather et al. 2008, Raquet et al. 1995, Wang et al. 2002, and Deng et al. 2012, respectively).
We further investigate whether the statistical analysis of homologous sequences is able to capture “protein-specific amino acid substitution effects,” that is, if the effect of a specific amino acid substitution (averaged over all sequence positions where this mutation appears) is better described by our statistical model than it would be by Blosum matrices, which are estimated from many distinct aligned protein sequences. To this aim, a matrix of average substitution scores is built from the set of experimental MIC values (cf. fig. 5). We also construct an analogous matrix for the DCA-predicted MIC values of the same set of mutations, and quantify correlations between predicted and experimental average effects computing a Pearson correlation weighting each term with the square root of the number of measured mutations falling in the related class. We find a very large correlation () between average experimental and predicted substitution matrices. This value has to be compared with the substantially lower correlation found when comparing the mutational effects in TEM-1 with the Blosum62 matrix (), which provides amino acid substitution scores averaged over many proteins. All other inference methods show substitution scores with correlations to MIC, which are comparable to or lower than the correlations between MIC and Blosum62.
Fig. 5.

Protein-specific amino acid substitution effects in TEM-1: Amino acid substitution effects, averaged over experimental measurements (A), DCA predictions (B), and extracted from BLOSUM62 (C). Blue squares correspond to nearly neutral mutations (log MIC > 5.3), whereas yellow squares correspond to highly deleterious mutations (log MIC < 2.6). White squares are used for unobserved substitutions. The histogram in (D) shows R2 between averaged computational and experimental amino acid substitution effects.
Discussion
The central aim of this article is the accurate computational inference of protein mutational landscapes to predict the phenotypic effect of mutations. This is exemplified in the case of the TEM-1 protein of Escherichia coli, a beta-lactamase providing antibiotic drug resistance against beta-lactams, such as penicillin, amoxicillin or ampicillin.
To reach this aim, we have extracted information about a protein and its potential mutants, which is hidden in the sequence variability of “diverged but functional” homologs of this protein. The central ingredient of our analysis is a careful modeling of residue coevolution by DCA, that is, the modeling includes pairwise epistasis between residues. This approach, initially developed in the context of structural biology to predict residue–residue contacts from sequences, has been used to define a score for each mutation, which was found to explain 55%, respectively, 58% of the phenotypic variability in the two corresponding experimental TEM-1 data sets (Jacquier et al. 2013; Firnberg et al. 2014). This value is substantially higher than what can be obtained by a more standard modeling approach based on sequence profiles (39% of variability explained), which does not include epistasis, or on changes in structural stability. Furthermore, our coevolutionary approach clearly outperforms state-of-the-art approaches such as SIFT and PolyPhen-2, which are based on nonepistatic models.
However, epistatic effects are not equally important for all residues, which may explain that some authors disagree on the contribution of the sequence context to mutational effect (Pollock et al. 2012; Ashenberg et al. 2013; Zou and Zhang 2015). The relevant context determining the effect of a mutation of a residue is not only given by its direct physical neighbors, but extends to a distance of about 20 Å. The informative context thus includes, on average, roughly half of all residues in the aligned TEM-1 sequence. This result agrees with the finding that interactions from second shell and beyond might be important for protein function (Drawz et al. 2009). Having a look to the physicochemical properties of the wild-type and the mutant amino acids, we observe, for example, that mutations substituting a hydrophobic residue with a hydrophilic one are almost equally well described by the DCA and by the independent model (), due to the structurally highly disruptive effect of a hydrophilic residue in a buried site, and thus the absence of hydrophilic residues in the corresponding column of the sequence alignment. On the contrary, the more moderate effect of replacing a small by a large amino acid depends strongly whether the context is able to accommodate this change or not, and thus the independent model performs much worse than the DCA model (). Concentrating on mutations from amino acids of given physicochemical characteristics (hydrophobicity, charge, volume) toward a target amino acid of either different (e.g., hydrophobic to hydrophilic) or conserved characteristics (e.g., hydrophobic to hydrophobic) we find that the DCA predictions are stable, with R2 values between 49% and 64%, whereas the ones of the IND model vary much more strongly (25–55%). In none of the considered cases, the independent model was able to outperform the coevolutionary one.
Our findings demonstrate that the “local mutational landscape” dictating the mutational effects in TEM-1 is closely related to the (co-)evolutionary pressures acting globally across the entire homologous protein family. This result is quite remarkable: Despite a low typical sequence identity of about 20% between homologous beta-lactamases and TEM-1, their sequence statistics provides quantitative information about the effect of single-residue substitutions in TEM-1. We are thus able to infer landscapes and predict quantitatively mutational effects even in cases, where mutagenesis data are not sufficiently numerous (cf. Otwinowski and Plotkin 2014). This complements recent findings, that patterns of polymorphism and covariation in patient derived (and thus highly similar) HIV sequences are informative about their replicative capacities (Shekhar et al. 2013; Mann et al. 2014), thanks to high mutation rates in the HIV virus. Furthermore, coevolutionary patterns in protein families were recently found to be closely related to protein energetics and folding landscapes (Lui and Tiana 2013; Morcos et al. 2014).
We expect that the modeling approach through DCA can be improved along several lines. First, prediction accuracy depends critically on the quality and size of the training MSA. As we have shown, the prediction for gapped (and typically less well-aligned) positions is substantially worse than the one for ungapped (thus better alignable) ones (R2 values ranging from 30% to 78% from the most to the least gapped positions). We therefore excluded gapped sequences from the training alignment, but this procedure reduces the sequence number and thus the statistics for the ungapped positions.
Second, the current DCA approach is purely statistical and based on evolutionary information. It does not take into account any complementary knowledge about the protein under study. We have, however, observed that the integration of structural knowledge helps to increase the prediction accuracy. Fitting the model only for residues within about 20 Å from the mutated residue, the R2 value raises slightly by about 2%. The effect of integrating the DCA-score and the solvent-accessible surface area is even larger, leading to a gain in R2 of more than 6%. A very similar increase (7%) is obtained when combining DCA with PolyPhen-2, the latter being built upon a profile model and structural information. These increases are based on a simple linear regression scheme with 3-fold crossvalidation: It will be interesting to explore more sophisticated approaches, for example, integrating prior structural knowledge through a Bayesian inference scheme directly into the statistical-inference procedure.
Even if the integration of complementary information may substantially improve our prediction accuracy, the most important contribution is, however, coming from the careful inclusion of epistatic effects into our modeling approach to mutational landscapes, as shown by a partial-correlation analysis in supplementary figure S8, Supplementary Material online.
From a computational point of view, the approach is widely applicable beyond the specific case of TEM-1 and antibiotic drug resistance. To check this practically, we have analyzed further systems in the supplementary material, Supplementary Material online: A PDZ domain (McLaughlin Jr et al. 2012), an RNA recognition motif (Melamed et al. 2013), and the glucosidase enzyme (Romero et al. 2015) (cf. supplementary text S1 and figs. S9–S11, Supplementary Material online). DCA predictions systematically outperform independent-site models neglecting epistasis and all other tested methods. Only PolyPhen-2 reaches, in two cases out of four, comparable performance. Despite this encouraging finding, correlations between experiment and computation are numerically smaller than those observed for TEM-1. We expect this reduction to result from discrepancies between the measured phenotypes (e.g., protein stability, binding affinity) and those under evolutionary selection (fitness); MIC is without doubt a better proxy for fitness than most molecular phenotypes. However, to systematically support this idea, large-scale experiments assessing the impact of mutations on multiple phenotypic traits in the same protein would be necessary. In summary, despite not representing a comprehensive survey, currently available data suggest a large potential for coevolutionary models in biomedical applications, through the in silico prediction of the role of mutations in rare diseases and cancer.
Materials and Methods
Data
Mutational Data
The original data set (Jacquier et al. 2013) was used directly at the translated amino acid level. It contains 8,621 (4,094 distinct) measurements of amoxicillin MIC. Among these 8,112 do not include stop codons, 2,440 are repeated measures of the wild-type sequence, 3,129 (Nmultiple = 2,051 distinct) have all mutations inside the part of the sequence covered by the Pfam domain (i.e., subject to the presented statistical analysis). Finally, among the latter set, there are Nsingle = 742 distinct single mutation. Each measurement zi falls in nine discrete classes: , 2,000, 4,000 (mg/l) (no single point mutation has z > 1,000). For a given phenotype where amino acid ai in position i is replaced with amino acid b, we have defined a unique experimental fitness taking the logarithmic average on all measurements (whenever multiple measurements were available):
| (7) |
where is the number of measurements of mutation .
Homologous Sequences and Preprocessing of the Training Set
The genomic model was learned from an MSA of sequences belonging to the Pfam Beta-lactamase2 family (PF13354) (Finn et al. 2013). We have used HMMer (Mistry et al. 2013) to search against the Uniprot protein sequence database (version updated to March 2015). The resulting MSA is L = 197 sites long, and contains 5,119 distinct sequences. After removing all sequences with more than five gaps, 2,462 sequences are retained and used for the statistical analysis. They have an average sequence identity approximately with the TEM-1 wild-type sequence.
Statistical Sequence Modeling
Independent Model—Sequence Profile
The basic assumption of the independent model (2) is the additivity of the mutational effects of different positions in the amino acid sequence. In terms of statistical sequence models, this corresponds to a “sequence profile model,” which assigns to each sequence the factorized probability
| (8) |
with being the frequency of amino acid a in column i of the MSA, see below for a precise definition of this frequency. The factorized form of this expression suggests to use log-probabilities as a computational predictor of the genotype-to-phenotype mapping,
| (9) |
This leads to an explicit expression of the phenotypic contribution of amino acid a in site i: .
Epistatic Model—DCA
Following last paragraph’s idea to identify the computational predictor of the genotype-to-phenotype mapping with the log-probability of a statistical model inferred from an MSA of TEM-1 homologs, the latter takes the form
| (10) |
where
| (11) |
is given in equation (3), and the so-called partition function is a normalization factor. The statistical model PDCA thus takes the form of a generalized Potts model or, equivalently, a pairwise Markov random field. The same model was introduced in the DCA of residue coevolution (Weigt et al. 2009; Morcos et al. 2011). Inferring model parameters from the MSA is a computationally hard task, we therefore follow the mean-field approximation introduced in Morcos et al. (2011). In this context, the epistatic couplings can be determined by inversion of the empirical covariance matrix for the co-occurrence of amino acids a and b in positions i and j of the same protein sequence. Once the model parameters are determined, the context-dependent mutational effects can be estimated using equation (4).
Details of Statistical Inference
To take into account phylogenetic correlations and sampling biases in the training set, each sequence of the MSA appears in the statistics with the following weight,
| (12) |
with being the Manhattan distance (number of mismatches) between sequences m and and θ being the Heaviside step function whose value is 0 for negative argument and 1 for positive argument. The reweighting threshold is set to as usually done in DCA (Morcos et al. 2011).
Due to finite sampling, the statistics of the MSA has to be regularized introducing pseudocounts:
| (13) |
| (14) |
with and δ the Kronecker’s delta whose value is 1 if the variables are equal, and 0 otherwise. We have included pseudocounts at two levels: First, for the inference of epistatic couplings we have used large pseudocounts (), needed to correct for systematic biases introduced by the Mean Field (MF) approximation (Barton et al. 2014),
| (15) |
| (16) |
for all amino acids a and b. Following Tanaka (1998), also diagonal terms are included. Couplings with gaps are set to zero, (cf. Morcos et al. 2011).
Smaller pseudocounts of Bayesian size () have been used in the regularization of single site frequencies to infer the fields:
| (17) |
The same small regularization has been adopted in the independent-site model.
Mapping Scores to MIC Values
To compare computational predictions with experimental MIC values, we map computational scores into predicted MIC , by first sorting them and then associating with the nth highest score the nth highest experimental MIC value ,
| (18) |
We subsequently compute linear correlations between the predicted MIC and the experimental one μexp, resulting in nonlinear rank correlations between experimental fitnesses and raw computational scores .
This procedure has proved to be more robust than the standard Spearman rank correlations, because of the peculiar distribution of experimental data (bimodal with many repeated measures), and helpful to reduce the statistical weight of outliers (such as strongly destabilizing mutations in the distribution of predicted by molecular simulations). However, numerical values of Spearman correlations are in general not very different from those obtained by our procedure.
Structural Stability Predictions
Bioinformatic Predictors
A list of predicted of E. coli TEM-1 protein point mutations for the web-based programs mentioned in the article have been downloaded from the SPROUTS database (Lonquety et al. 2009).
Force-Field-Based Molecular Simulations
Computation of protein thermodynamic stability is computationally very demanding: A direct calculation of thermodynamic stability by molecular dynamics simulations implies the sampling of complete folding and unfolding events. This is presently infeasible for proteins of the size of TEM-1 (286 amino acids). An alternative, less expensive approach to estimate mutational effects on protein stability is to look for locally stable configuration performing small structural relaxations from a reference structure, with the wild-type amino acid replaced by the mutant amino acid. Assuming that the protein can be described by a two-state system (folded vs. unfolded), and that both the entropy of the folded and the free energy of the unfolded are not sensibly affected by the mutation, we can approximate
| (19) |
Moreover, as thermodynamic stability is an equilibrium property, one can replace expensive molecular dynamics simulations with more efficient Monte-Carlo sampling.
Molecular simulations were performed using SIMONA (Strunk et al. 2012), a Monte-Carlo-based simulation software for efficient molecular simulations which have proved useful to obtain reproducible folding in a series of test cases (Schug et al. 2003; Verma et al. 2006). As reference structure for molecular relaxations we have taken a highly resolved (0.8 Å) structure (PDB: 1M40; Minasov et al. 2002). Further details of the simulations are reported in next section.
Details and Calibration of the Molecular Simulations
To estimate the thermodynamic stability of TEM-1 mutants, we have executed the following steps:
Starting from a sufficiently close reference state (in our case the SIMONA-relaxed structure of the wild-type molecule), the wild-type amino acid is replaced by the mutant one.
Monte-Carlo simulations are performed under SIMONA to locally minimize the energy function.
The resulting energy change is determined.
In the simulation, we have included the complete forcefield PFF03v4-all parallel OpenMP (scale 1.0), which makes use the amber99sb-star-ildn dihedral potential with an implicit solvent model. It contains the following contributions:
| (20) |
where rij represents the distance between atoms i and j, and g(i) the type of amino acid i, Vij and Rij are Lennard–Jones parameters, qi and are the partial charges and group-specific dielectric constants for nontrivial electrostatic interactions, σi and Ai are the free energy per unit area and the area of atom i in contact with fictitious solvent, respectively, and finally Vhb is a short range interaction term for backbone–backbone hydrogen bonding (Schug et al. 2003).
Supplementary Material
Supplementary tables S1–S3, figures S1–S13, text S1, and a Matlab implementation of DCA modeling and sequence scoring are available at Molecular Biology and Evolution online (http://www.mbe.oxfordjournals.org/).
Acknowledgments
The authors are grateful to Jacques Chomilier for help with the SPROUTS database. M.W. was partly funded by the Agence Nationale de la Recherche project COEVSTAT (ANR-13-BS04-0012-01). This work undertaken partially in the framework of CALSIMLAB is supported by the public grant ANR-11-LABX-0037-01 overseen by the French National Research Agency (ANR) as part of the “Investissements d’Avenir” program (ANR-11-IDEX-0004-02) O.T. and H.J. were supported by the European Research Council under the European Union's Seventh Framework Program (FP7/2007-2013)/ERC Grant 310944.
Note Added in Proof
The Marks lab has performed a related analysis with comparable conclusions on the role of epistatic couplings in predicting mutational effects, a preprint is available on arXiv:1510.04612.
References
- Abriata LA, Palzkill T, Dal Peraro M. 2015. How structural and physicochemical determinants shape sequence constraints in a functional enzyme. PLoS One 10(2):e0118684 [DOI] [PMC free article] [PubMed] [Google Scholar]
- Adzhubei IA, Schmidt S, Peshkin L, Ramensky VE, Gerasimova A, Bork P, Kondrashov AS, Sunyaev SR. 2010. A method and server for predicting damaging missense mutations. Nat Methods. 7(4):248–249. [DOI] [PMC free article] [PubMed] [Google Scholar]
- Ambler R, Coulson A, Frère J-M, Ghuysen J-M, Joris B, Forsman M, Levesque R, Tiraby G, Waley S. 1991. A standard numbering scheme for the class a beta-lactamases. Biochem J. 276(Pt 1):269. [DOI] [PMC free article] [PubMed] [Google Scholar]
- Ashenberg O, Gong LI, Bloom JD. 2013. Mutational effects on stability are largely conserved during protein evolution. Proc Natl Acad Sci U S A. 110(52):21071–21076. [DOI] [PMC free article] [PubMed] [Google Scholar]
- Baldassi C, Zamparo M, Feinauer C, Procaccini A, Zecchina R, Weigt M, Pagnani A. 2014. Fast and accurate multivariate Gaussian modeling of protein families: predicting residue contacts and protein-interaction partners. PLoS One 9(3):e92721. [DOI] [PMC free article] [PubMed] [Google Scholar]
- Barton J, Cocco S, De Leonardis E, Monasson R. 2014. Large pseudocounts and l 2-norm penalties are necessary for the mean-field inference of Ising and Potts models. Phys Rev E. 90(1):012132. [DOI] [PubMed] [Google Scholar]
- Bloom JD, Glassman MJ. 2009. Inferring stabilizing mutations from protein phylogenies: application to influenza hemagglutinin. PLoS Comput Biol. 5:e1000349. [DOI] [PMC free article] [PubMed] [Google Scholar]
- Bloom JD, Silberg JJ, Wilke CO, Drummond DA, Adami C, Arnold FH. 2005. Thermodynamic prediction of protein neutrality. Proc Natl Acad Sci U S A. 102(3):606–611. [DOI] [PMC free article] [PubMed] [Google Scholar]
- Breen MS, Kemena C, Vlasov PK, Notredame C, Kondrashov FA. 2012. Epistasis as the primary factor in molecular evolution. Nature 490(7421):535–538. [DOI] [PubMed] [Google Scholar]
- Bustamante CD, Townsend JP, Hartl DL. 2000. Solvent accessibility and purifying selection within proteins of Escherichia coli and Salmonella enterica. Mol Biol Evol. 17(2):301–308. [DOI] [PubMed] [Google Scholar]
- Capra JA, Singh M. 2007. Predicting functionally important residues from sequence conservation. Bioinformatics 23(15):1875–1882. [DOI] [PubMed] [Google Scholar]
- Capriotti E, Fariselli P, Casadio R. 2005. I-mutant2. 0: predicting stability changes upon mutation from the protein sequence or structure. Nucleic Acids Res. 33(Suppl 2):W306–W310. [DOI] [PMC free article] [PubMed] [Google Scholar]
- Cheng J, Randall A, Baldi P. 2006. Prediction of protein stability changes for single-site mutations using support vector machines. Proteins 62(4):1125–1132. [DOI] [PubMed] [Google Scholar]
- Cheng RR, Morcos F, Levine H, Onuchic JN. 2014. Toward rationally redesigning bacterial two-component signaling systems using coevolutionary information. Proc Natl Acad Sci U S A. 111(5):E563–E571. [DOI] [PMC free article] [PubMed] [Google Scholar]
- Chou H-H, Chiu H-C, Delaney NF, Segrè D, Marx CJ. 2011. Diminishing returns epistasis among beneficial mutations decelerates adaptation. Science 332(6034):1190–1192. [DOI] [PMC free article] [PubMed] [Google Scholar]
- Cirulli ET, Goldstein DB. 2010. Uncovering the roles of rare variants in common disease through whole-genome sequencing. Nat Rev Genet. 11(6):415–425. [DOI] [PubMed] [Google Scholar]
- Dago AE, Schug A, Procaccini A, Hoch JA, Weigt M, Szurmant H. 2012. Structural basis of histidine kinase autophosphorylation deduced by integrating genomics, molecular dynamics, and mutagenesis. Proc Natl Acad Sci U S A. 109(26):E1733–E1742. [DOI] [PMC free article] [PubMed] [Google Scholar]
- Davison HC, Woolhouse ME, Low JC. 2000. What is antibiotic resistance and how can we measure it? Trends Microbiol . 8(12):554–559. [DOI] [PubMed] [Google Scholar]
- de Juan D, Pazos F, Valencia A. 2013. Emerging methods in protein co-evolution. Nat Rev Genet. 14(4):249–261. [DOI] [PubMed] [Google Scholar]
- de Visser JAG, Krug J. 2014. Empirical fitness landscapes and the predictability of evolution. Nat Rev Genet. 15(7):480–490. [DOI] [PubMed] [Google Scholar]
- Dehouck Y, Kwasigroch JM, Gilis D, Rooman M. 2011. Popmusic 2.1: a web server for the estimation of protein stability changes upon mutation and sequence optimality. BMC Bioinformatics 12(1):151. [DOI] [PMC free article] [PubMed] [Google Scholar]
- Deng Z, Huang W, Bakkalbasi E, Brown NG, Adamski CJ, Rice K, Muzny D, Gibbs RA, Palzkill T. 2012. Deep sequencing of systematic combinatorial libraries reveals β-lactamase sequence constraints at high resolution. J Mol Biol. 424(3):150–167. [DOI] [PMC free article] [PubMed] [Google Scholar]
- Drawz SM, Bethel CR, Hujer KM, Hurless KN, Distler AM, Caselli E, Prati F, Bonomo RA. 2009. The role of a second-shell residue in modifying substrate and inhibitor interactions in the shv β-lactamase: a study of ambler position asn276. Biochemistry 48(21):4557–4566. [DOI] [PMC free article] [PubMed] [Google Scholar]
- Echave J, Jackson EL, Wilke CO. 2015. Relationship between protein thermodynamic constraints and variation of evolutionary rates among sites. Phys Biol. 12(2):025002. [DOI] [PMC free article] [PubMed] [Google Scholar]
- Ekeberg M, Lövkvist C, Lan Y, Weigt M, Aurell E. 2013. Improved contact prediction in proteins: using pseudolikelihoods to infer Potts models. Phys Rev E. 87(1):012707. [DOI] [PubMed] [Google Scholar]
- Ferguson AL, Mann JK, Omarjee S, Ndung’u T, Walker BD, Chakraborty AK. 2013. Translating HIV sequences into quantitative fitness landscapes predicts viral vulnerabilities for rational immunogen design. Immunity 38(3):606–617. [DOI] [PMC free article] [PubMed] [Google Scholar]
- Finn RD, Bateman A, Clements J, Coggill P, Eberhardt RY, Eddy SR, Heger A, Hetherington K, Holm L, Mistry J, et al. 2013. Pfam: the protein families database. Nucleic Acids Res. 42(D1):D222–D230. [DOI] [PMC free article] [PubMed] [Google Scholar]
- Firnberg E, Labonte JW, Gray JJ, Ostermeier M. 2014. A comprehensive, high-resolution map of a gene’s fitness landscape. Mol Biol Evol. 31(6):1581–1592. [DOI] [PMC free article] [PubMed] [Google Scholar]
- Franzosa EA, Xia Y. 2009. Structural determinants of protein evolution are context-sensitive at the residue level. Mol Biol Evol. 26(10):2387–2395. [DOI] [PubMed] [Google Scholar]
- Halabi N, Rivoire O, Leibler S, Ranganathan R. 2009. Protein sectors: evolutionary units of three-dimensional structure. Cell 138(4):774–786. [DOI] [PMC free article] [PubMed] [Google Scholar]
- Harms MJ, Thornton JW. 2013. Evolutionary biochemistry: revealing the historical and physical causes of protein properties. Nat Rev Genet. 14(8):559–571. [DOI] [PMC free article] [PubMed] [Google Scholar]
- Hopf TA, Colwell LJ, Sheridan R, Rost B, Sander C, Marks DS. 2012. Three-dimensional structures of membrane proteins from genomic sequencing. Cell 149(7):1607–1621. [DOI] [PMC free article] [PubMed] [Google Scholar]
- Hopf TA, Schärfe CPI, Rodrigues JPGLM, Green AG, Kohlbacher O, Sander C, Bonvin AMJJ, Marks DS. 2014. Sequence co-evolution gives 3d contacts and structures of protein complexes. eLife 3:e03430. [DOI] [PMC free article] [PubMed] [Google Scholar]
- Jacquier H, Birgy A, Le Nagard H, Mechulam Y, Schmitt E, Glodt J, Bercot B, Petit E, Poulain J, Barnaud G, et al. 2013. Capturing the mutational landscape of the beta-lactamase tem-1. Proc Natl Acad Sci U S A. 110(32):13067–13072. [DOI] [PMC free article] [PubMed] [Google Scholar]
- Kather I, Jakob RP, Dobbek H, Schmid FX. 2008. Increased folding stability of tem-1 beta-lactamase by in vitro selection. J Mol Biol. 383(1):238–251. [DOI] [PubMed] [Google Scholar]
- Kauffman S, Levin S. 1987. Towards a general theory of adaptive walks on rugged landscapes. J Theor Biol. 128(1):11–45. [DOI] [PubMed] [Google Scholar]
- Khan AI, Dinh DM, Schneider D, Lenski RE, Cooper TF. 2011. Negative epistasis between beneficial mutations in an evolving bacterial population. Science 332(6034):1193–1196. [DOI] [PubMed] [Google Scholar]
- Lonquety M, Lacroix Z, Papandreou N, Chomilier J. 2009. Sprouts: a database for the evaluation of protein stability upon point mutation. Nucleic Acids Res. 37Suppl 1):D374–D379. [DOI] [PMC free article] [PubMed] [Google Scholar]
- Lui S, Tiana G. 2013. The network of stabilizing contacts in proteins studied by coevolutionary data. J Chem Phys. 139(15):155103. [DOI] [PubMed] [Google Scholar]
- Mann JK, Barton JP, Ferguson AL, Omarjee S, Walker BD, Chakraborty A, Ndung’u T. 2014. The fitness landscape of hiv-1 gag: advanced modeling approaches and validation of model predictions by in vitro testing. PLoS Comput Biol. 10(8):e1003776. [DOI] [PMC free article] [PubMed] [Google Scholar]
- Marks DS, Hopf TA, Sander C. 2012. Protein structure prediction from sequence variation. Nat Biotechnol. 30(11):1072–1080. [DOI] [PMC free article] [PubMed] [Google Scholar]
- McLaughlin RN, Jr, Poelwijk FJ, Raman A, Gosal WS, Ranganathan R. 2012. The spatial architecture of protein function and adaptation. Nature 491(7422):138–142. [DOI] [PMC free article] [PubMed] [Google Scholar]
- Melamed D, Young DL, Gamble CE, Miller CR, Fields S. 2013. Deep mutational scanning of an rrm domain of the Saccharomyces cerevisiae poly (a)-binding protein. RNA 19(11):1537–1551. [DOI] [PMC free article] [PubMed] [Google Scholar]
- Minasov G, Wang X, Shoichet BK. 2002. An ultrahigh resolution structure of tem-1 β-lactamase suggests a role for glu166 as the general base in acylation. J Am Chem Soc. 124(19):5333–5340. [DOI] [PubMed] [Google Scholar]
- Mistry J, Finn RD, Eddy SR, Bateman A, Punta M. 2013. Challenges in homology search: Hmmer3 and convergent evolution of coiled-coil regions. Nucleic Acids Res. 41(12):e121. [DOI] [PMC free article] [PubMed] [Google Scholar]
- Morcos F, Pagnani A, Lunt B, Bertolino A, Marks DS, Sander C, Zecchina R, Onuchic JN, Hwa T, Weigt M. 2011. Direct-coupling analysis of residue coevolution captures native contacts across many protein families. Proc Natl Acad Sci U S A. 108(49):E1293–E1301. [DOI] [PMC free article] [PubMed] [Google Scholar]
- Morcos F, Schafer NP, Cheng RR, Onuchic JN, Wolynes PG. 2014. Coevolutionary information, protein folding landscapes, and the thermodynamics of natural selection. Proc Natl Acad Sci U S A. 111(34):12408–12413. [DOI] [PMC free article] [PubMed] [Google Scholar]
- Ng PC, Henikoff S. 2003. Sift: predicting amino acid changes that affect protein function. Nucleic Acids Res. 31(13):3812–3814. [DOI] [PMC free article] [PubMed] [Google Scholar]
- Ng PC, Henikoff S. 2006. Predicting the effects of amino acid substitutions on protein function. Annu Rev Genomics Hum Genet. 7:61–80. [DOI] [PubMed] [Google Scholar]
- Nugent T, Jones DT. 2012. Accurate de novo structure prediction of large transmembrane protein domains using fragment-assembly and correlated mutation analysis. Proc Natl Acad Sci U S A. 109(24):E1540–E1547. [DOI] [PMC free article] [PubMed] [Google Scholar]
- Otwinowski J, Plotkin JB. 2014. Inferring fitness landscapes by regression produces biased estimates of epistasis. Proc Natl Acad Sci U S A. 111(22):E2301–E2309. [DOI] [PMC free article] [PubMed] [Google Scholar]
- Ovchinnikov S, Kamisetty H, Baker D. 2014. Robust and accurate prediction of residue–residue interactions across protein interfaces using evolutionary information. eLife 3:e02030. [DOI] [PMC free article] [PubMed] [Google Scholar]
- Podgornaia AI, Laub MT. 2015. Pervasive degeneracy and epistasis in a protein-protein interface. Science 347(6222):673–677. [DOI] [PubMed] [Google Scholar]
- Poelwijk FJ, Kiviet DJ, Weinreich DM, Tans SJ. 2007. Empirical fitness landscapes reveal accessible evolutionary paths. Nature 445(7126):383–386. [DOI] [PubMed] [Google Scholar]
- Pollock DD, Thiltgen G, Goldstein RA. 2012. Amino acid coevolution induces an evolutionary stokes shift. Proc Natl Acad Sci U S A. 109(21):E1352–E1359. [DOI] [PMC free article] [PubMed] [Google Scholar]
- Ponder JW, Richards FM. 1987. Tertiary templates for proteins: use of packing criteria in the enumeration of allowed sequences for different structural classes. J Mol Biol. 193(4):775–791. [DOI] [PubMed] [Google Scholar]
- Procaccini A, Lunt B, Szurmant H, Hwa T, Weigt M. 2011. Dissecting the specificity of protein-protein interaction in bacterial two-component signaling: orphans and crosstalks. PLoS One 6(5):e19729. [DOI] [PMC free article] [PubMed] [Google Scholar]
- Raquet X, Vanhove M, Lamotte-Brasseur J, Goussard S, Courvalin P, Frère J-M. 1995. Stability of tem β-lactamase mutants hydrolyzing third generation cephalosporins. Proteins 23(1):63–72. [DOI] [PubMed] [Google Scholar]
- Reva B, Antipin Y, Sander C. 2011. Predicting the functional impact of protein mutations: application to cancer genomics. Nucleic Acids Res. 39(17):e118. [DOI] [PMC free article] [PubMed] [Google Scholar]
- Romero PA, Tran TM, Abate AR. 2015. Dissecting enzyme function with microfluidic-based deep mutational scanning. Proc Natl Acad Sci U S A. 112(23):7159–7164. [DOI] [PMC free article] [PubMed] [Google Scholar]
- Roscoe BP, Thayer KM, Zeldovich KB, Fushman D, Bolon DN. 2013. Analyses of the effects of all ubiquitin point mutants on yeast growth rate. J Mol Biol. 425(8):1363–1377. [DOI] [PMC free article] [PubMed] [Google Scholar]
- Salverda ML, De Visser J, Barlow M. 2010. Natural evolution of tem-1 β-lactamase: experimental reconstruction and clinical relevance. FEMS Microbiol Rev. 34(6):1015–1036. [DOI] [PubMed] [Google Scholar]
- Sanner MF, Olson AJ, Spehner J-C. 1996. Reduced surface: an efficient way to compute molecular surfaces. Biopolymers 38(3):305–320. [DOI] [PubMed] [Google Scholar]
- Schenk MF, Szendro IG, Salverda ML, Krug J, de Visser JAG. 2013. Patterns of epistasis between beneficial mutations in an antibiotic resistance gene. Mol Biol Evol. 30(8):1779–1787. [DOI] [PMC free article] [PubMed] [Google Scholar]
- Schug A, Herges T, Wenzel W. 2003. Reproducible protein folding with the stochastic tunneling method. Phys Rev Lett. 91(15):158102. [DOI] [PubMed] [Google Scholar]
- Schug A, Weigt M, Onuchic JN, Hwa T, Szurmant H. 2009. High-resolution protein complexes from integrating genomic information with molecular simulation. Proc Natl Acad Sci U S A. 106(52):22124–22129. [DOI] [PMC free article] [PubMed] [Google Scholar]
- Serohijos AW, Shakhnovich EI. 2014. Merging molecular mechanism and evolution: theory and computation at the interface of biophysics and evolutionary population genetics. Curr Opin Struct Biol. 26:84–91. [DOI] [PMC free article] [PubMed] [Google Scholar]
- Shekhar K, Ruberman CF, Ferguson AL, Barton JP, Kardar M, Chakraborty AK. 2013. Spin models inferred from patient-derived viral sequence data faithfully describe HIV fitness landscapes. Phys Rev E. 88(6):062705. [DOI] [PMC free article] [PubMed] [Google Scholar]
- Strunk T, Wolf M, Brieg M, Klenin K, Biewer A, Tristram F, Ernst M, Kleine P, Heilmann N, Kondov I, et al. 2012. Simona 1.0: an efficient and versatile framework for stochastic simulations of molecular and nanoscale systems. J Comput Chem. 33(32):2602–2613. [DOI] [PubMed] [Google Scholar]
- Sułkowska JI, Morcos F, Weigt M, Hwa T, Onuchic JN. 2012. Genomics-aided structure prediction. Proc Natl Acad Sci U S A. 109(26):10340–10345. [DOI] [PMC free article] [PubMed] [Google Scholar]
- Tanaka T. 1998. Mean-field theory of Boltzmann machine learning. Phys Rev E. 58(2):2302. [Google Scholar]
- Tien MZ, Meyer AG, Sydykova DK, Spielman SJ, Wilke CO. 2013. Maximum allowed solvent accessibilities of residues in proteins. PLoS One 8(11):e80635. [DOI] [PMC free article] [PubMed] [Google Scholar]
- Verma A, Schug A, Lee K, Wenzel W. 2006. Basin hopping simulations for all-atom protein folding. J Chem Phys. 124(4):044515. [DOI] [PubMed] [Google Scholar]
- Wang X, Minasov G, Shoichet BK. 2002. Evolution of an antibiotic resistance enzyme constrained by stability and activity trade-offs. J Mol Biol. 320(1):85–95. [DOI] [PubMed] [Google Scholar]
- Weigt M, White RA, Szurmant H, Hoch JA, Hwa T. 2009. Identification of direct residue contacts in protein–protein interaction by message passing. Proc Natl Acad Sci U S A. 106(1):67–72. [DOI] [PMC free article] [PubMed] [Google Scholar]
- Weinreich DM, Delaney NF, DePristo MA, Hartl DL. 2006. Darwinian evolution can follow only very few mutational paths to fitter proteins. Science 312(5770):111–114. [DOI] [PubMed] [Google Scholar]
- Wright S. 1932. The roles of mutation, inbreeding, crossbreeding, and selection in evolution. Vol. 1. In: Proceedings of the 6th International Congress of Genetics p. 356–366. [Google Scholar]
- Wylie CS, Shakhnovich EI. 2011. A biophysical protein folding model accounts for most mutational fitness effects in viruses. Proc Natl Acad Sci U S A. 108(24):9916–9921. [DOI] [PMC free article] [PubMed] [Google Scholar]
- Zou Z, Zhang J. 2015. Are convergent and parallel amino acid substitutions in protein evolution more prevalent than neutral expectations? Mol Biol Evol.. 32(8):2085–2096 [DOI] [PMC free article] [PubMed] [Google Scholar]
Associated Data
This section collects any data citations, data availability statements, or supplementary materials included in this article.